Family Court Statistics Quarterly: July to September 2020
Updated 18 December 2020

© Crown copyright 2020
This publication is licensed under the terms of the Open Government Licence v3.0 except where otherwise stated. To view this licence, visit nationalarchives.gov.uk/doc/open-government-licence/version/3 or write to the Information Policy Team, The National Archives, Kew, London TW9 4DU, or email: psi@nationalarchives.gov.uk.
Where we have identified any third party copyright information you will need to obtain permission from the copyright holders concerned.
This publication is available at https://www.gov.uk/government/statistics/family-court-statistics-quarterly-july-to-september-2020/family-court-statistics-quarterly-july-to-september-2020
1. Main Points
| Minimal change in the number of cases started in the Family Courts | 68,805 new cases started in Family courts in July to September 2020, similar to the same quarter in 2019. This is due to a combination of increases in private law (up 8%), financial remedy (up 5%) and domestic violence remedy case starts (up 26%), and decreases in adoption (down 12%) and matrimonial case starts (down 10%). |
| On average, care proceedings took longer with fewer disposals within 26 weeks. | The average time for a care or supervision case to reach first disposal was 40 weeks in July to September 2020 , up 7 weeks from the same quarter in 2019. 29% of cases were disposed of within 26 weeks - down 12 percentage points compared to the same period in 2019 and the lowest level since mid-2013. |
| Decrease in the average time for divorce proceedings | The mean average time from petition to decree nisi was 29 weeks, and decree absolute was 53 weeks - both down 1 week when compared to the equivalent quarter in 2019. The median time to decree nisi and decree absolute was 22 and 38 weeks respectively. |
| Decrease in both divorce petitions and decree absolutes | There were 27,803 divorce petitions filed in July to September 2020, down 10% on the equivalent quarter in 2019. There were 22,097 decree absolutes granted in July to September 2020, a decrease of 24% from the same period last year. |
| Increase in both domestic violence remedy applications and orders made. | The number of domestic violence remedy order applications increased by 26% compared to the equivalent quarter in 2019, while the number of orders made increased by 18% over the same period. |
| Decrease in the number of both adoption applications and orders. | In July to September 2020 there were 1,067 adoption applications, down 9% on the equivalent quarter in 2019. Similarly, the number of adoption orders issued decreased by 21% to 1,009. |
| Increase in the deprivation of liberty applications and orders made. | There were 1,744 applications relating to deprivation of liberty in July to September 2020, up 29% on the equivalent quarter in 2019 and the highest level since the series began. Orders increased by 45% in the latest quarter compared to the same period last year. |
| Increase in the proportion of applications for probate grants and probate grants issued made digitally. | In July to September 2020, there were 61,793 applications for probate grants. 60,230 probate grants were issued in the same period. 34% of these applications and 36% of these grants issued were made digitally, compared to 19% and 13% respectively in the same quarter in 2019. |
This publication presents statistics on activity in the family courts of England and Wales and provides figures for the latest quarter (July to September 2020). For further information and technical details please refer to the accompanying Guide to Family Court Statistics.
For feedback related to the content of this publication, please let us know at familycourt.statistics@justice.gov.uk
Consultation notice
The FCSQ team recently held a consultation for users to better understand who uses these statistics, how they use them and what changes might help the team meet user needs better. The consultation was launched on 24th September 2020 and ran for 3 months. It combined questions to gain feedback across the range of documents and information we published, as well as several focused questions on divorce timeliness and Children Act data.
We will be assessing the completed responses to understand the needs of our users and to identify what is and is not possible with the resource available. A full response to this consultation will be published alongside the next FCSQ bulletin, scheduled for publication on 25th March 2021.
Although the closing date for this consultation has now passed, user engagement is a continuous process, and users are invited to submit their comments and suggestions to the team at any time, using the contact details in this publication.
2. Statistician’s comment
The impact of Covid-19 continues to be seen across family court activity this quarter. The start of recovery has been noticeable, particularly in the number of new cases started as well as increases in the number of disposed cases across most areas since the first lockdown period. However, the impacts to timeliness measures continue, with work progressing to address the impact to the family justice system.
Domestic violence remedy cases continue to reach record levels, with substantial increases in both new cases starting and cases that reached a final disposal – up 26% and 42% respectively. Additionally, care proceedings have slowed to the longest average time since mid-2013.
As society and the economy continue to recover from the impact of Covid-19, it is expected that all volumes will eventually return to historic trend levels and may even temporarily exceed the pre-Covid-19 volumes as the backlog of cases is processed. However, volumes are likely to be somewhat suppressed for as long as Covid-19 restrictions remain in place.
To help the system cope with demand, additional venues – referred to as Nightingale courts – have been provided to add temporary capacity to hear cases and help the court system to run as effectively and safely as possible during the coronavirus outbreak. We are working with representative bodies to understand the expected demand and will continue to monitor future trends in both volumes and timeliness.
While these statistics are still believed to be of interest to the public, it is worth noting that the substantially reduced volumes of disposed cases in several areas mean that the data is unlikely to be representative of general trends in family justice.
Caution should therefore be used when interpreting and applying these figures.
3. Overview of the Family Justice System
Similar levels in the number of cases started with a decrease in cases disposed in Family Courts
In July to September 2020, 68,805 new cases started in family courts, similar to the equivalent quarter in 2019. This is a combination of decreases in adoption (12%) and matrimonial (10%) case starts and an increase in domestic violence (26%), private law (8%) and financial remedy (5%) case starts.
There were 55,942 case disposals in July to September 2020, down 10% on the equivalent quarter of 2019. This was due to decreases in most case types: adoption (16%), financial remedy (6%), and private law (1%) cases. However, there was an increase in domestic violence (42%) case disposals. (Table 1)
Figure 1: Cases started and disposed, by case type, January to March 2011 to July to September 2020 (Source: Table 1)
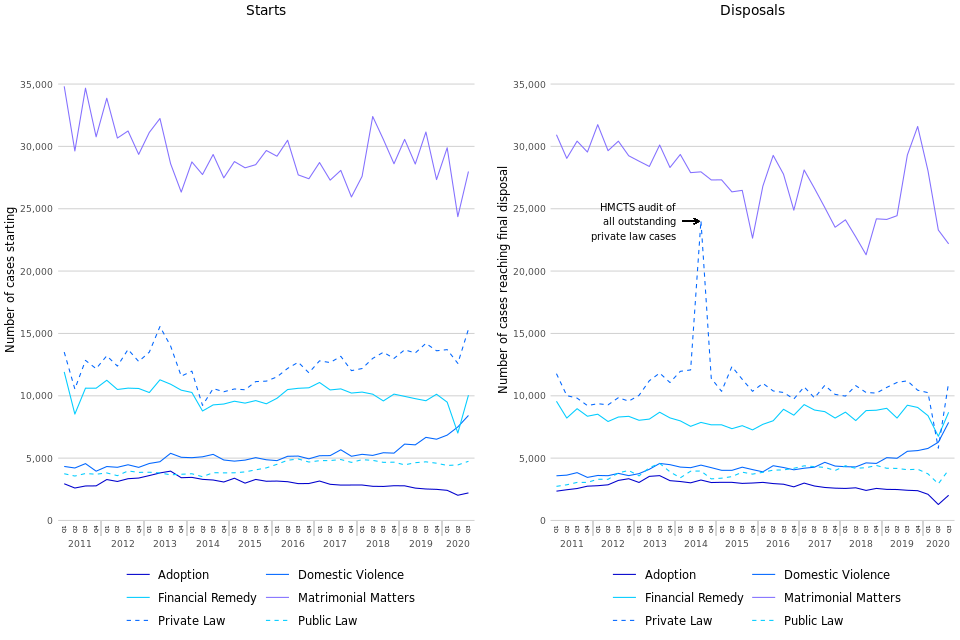
In July to September 2020, 41% of new cases within family courts related to matrimonial matters, down from the equivalent quarter of 2019 (45%).
Timeliness by Case Type
Average time to first disposal varies by case type – public law cases generally take the longest and in 2011, on average, they took nearly a year to reach a first disposal (49 weeks). From 2011, the average fell steadily and by 2016, almost halved to reach 26 weeks.
However, it increased in 2017 to 27 weeks. For July to September 2020 the average was 39 weeks, up from 32 weeks during the same period in 2019 (Table 10).
The average time for divorce and annulment cases to reach first disposal was down 1 week compared to the equivalent quarter in 2019. Private law cases also took longer, with the average time to first disposal in July to September 2020 taking 19 weeks, up 3 weeks compared to the same period in 2019.
Public and private law cases – number of parties, and High Court cases
The vast majority of private law cases involve one applicant and one respondent only (Table 6). However, for public law cases whilst nearly all cases have only one applicant, 75% involve two or more respondents.
A very small proportion of public (2%) and private (1%) law cases started were indicated as being a High Court case during July to September 2020, consistent with the long term trend (Table 7).
HMCTS weekly management information during coronavirus, October 2020 – summary
The statistics in this publication focus on the period between July to September 2020; however, weekly management information (MI) has been published by HMCTS up to the week ending 25th October 2020 https://www.gov.uk/government/statistical-data-sets/hmcts-weekly-management-information-during-coronavirus-march-to-october2020. This MI is subject to the data quality issues associated with extracting data from large live administrative case management systems. Late reporting of cases and regular updating of case details, which can lead to the figures being updated to manage the case - more recent weekly figures are therefore subject to larger revisions and should be treated with greater care and considered provisional.
Taking an average over the four weeks ending 25th October in order to assess the most recent impact of the lockdown period, the MI shows that there was minimal impact on public law receipts throughout the period when compared to the pre-covid-19 baseline (based on an average across the six months September 2019 to February 2020). Disposals have increased by 7 percentage points beyond the pre-covid-19 baseline, the first monthly average increase. Private law receipts are similar to the baseline, whilst disposals were lower in October.
Receipts for divorce continue to increase and are around a third higher than the pre-covid baseline on average for October, related disposals are still substantially lower than the baseline (down 13 percentage points).
The number of probate applications received has continued to surpass the baseline, and the number of grants issued has levelled to around the baseline, after a peak over the summer to recover from the impact of the first couple of months of lockdown.
4. Children Act - Public Law
The number of public law case starts has risen with no change in the number of cases disposed
There were 4,745 public law cases starting in July to September 2020, up by less than 1% compared to the equivalent quarter in 2019. Over the same period there were 4,057 case dispoals, similar compared to the previous year (Table 2).
Average time for care proceedings continues upward trend
The average time for a care and supervision case to reach first disposal was 40 weeks in July to September 2020, up 7 weeks from the same quarter in 2019 and the highest average since mid-2013. 29% of these care proceedings were disposed of within the 26-week limit introduced in the Children and Families Act 2014, down 12 percentage points from the same period last year (Table 8).[footnote 1]
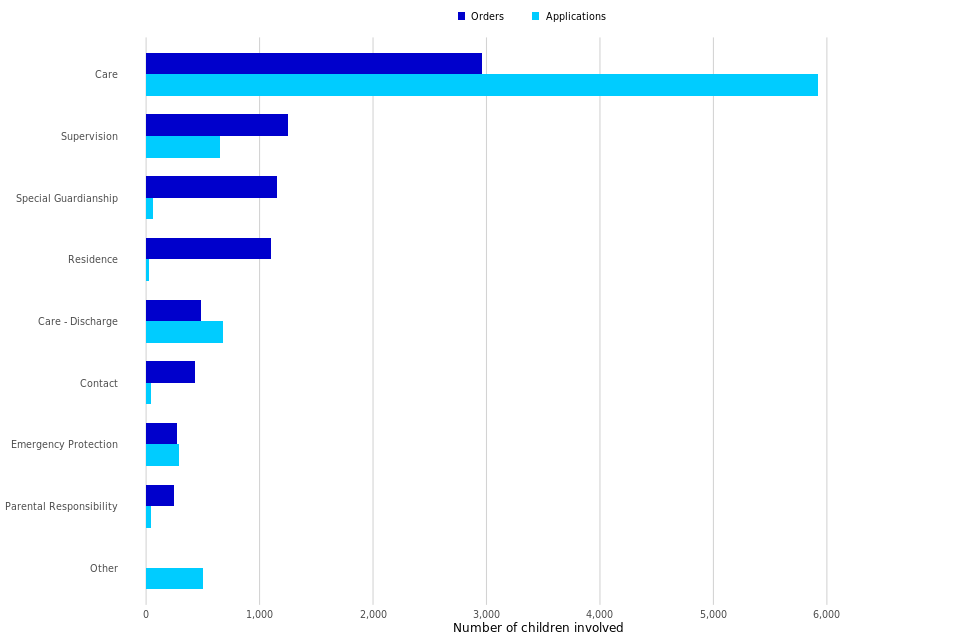
There were 7,910 individual children involved in new public law applications in July to September 2020, up 1% on the same quarter in the previous year, while the number of application events increased by 1%. The number of public law disposal events decreased by 17% over the same period.
Figure 2 shows the most common types of public law orders applied for and made in July to September 2020, illustrating the different pattern between the types of orders applied for and the orders that are given, i.e. an application for one type can result in an order of a different type being made.
Figure 2: Public law applications and orders made, showing the number of children involved in each order type, July to September 2020 (Source: Tables 3-4)
5. Children Act - Private Law
Increase in the number of private law case starts and decrease in the number of cases disposed
The number of private law cases[footnote 2] started increased by 8% in July to September 2020 compared to the equivalent quarter in 2019 to 15,344, the highest since mid-2013. The number of application events increased by 8% over the same period.
The number of private law cases disposed of during July to September 2020 was down 1% on the equivalent quarter in 2019, with the number of court disposal events down by 22% (Table 2).
There were 15,872 new private law application events in July to September 2020, up 8% on the equivalent quarter in 2019, with 23,559 individual children involved in these application events.
The number of private law court disposal events in July to September 2020 was 17,664, down 22% on the equivalent quarter in 2019.
Timeliness of Private law cases
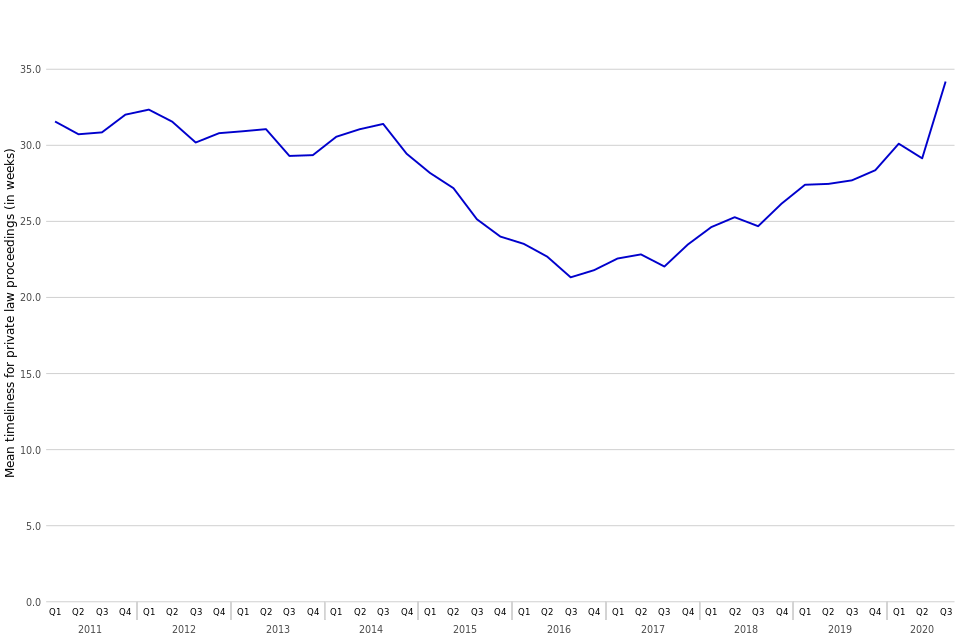
In July to September 2020, it took on average 34 weeks for private law cases to reach a final order, i.e. case closure, up 6 weeks from the same period in 2019. This continues the upward trend seen since the middle of 2016, where the number of new cases overtook the number of disposals, creating a greater number of outstanding cases (Table 9).
Figure 3: Private law timeliness from case start date to final order in the family court, January to March 2011 to July to September 2020 (Source: Table 9)
6. Legal Representation
Cases with legal representation take the longer on average
In general, cases where either both parties or the respondent only had legal representation took longer to be disposed of than those cases where only the applicant was represented or where both parties were without legal representation (Table 10).
Legal representation in private law cases
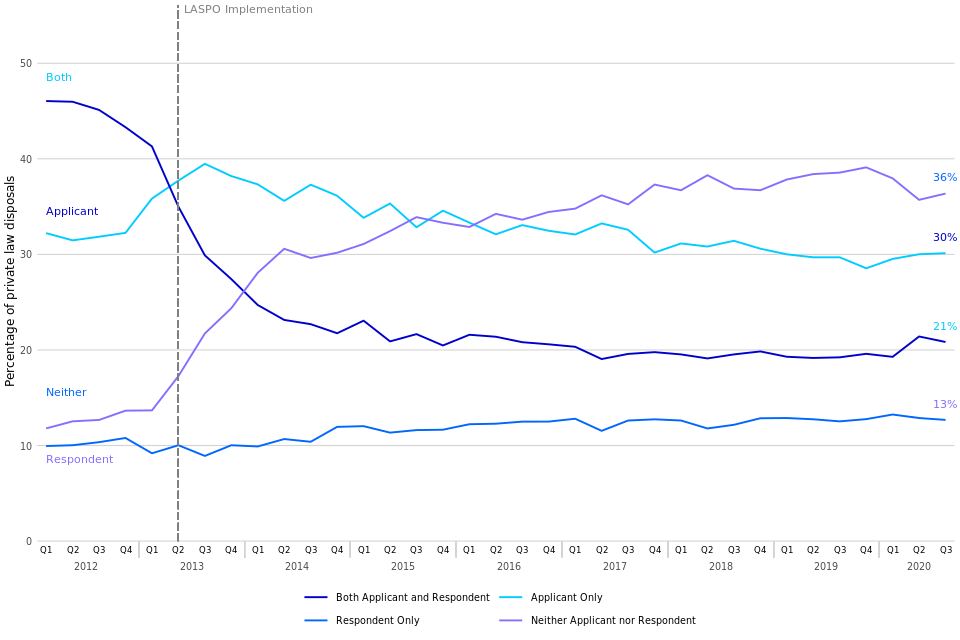
The removal of legal aid for many private law cases in April 2013 resulted in a change in the pattern of legal representation over time[footnote 3],[footnote 4]. In July to September 2020, the proportion of disposals where neither the applicant nor respondent had legal representation was 36%, increasing by 23 percentage points since January to March 2013, and down 2 percentage points from July to September 2019.
Correspondingly, the proportion of cases where both parties had legal representation went from 41% in January to March 2013 to 21% in July to September 2020, up 2 percentage points compared to the same period in 2019 (Figure 4).
Figure 4: Proportion of private law disposals by type of legal representation of the parties, January to March 2012 to July to September 2020 (Source: Table 10)
The change seen in the pattern of legal representation is also demonstrated in private law cases with at least one hearing where the proportion of parties with legal representation stood at 59% in 2012 compared to 31% in July to September 2020.
The proportion of parties with legal representation in cases with at least one hearing varies by case type and range from around 76% for financial remedy cases to 2% for adoption cases, with figures subject to change as new cases progress (Table 11).
7. Divorce
Decrease in the number of divorce petitions and decree absolutes
Divorce petitions were down by 10% in July to September 2020 compared to the same period in the previous year. Decree absolutes granted were down 24% in July to September 2020 compared to the same period in the previous year.
Average time for proceedings decreased
Average time from petition to decree nisi decreased to 29 weeks in July to September 2020, from 30 weeks in the same quarter of 2019 (Table 12).
There were 27,803 divorce petitions made during July to September 2020, down 10% from the same quarter in 2019. There were 22,097 decree absolutes granted in July to September 2020, down 24% compared to the same quarter in 2019 (Table 12).
For those granted decree nisi in July to September 2020, the mean average time from the date of petition was 29 weeks, down 1 week from the same period in 2019. The mean average time from petition to decree absolute was 53 weeks, down 1 week from the equivalent quarter in 2019 and continues the downward trend from a peak of 59 weeks in January to March 2019. The increasing share of divorce cases processed digitally is likely to reduce the average time of divorce proceedings.
The mean timeliness figures can be inflated when historical cases reach decree nisi or decree absolute. These historical cases have less effect on the median timeliness, which may act as a better indicator for the length of current divorce proceedings. In July to September 2020, the median time to decree nisi was 22 weeks and 38 weeks to decree absolute.
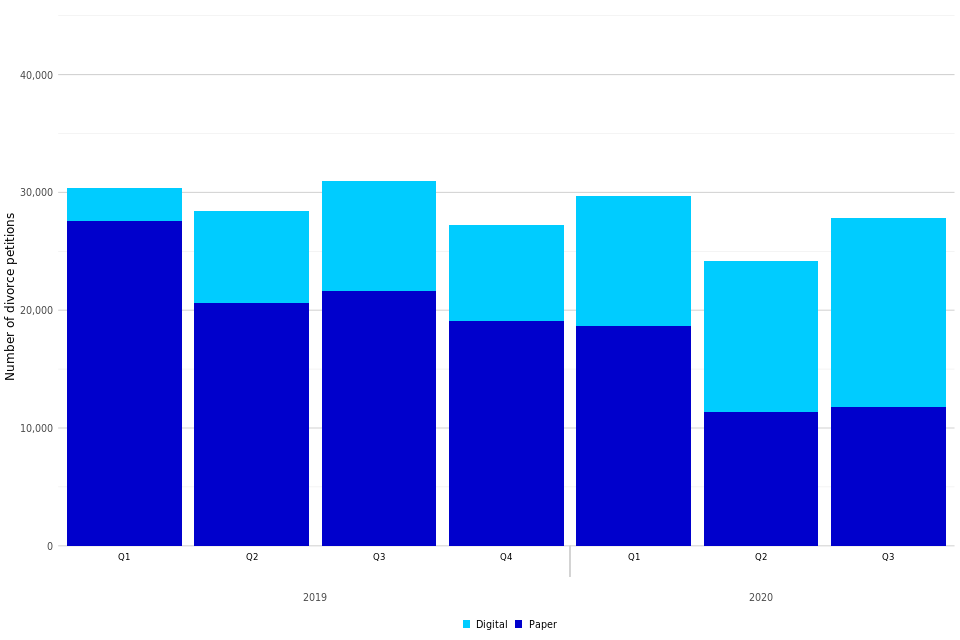
For digital divorce cases (i.e. those dealt with the Courts and Tribunals Service Centres that are digital at all stages), there were 16,008 petitions made during July to September 2020 ( 58% of the total, up from 30% in the same period of 2019 ). The average time to decree nisi for July to September 2020 was 10 weeks , and 18 weeks from petition to decree absolute.
Figure 5: Divorce petitions made between Q1 2019 to Q3 2020, by case type (Source: Table 12)
29% of divorce petitions made between Q1 2011 to Q3 2020 reached decree nisi in the first quarter after the petition was made, with a further 37% reaching this stage within the second quarter. Over half the petitions reached a decree absolute within three quarters after petition (2% in the first quarter, 31% within 1 to 2 quarters and 20% within 2 to 3 quarters) (Table 14).
8. Financial Remedy
Increase seen in financial remedy applications, decrease in disposals events
In July to September 2020, the number of financial remedy applications was up 4% while disposal events were down 8% compared to the same period in 2019 (Table 15).
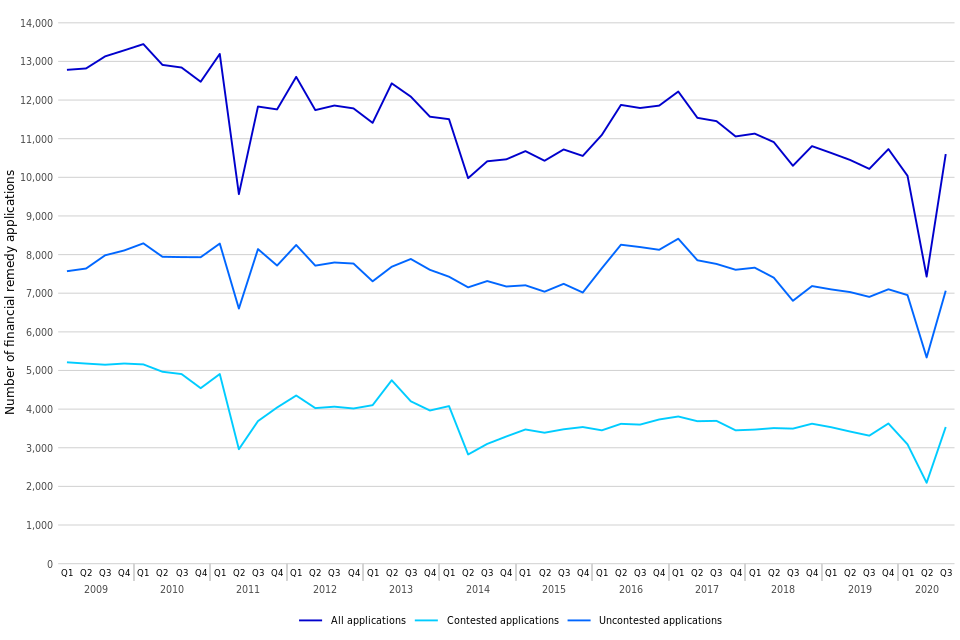
There were 10,602 financial remedy applications made in July to September 2020, up 4% from the same period in 2019, while there were 10,528 financial remedy disposals events, down 8%. During this period, 67% of applications were uncontested, and 33% were contested [footnote 5].
Figure 6: Applications for financial remedy orders, January to March 2009 to July to September 2020 (Source: Table 15)
9. Domestic Violence Remedy Orders
Increase in the number of domestic violence remedy order applications and orders made
In July to September 2020, the number of applications increased by 26% compared to the equivalent quarter in 2019 whilst the number of orders made increased by 18% over the same period (Table 16).
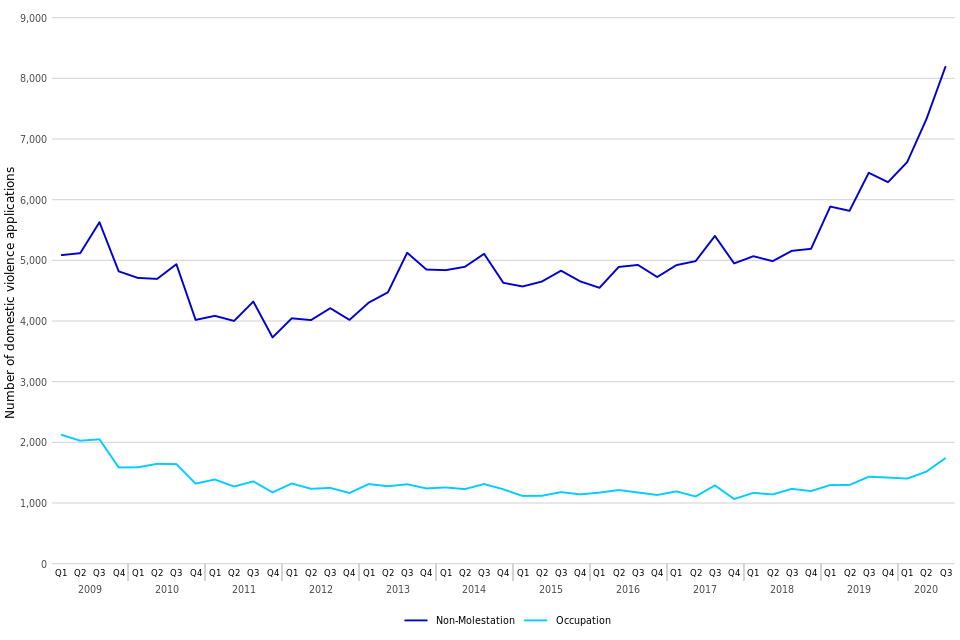
In July to September 2020, there were 9,944 applications made for a domestic violence remedy order, up 26% on the same quarter in 2019 and the highest quarterly number of applications since the time series began at the start of 2009. Most of the applications were for non-molestation orders (82%) compared to occupation orders (18%); these proportions have remained relatively consistent in recent years. Applications for non-molestation orders in July to September 2020 were up 27% compared to the same period in 2019, while occupation orders applications increased by 22%.
There were 10,505 domestic violence orders made in July to September 2020, up 18% from the same period last year. 94% were non-molestation orders and 6% were occupation orders, with non-molestation orders up by 19% and occupation orders down by 3% compared to the equivalent quarter in 2019.
The lockdown situation as a result of the covid-19 pandemic brought warnings about an increase in domestic violence, with victims having less opportunity to leave abusive partners. The recent increased trend supports this assertion. Longer term, police forces have been using a power to release alleged perpetrators without bail conditions, referred to as ‘released under investigation’, since 2017. This is a possible driving factor behind the rise in domestic violence remedy cases, as victims seek protective orders through the courts. The publicity regarding the Domestic Abuse Bill (draft published January 2019 and completed in the Commons stages July 2020) may have also impacted levels.
Figure 7: Applications for domestic violence remedy orders, January to March 2009 to July to September 2020 (Source: Table 16)
10. Forced Marriage Protection Orders and Female Genital Mutilation Protection Orders
General upward trend in the number of forced marriage protection orders and female genital mutilation protection orders, with more recent declines (Table 17 and 18).
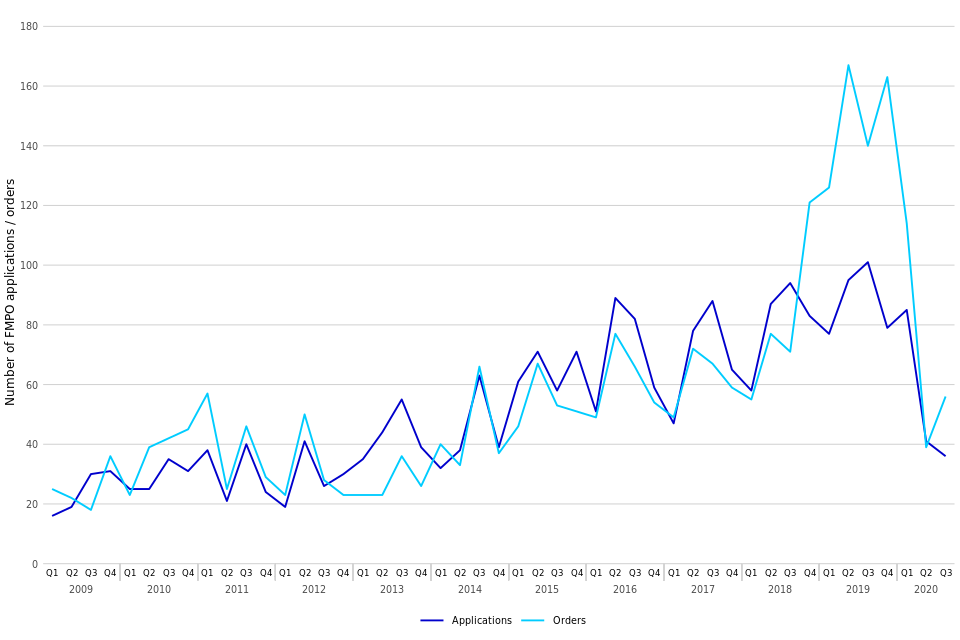
The number of applications and orders made for forced marriage protection orders (FMPOs) is very small. Consequently, numbers fluctuate each quarter but overall there was a general upward trend from their introduction in November 2008 until the end of 2019. However, this seems to have reversed itself during 2020, and in July to September 2020, there were 36 applications, the lowest level since Q1 2013; of the applications this quarter, 47% were for people aged 17 and under.
Over the same period, there were 56 orders made, down 60% since the same period from the previous year. Historically the numbers of orders made outweigh the number of applications. Often there are multiple orders granted per case, where one application covers more than one person, and an order is granted for each person covered in the application. Extensions and increased provision of previous orders can also be granted as new orders, without the need for a new application to be submitted.
Figure 8: Applications and orders made for Forced Marriage Protection Orders, January to March 2009 to July to September 2020 (Source: Table 17)
As with FMPOs, the number of applications and orders made for female genital mutilation protection orders (FGMPOs) is very small, with only 7 applications and 30 orders made respectively in July to September 2020 (Table 19). In total, there have been 465 applications and 644 orders made up to end of September 2020, since their introduction in July 2015.
11. Adoptions
Decrease in the number of adoption applications and orders
During July to September 2020, there were 1,067 adoption applications made, down 9% from the equivalent quarter in 2019. Over the same period, the number of adoption orders issued also decreased by 21% to 1,009 (Tables 19 and 20).
There were 2,229 applications under the Adoption and Children Act 2002, including placement orders during July to September 2020, down 12% on the same quarter in the previous year. Total disposals decreased by 16% to 2,057 over the same period.
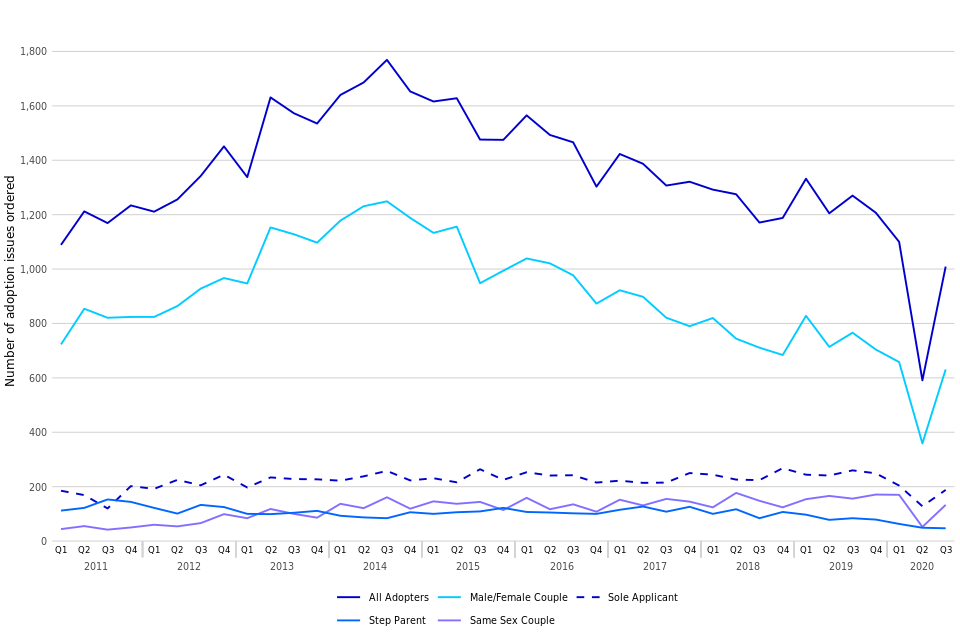
The chart below shows the trend of adoption orders by the type of adopter. This shows that during July to September 2020, 63% of all adoption orders were issued to mixed-sex couples, 19% to sole applicants, 13% to same-sex couples and 5% to step-parents.
Figure 9: Adoption orders issued, by adopter, January to March 2011 to July to September 2020 (Source: Table 20)
12. Mental Capacity Act - Court of Protection
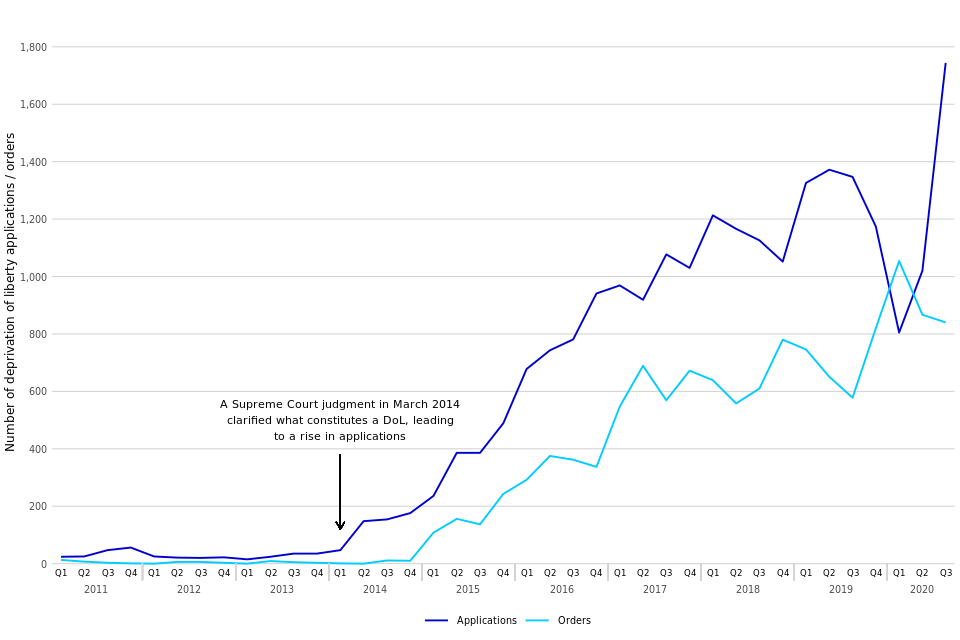
Continued increasing trend in applications and orders made in relation to deprivation of liberty
There were 1,744 applications relating to deprivation of liberty made in the most recent quarter, which is an increase of 29% on the number made in the same quarter in 2019. Furthermore, there was an increase by 45% in the orders made for deprivation of liberty over the same period from 578 to 840.
A decrease in applications whilst orders increase under the Mental Capacity Act 2005 (MCA)
There were 8,937 applications made in July to September 2020 down by 5%. During the same period there were 13,384 orders made, up by 10%.
Figure 10: Deprivation of Liberty applications and orders, January to March 2008 to July to September 2020 (Source: Table 22)
In July to September 2020, there were 8,937 applications made under the Mental Capacity Act 2005 (MCA), down by 5% on the equivalent quarter in 2019 (9,407 applications). Of those, 38% related to applications for appointment of a property and affairs deputy (Table 21).
In comparison, there were 13,384 orders made under the Mental Capacity Act 2005 (MCA), up by 10% on the same quarter in 2019 . Of those, 42% related to applications by an existing deputy or registered attorney (Table 22).
13. Mental Capacity Act - Office of the Public Guardian
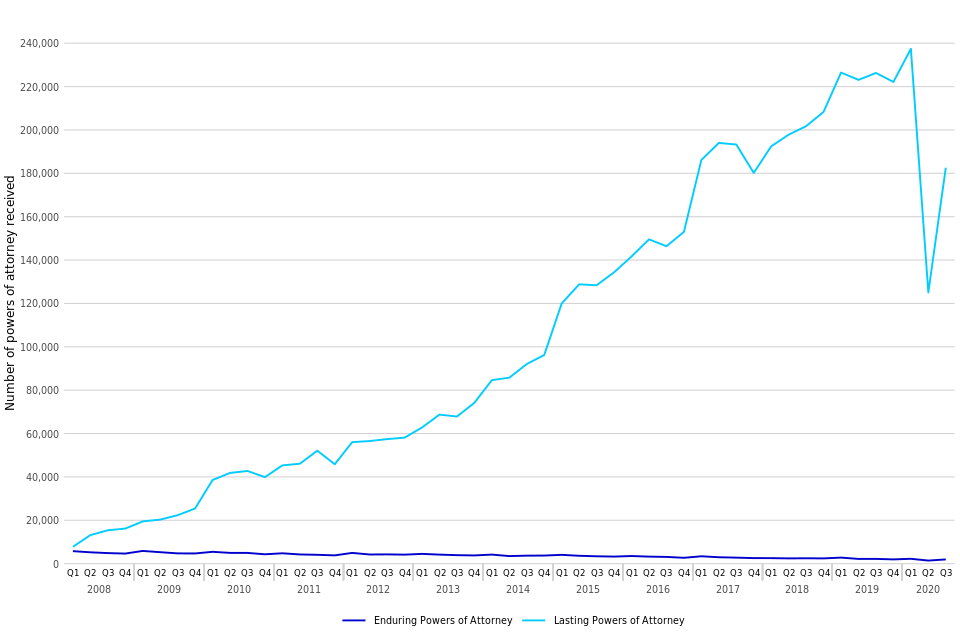
Historical increasing trend in Lasting Powers of Attorney (LPAs), with a drop since the first coronavirus lockdown period
In July to September 2020, there were 182,595 LPAs received, down 19% compared to the equivalent quarter in 2019 (Table 23).
In total there were 184,542 Powers of Attorney (POAs) received in July to September 2020, down 19% from the same quarter in 2019 (Table 23). Lasting Power of Attorney (LPAs) made up 99% of POAs received in July to September 2020, with Enduring Powers of Attorney (EPAs) making up the other 1%. The sharp increase in LPAs seen during 2015 and 2016 was largely due to increased publicity and the new online forms introduced in July 2015 making it simpler and faster to apply.
There were 1,947 EPAs in July to September 2020, down 11% on the equivalent quarter in 2019.
Figure 11: Powers of attorney received, January to March 2008 to July to September 2020 (Source: Table 23)
14. Probate Service
Increase in the proportion of applications for probate grants and probate grants issued made digitally
In July to September 2020, there were 61,793 applications for probate grants. 60,230 probate grants were issued in the same period. 34% of these applications and 36% of these grants issued were made digitally, compared to 19% and 13% respectively in the same quarter in 2019 (Table 24).
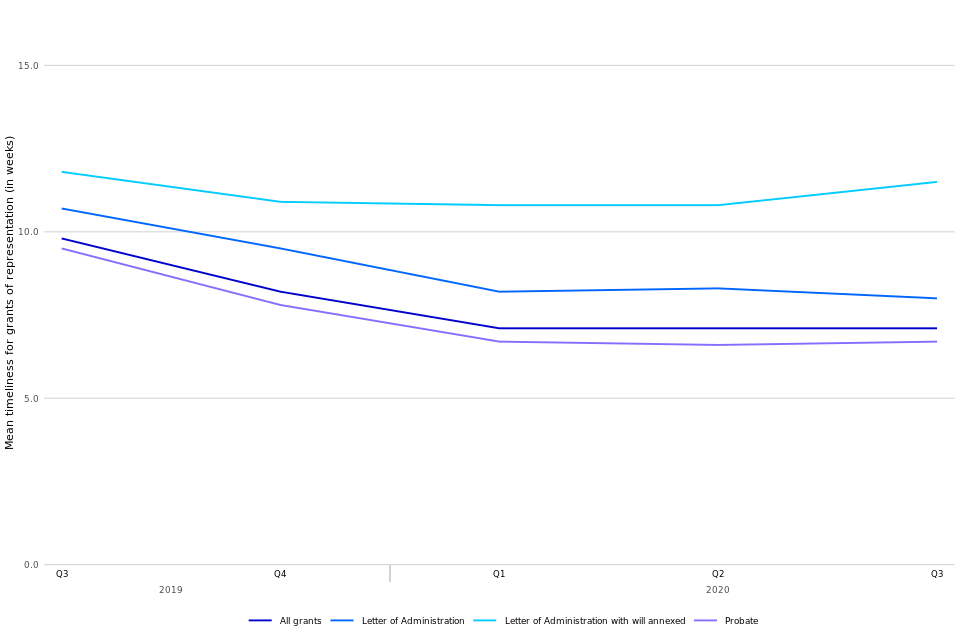
Probate grants take a similar time to be issued compared to other grants of representation
Probate grants took approximately 7 weeks to be issued after the application was submitted during July to September 2020. Letters of administration with a will and without a will were around 12 and 8 weeks respectively (Table 26).
There were 74,643 applications made for grants of representation in July to September 2020, 61,793 (83%) of these were for probate grants, of which 34% were made digitally (Table 24).
Probate grants also make up the majority (83%) of all grants issued. In July to September 2020 , 55% of the grants issued were applied for by legal professionals and 45% were personal applications (Table 24). For the 60,230 probate grants issued in the same period, 36% were issued digitally.
The average time from application submission to grant issue for probate grants was 7 weeks (median average 5 weeks) overall. Averages for letters of administration with a will and without a will were 11 and 8 weeks respectively for July to September 2020 (Table 26).
When looking at the time from document receipt (i.e. when all accompanying documents and payment have been confirmed with the application) to grant issue, this nearly a week quicker than the average time from application submission for probate grants .
Figure 12: Grants of representation issued by the Probate Service, July to September 2019 to July to September 2020 (Source: Table 26)[footnote 6]
15. Further information
The data presented in this publication are from live administrative databases. Therefore, previously published data is liable to be updated in the latest bulletin, following any further data cleaning or the incorporation of additional cases not available in the extracts used to produce previous bulletins.
Accompanying files
As well as this bulletin, the following products are published as part of this release:
-
A technical guide providing further information on how the data is collected and processed, as well as information on the revisions policy and legislation relevant to family court and background on the functioning of the family justice system
-
A set of overview tables and CSV files, covering each section of this bulletin
National Statistics status
National Statistics status means that official statistics meet the highest standards of trustworthiness, quality and public value.
All official statistics should comply with all aspects of the Code of Practice for Official Statistics. They are awarded National Statistics status following an assessment by the Authority’s regulatory arm. The Authority considers whether the statistics meet the highest standards of Code compliance, including the value they add to public decisions and debate.
It is the Ministry of Justice’s responsibility to maintain compliance with the standards expected for National Statistics. If we become concerned about whether these statistics are still meeting the appropriate standards, we will discuss any concerns with the Authority promptly. National Statistics status can be removed at any point when the highest standards are not maintained, and reinstated when standards are restored.
Contact
Press enquiries should be directed to the Ministry of Justice press office:
Tel: 0203 334 3536
Email: newsdesk@justice.gsi.gov.uk
Other enquiries about these statistics should be directed to the Justice Statistics Analytical Services division of the Ministry of Justice:
Carly Gray, Head of Civil, Administrative and Family Justice Statistics
Email: ESD@justice.gov.uk
Next update: 25 March 2021
URL: https://www.gov.uk/government/collections/family-court-statistics-quarterly
© Crown copyright
Produced by the Ministry of Justice
Alternative formats are available on request from ESD@justice.gov.uk
-
See the accompanying technical guide for more information. ↩
-
The Children and Family Court Advisory and Support Service (Cafcass) also publishes (England only) data on the number of private law cases. A comparison of Cafcass and MoJ data and further information can be found in the accompanying guide. ↩
-
Please see the accompanying guide for further details. ↩
-
Removal of Legal Aid was a result of the Legal Aid, Sentencing & Punishment of Offenders Act 2012 (LASPO). ↩
-
Since this bulletin was first released on 17th December these figures were corrected from 63% to 67% and 73% to 33% respectively. ↩
-
Due to quality issues in the transition between data systems, the breakdown by type of grants of representation for Q2 2019 were rounded estimates only, with the average distribution across 2016 to 2018 applied to the known total. These estimates then feed into the total for 2019. ↩