Family Court Statistics Quarterly: January to March 2020
Published 25 June 2020

© Crown copyright 2020
This publication is licensed under the terms of the Open Government Licence v3.0 except where otherwise stated. To view this licence, visit nationalarchives.gov.uk/doc/open-government-licence/version/3 or write to the Information Policy Team, The National Archives, Kew, London TW9 4DU, or email: psi@nationalarchives.gov.uk.
Where we have identified any third party copyright information you will need to obtain permission from the copyright holders concerned.
This publication is available at https://www.gov.uk/government/statistics/family-court-statistics-quarterly-january-to-march-2020/family-court-statistics-quarterly-january-to-march-2020
For the first time we are publishing this statistical bulletin in HTML format alongside the usual PDF version and we are seeking user feedback on the use of HTML for the publication of statistical bulletins. Please send any comments to: datausers@justice.gov.uk.
1. Main Points
| Decrease in the number of cases started in the Family Courts | 65,553 new cases started in Family courts in January to March 2020 down 3% on the same quarter in 2019. This is due to a 15% decrease in financial remedy cases, a 14% decrease in adoption case starts and a 3% decrease in matrimonial case starts. |
| On average, care proceedings took 2 weeks longer with fewer disposals within 26 weeks. | The average time for a care or supervision case to reach first disposal was 35 weeks in January to March 2020 up 2 weeks from the same quarter in 2019. 36% of cases were disposed of within 26 weeks - down 7 percentage points compared to the same period in 2019. |
| Decrease in the average time to divorce proceedings | The mean average time from petition to decree nisi was 28 weeks, and decree absolute was 55 weeks - both down around 5 weeks when compared to the equivalent quarter in 2019. The median time to decree nisi was 20 and 38 for decree absolute. |
| Decrease in the number of divorce petitions, while decrees absolute increase. | There were 29,540 divorce petitions filed in January to March 2020, down 3% in the equivalent quarter in 2019. There were 27,888 decree absolutes granted in January to March 2020, an increase of 16% from the same period last year. |
| Increase in both domestic violence remedy applications and orders made. | The number of domestic violence remedy order applications increased by 12% compared to the equivalent quarter in 2019 while the number of domestic violence remedy orders made increased by 8% over the same period. |
| Decrease in the number of both adoption applications and orders. | In January to March 2020 there were 1,083 adoption applications, down 18% on the equivalent quarter in 2019. Similarly, the number of adoption orders issued decreased by 19% to 1,079. |
| Decrease in the deprivation of liberty applications and increase in the orders made. | There were 805 applications relating to deprivation of liberty in January to March 2020, down 39% on the equivalent quarter in 2019. However, orders increased by 41% in the latest quarter compared to the same period last year. |
This publication presents statistics on activity in the family courts of England and Wales and provides figures for the latest quarter (January to March 2020). For further information and technical details please refer to the accompanying Guide to Family Court Statistics.
For feedback related to the content of this publication, please let us know at familycourt.statistics@justice.gov.uk
2. Statistician’s comment
The family justice system enables families to avoid disputes where possible but it also enables them to resolve problems as quickly as possible should they arise. Family law covers a range of issues – local authority intervention to protect children, parental disputes regarding the upbringing of children, divorce and domestic violence remedies amongst others.
The period covered by this publication is January to March 2020 (pre-Covid-19) and will therefore include only minimal Covid-19-related impact on the activities of the courts, and we expect that activity in the family justice system to reduce further after April 2020.
The family justice system appears to have slowed in the period leading up to the lockdown bought on by Covid-19. Looking at January to March 2020, the total number of new cases started in family courts has fallen across most case types compared to the same period last year. The fall has been driven largely by financial remedy cases, which fell by around 1,500 cases, or 15%. However, the number of cases disposed of (or completed) rose overall, driven mainly by matrimonial cases, up by nearly 4,000 cases, or 16%. In January to March 2020, the time taken for public law cases has increased from an average of 33.5 weeks, up from nearly 32 weeks in January to March 2019. However, divorce cases took around 5 weeks less than in the same period last year, which may demonstrate the impact of the digital divorce system on the timeliness of divorce cases.
Domestic violence remedy orders increased over the last year, with ‘cases started’ increasing by 12% and ‘cases disposed of’ increasing by 27%. The number of applications, cases started and cases disposed of were at their highest level in January to March 2020 since the series started in 2011.
3. Overview of the Family Justice System
Decrease in the number of cases starting and decrease in the number of cases disposed in Family Courts
In January to March 2020, 65,553 new cases started in family courts, down 3% on the equivalent quarter in 2019. This was due to decreases in most case types: financial remedy (15%), adoption (14%) and matrimonial (3%). However, there was an increase in domestic violence (12%).
There were 58,359 case disposals in January to March 2020, up 5% on the equivalent quarter of 2019. This was due to increases in matrimonial (16%) and domestic violence (27%) cases. However, there were decreases in adoption (22%), public law (13%), financial remedy (10%) and private law (6%) case disposals (Table 1).
Figure 1: Cases started and disposed, by case type, January to March 2011 to January to March 2020 (Source: Table 1)
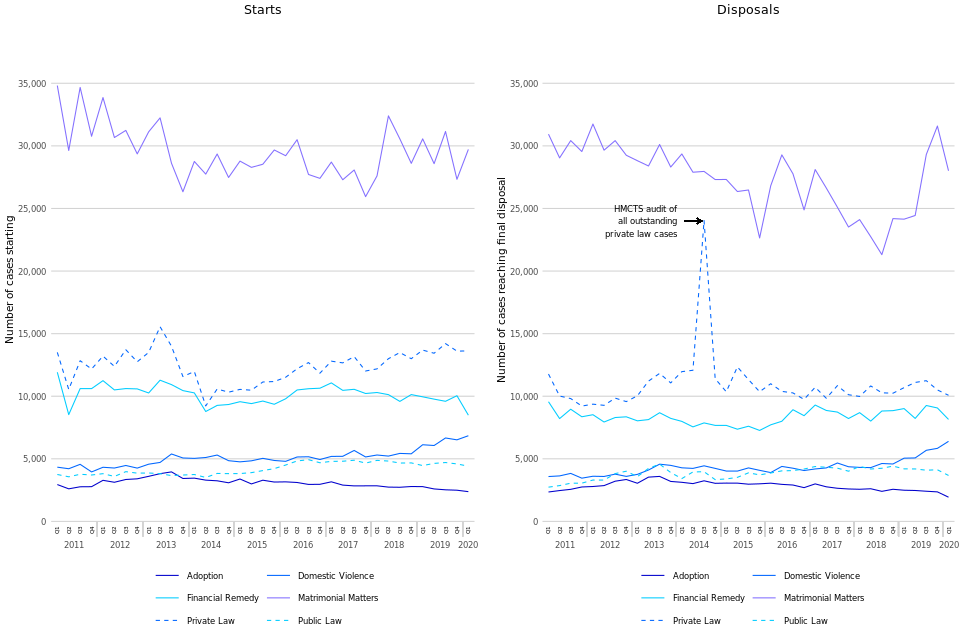
Chart showing cases started and disposed, by case type, January to March 2011 to January to March 2020 (source: Table 1)
In January to March 2020, 45% of new cases within family courts related to matrimonial matters, the same as the equivalent quarter of 2019.
Timeliness by Case Type
Average time to first disposal varies by case type – public law cases generally take the longest and in 2011, on average, they took nearly a year to reach a first disposal (50 weeks). From 2011, the average fell steadily and by 2016, almost halved to reach 26 weeks.
However, it increased in 2017 to 27 weeks. For January to March 2020 the average was 33 weeks, up from 32 during the same period in 2019.
The average time for divorce and annulment cases to reach first disposal was down 5 weeks compared to the equivalent quarter in 2019. Private law cases also saw an increase in timeliness, with the average time to first disposal in January to March 2020 taking 17 weeks, up one week compared to the same period in 2019. (Table 10).
Public and Private law cases – number of parties, and High Court cases
The vast majority of private law cases involve one applicant and one respondent only (Table 6). However, for public law cases whilst nearly all have only one applicant, 74% involve two or more respondents.
A very small proportion of public (2%) and private (1%) law cases started were indicated as being a High Court case during January to March 2020, consistent with the long term trend (Table 7).
4. Children Act - Public Law
The number of public law case starts and final disposals has fallen
There were 4,413 public law cases starting in January to March 2020, down 1% compared to the equivalent quarter in 2019. Cases disposed were down 13% to 3,671 (Table 2).
Average time for care proceedings continues upward trend
The average time for a care and supervision case to reach first disposal was 35 weeks in January to March 2020, up 2 weeks from the same quarter in 2019 and the highest average since early 2014. 36% of these care proceedings were disposed of within the 26-week limit introduced in the Children and Families Act 2014, down 7 percentage points from the same period last year (Table 8).[footnote 1]
There were 7,398 individual children involved in new public law applications in January to March 2020, down 2% on the same quarter in the previous year, while the number of application events decreased by 1%. The number of public law disposal events decreased by 13% over the same period.
Figure 2 shows the most common types of public law orders applied for and made in January to March 2020, illustrating the different pattern between the types of orders applied for and the orders that are given, i.e. an application for one type can result in an order of a different type being made.
Figure 2: Public law applications and orders made, showing the number of children involved in each order type, January to March 2020 (Source: Tables 3-4)
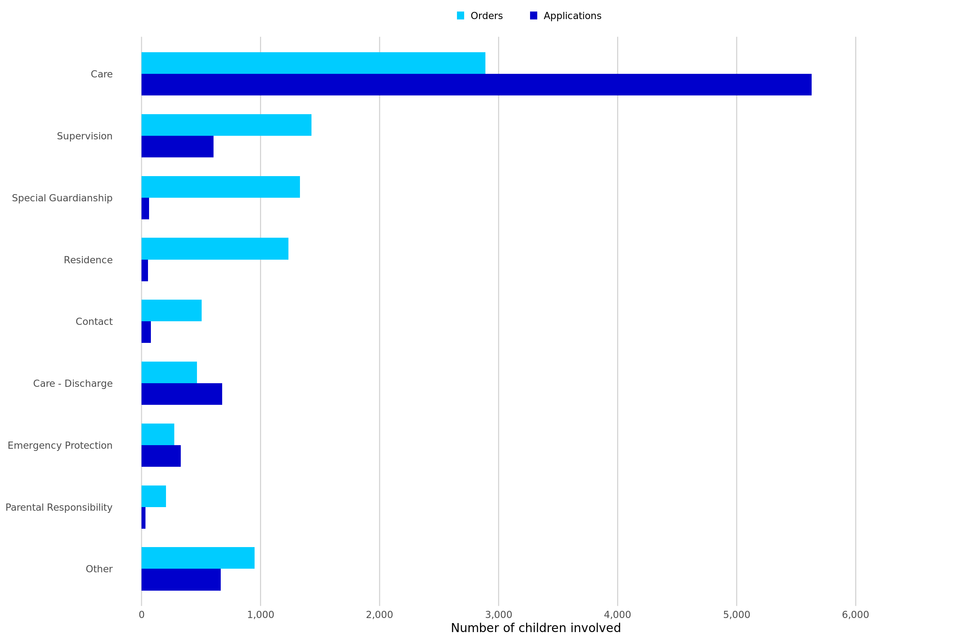
Chart showing public law applications and orders made, showing the number of children involved in each order type, January to March 2020 (Source: Tables 3 and 4)
5. Children Act - Private Law
Decrease in the number of private law disposals with no change in the number of case starts
During January to March 2020, there were 13,618 private law case[footnote 2] starts, unchanged compared to the equivalent quarter in 2019. There was no change in the number of application events over the same period.
The number of private law cases disposed of in January to March 2020 was down 6% on the equivalent quarter in 2019, with the number of court disposal events down by 8% (Table 2).
There were 14,136 new private law application events in January to March 2020, unchanged compared to the equivalent quarter in 2019, with 20,981 individual children involved in these application events.
The number of private law court disposal events in January to March 2020 was 19,124, down 8% on the equivalent quarter in 2019.
Timeliness of Private law cases
In January to March 2020, it took on average 31 weeks for private law cases to reach a final order, i.e. case closure, up 4 weeks from the same period in 2019. This continues the upward trend seen since the middle of 2016, where the number of new cases started overtook the number of disposals, creating a greater number of outstanding cases (Table 9).
Figure 3: Private law timeliness from case start date to final order in the family court, January to March 2011 to January to March 2020 (Source: Table 9)
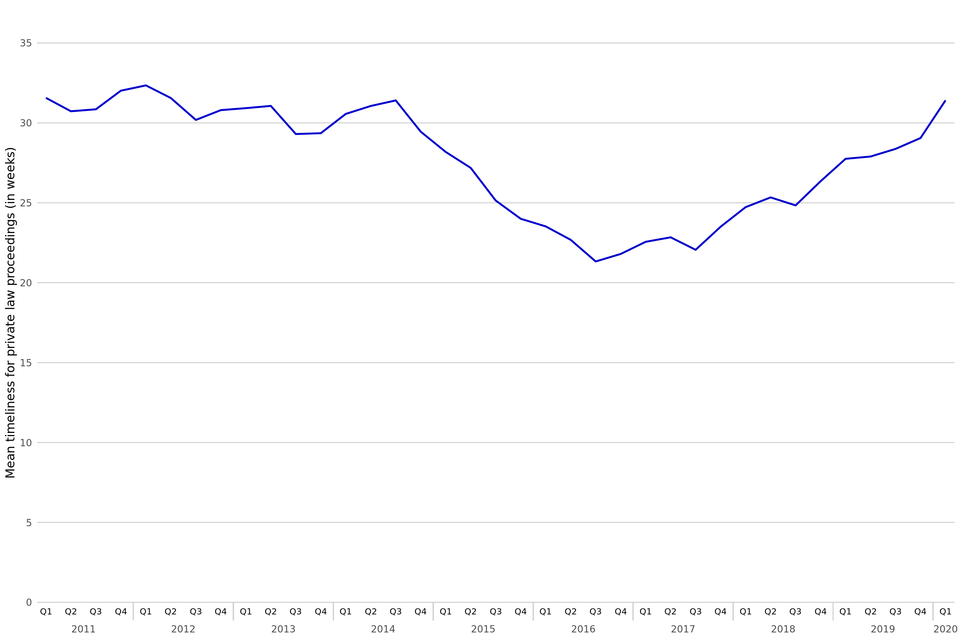
Chart showing private law timeliness from case start date to final order in the family court, January to March 2011 to January to March 2020 (Source: Table 9)
6. Legal Representation
For most case types, cases where only the respondent has legal representation take the longest on averag
In general, cases where either both parties or the respondent only had legal representation took longer to be disposed of than those cases where only the applicant was represented or where both parties were without legal representation (Table 10).
Legal representation in private law cases
The removal of legal aid for many Private law cases in April 2013 resulted in a change in the pattern of legal representation over time[footnote 3],[footnote 4]. In January to March 2020, the proportion of disposals where neither the applicant nor respondent had legal representation was 39%, increasing by 25 percentage points since January to March 2013, and up one percentage point from January to March 2019.
Correspondingly, the proportion of cases where both parties had legal representation went from 41% in January to March 2013 to 18% in January to March 2020, down two percentage points percentage points compared to the same period in 2019 (Figure 4).
Figure 4: Proportion of private law disposals by type of legal representation of the parties, January to March 2012 to January to March 2020 (Source: Table 10)
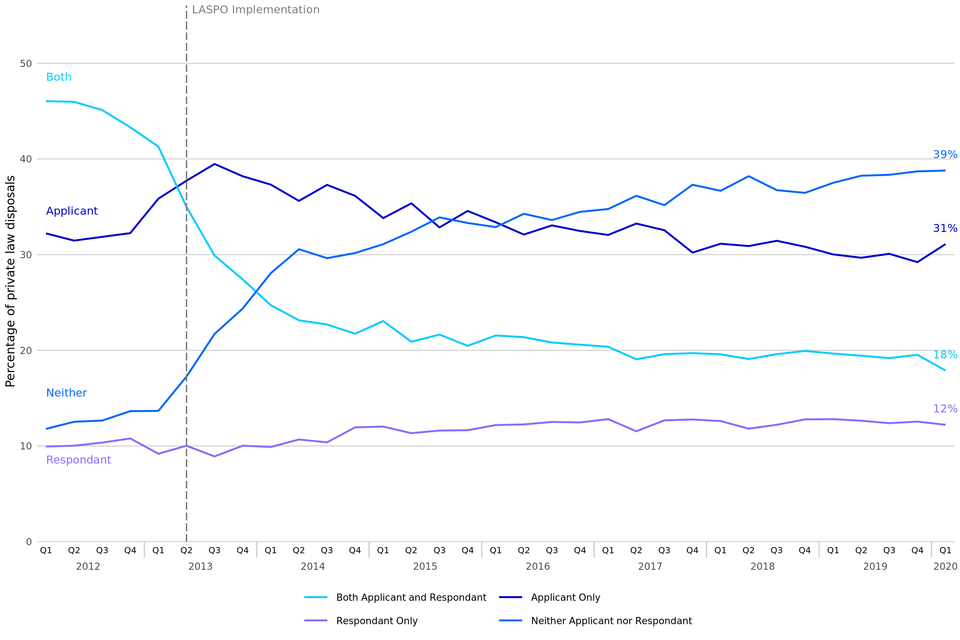
Chart showing proportion of private law disposals by type of legal representation of the parties, January to March 2012 to January to March 2020 (Source: Table 10)
The change seen in the pattern of legal representation is also demonstrated in private law cases with at least one hearing where the proportion of parties with legal representation stood at 59% in 2012 compared to 31% in January to March 2020.
The proportion of parties with legal representation in cases with at least one hearing varies by case type and range from around 71% for financial remedy to 2% for adoption cases, with figures subject to change as new cases progress (Table 11).
7. Divorce
Decrease in the number of divorce petitions while number of decrees absolute increases
Divorce petitions were down by 3% in January to March 2020 compared to the same period in the previous year. Decrees absolute granted were up 16% in January to March 2020 compared to the same period in the previous year.
Average time for proceedings increased
Average time from petition to decree nisi decreased to 28 weeks in January to March 2020, from 33 weeks in the same quarter of 2019 (Table 12).
There were 29,540 divorce petitions made during January to March 2020, down 3% from the same quarter in 2019. There were 27,888 decrees absolute granted in January to March 2020, up 16% compared to the same quarter in 2019 (Table 12).
For those granted decree nisi in January to March 2020, the mean average time from the date of petition was 28 weeks, down 5 weeks from the same period in 2019. The mean average time from petition to decree absolute was 55 weeks, down 5 weeks from the series peak of 59 weeks in the equivalent quarter in 2019. The increasing share of petition work moving online is likely to be contributing to this fall in the average time of divorce proceedings.
The mean timeliness figures can be inflated when historical cases reach decree nisi or decree absolute. These historical cases have less effect on the median timeliness, which may act as a better indicator for the length of current divorce proceedings. In January to March 2020, the median time to decree nisi was 20 weeks and 38 weeks to decree absolute.
For digital divorce cases (i.e. those that are digital at all stages), there were 11,387 petitions made during January to March 2020 (39% of the total). The average time to decree nisi for January to March 2020 was 11 weeks, and 21 weeks from petition to decree absolute.
Table 14 and Figure 5 shows how long it takes, on average, for petitions to reach certain stages in the process, counted by the number of quarters elapsed.
Figure 5: Percentage of divorce cases started between Q1 2011 to Q1 2020 reaching Decree Nisi or Decree Absolute, by the number of quarters since petition (Source: Table 14)
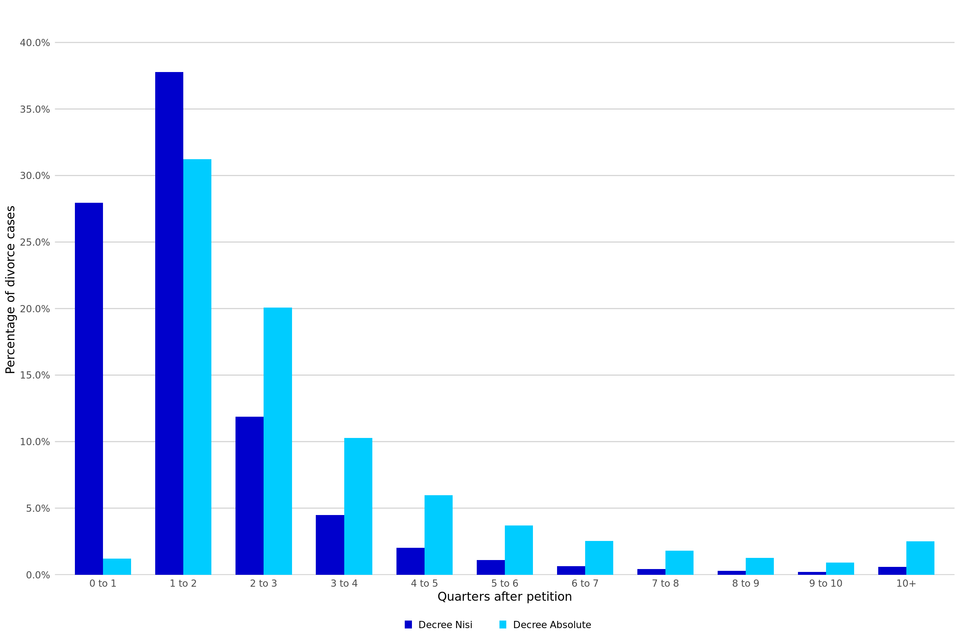
Chart showing percentage of divorce cases started between Q1 2011 to Q1 2020 reaching decree nisi or decree absolute, by the number of quarters since petition (Source: Table 14)
28% of divorce petitions made between Q1 2011 to Q1 2020 reached decree nisi in the first quarter after the petition was made, with a further 38% reaching this stage within the second quarter. Over half the petitions reached a decree absolute within three quarters after petition (1% in the first quarter, 31% within 1 to 2 quarters and 20% within 2 to 3 quarters).
8. Financial Remedy
Decrease seen in financial remedy applications and disposals events
In January to March 2020, the number of financial remedy applications was down 15% and disposal events were down 9% compared to the same period in 2019 (Table 15).
There were 8,993 financial remedy applications made in January to March 2020, down 15% from the same period in 2019, while there were 9,862 financial remedy disposals events, down 9%. During this period, 72% of disposal events were uncontested, 18% were initially contested and 10% were contested throughout.
Please note that data previously provided in Table 16 and in this chapter (a split of financial remedy disposals by the type of remedy) has been removed, as indicated in the Family Court Statistics Quarterly website on 21st April 2020. Due to differing ways of applying for these in the sector (some request all types, either to have an order made or to be dismissed, others just request the type they require the order for), it has been deemed that the quality of this data is not suitable for publication in a National Statistics bulletin. Work is ongoing to collect robust data on orders made and this will be reported on when available.
9. Domestic Violence Remedy Orders
Increase in the number of domestic violence remedy order applications and orders made
In January to March 2020, the number of applications increased by 12% compared to the equivalent quarter in 2019 whilst the number of orders made increased by 8% over the same period (Table 16).
In January to March 2020, there were 8,022 applications made for a domestic violence remedy order, up 12% on the same quarter in 2019 and the highest quarterly number of applications since the time series began at the start of 2009. Most of the applications were for non-molestation orders (83%) compared to occupation orders (17%); these proportions have remained relatively consistent in recent years. Applications for non-molestation orders in January to March 2020 were up 12% compared to the same period in 2019, while occupation orders applications increased by 8%.
There were 8,716 domestic violence orders made in January to March 2020, up 8% from the same period last year. 93% were non-molestation orders and 7% were occupation orders, with non-molestation orders up 9% and occupation orders up 1% compared to the equivalent quarter in 2019.
Police forces have been using a power to release alleged perpetrators without bail conditions, referred to as ‘released under investigation’, since 2017. This is a possible driving factor behind the ruse in domestic violence remedy cases, as victims seek protective orders through the courts. More recently, the increased volume may have been as a result in the publicity regarding the draft Domestic Abuse Bill (published January 2019).
Figure 6: Applications for domestic violence remedy orders, January to March 2009 to January to March 2020 (Source: Table 16)
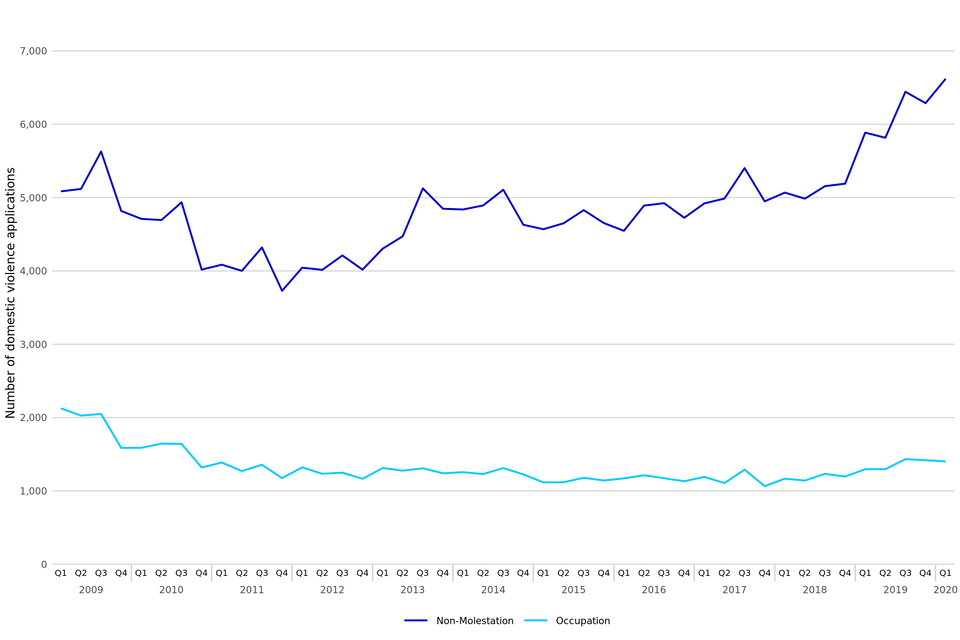
Chart showing applications for domestic violence remedy orders, January to March 2009 to January to March 2020 (Source: Table 16)
10. Forced Marriage Protection Orders and Female Genital Mutilation Protection Orders
General upward trend in the number of forced marriage protection orders and female genital mutilation protection orders (Table 17 and 18). ***
The number of applications and orders made for forced marriage protection orders (FMPOs) is very small. Consequently, numbers fluctuate each quarter but overall there has been a general upward trend since their introduction in November 2008. In January to March 2020, there were 78 applications, of which 69% of applications were aged 17 and under.
Over the same period, there were 107 orders made, down 15% since the same period from the previous year. Often there are multiple orders granted per case, where one application covers more than one person, and an order is granted for each person covered in the application. Extensions and increased provision of previous orders can also be granted as new orders, without the need for a new application to be submitted. This explains why the increase in the number of orders is not reflected to the same degree in the number of applications.
Figure 7: Applications and orders made for Forced Marriage Protection Orders, January to March 2009 to January to March 2020 (Source: Table 17)
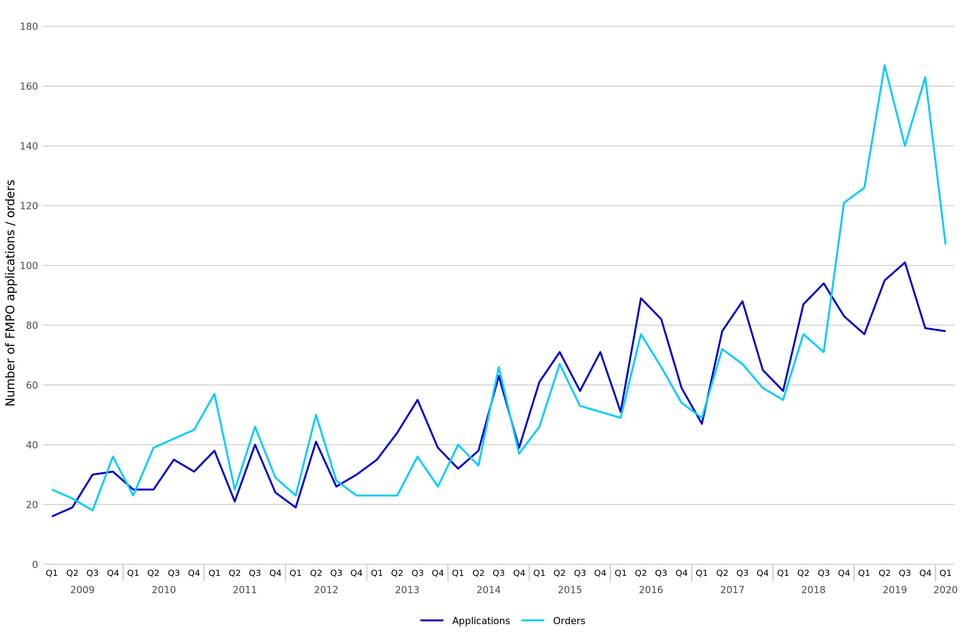
Chart showing applications and orders made for Forced Marriage Protection Orders, January to March 2009 to January to March 2020 (Source: Table 17)
As with FMPOs, the number of applications and orders made for female genital mutilation protection orders (FGMPOs) is very small, with only 19 applications and 2 orders made respectively in January to March 2020 (Table 18). In total, there have been 449 applications and 584 orders made up to end of March 2020, since their introduction in July 2015.
11. Adoptions
Decrease in the number of adoption applications and orders
During January to March 2020, there were 1,083 adoption applications made, down 18% from the equivalent quarter in 2019. Over the same period, the number of adoption orders issued also decreased by 19% to 1,079 (Tables 19 and 20).
There were 2,403 applications under the Adoption and Children Act 2002, including placement orders during January to March 2020, down 14% on the same quarter in the previous year. Total disposals decreased by 22% to 1,963 over the same period.
Figure 8 below shows the trend of adoption orders by the type of adopter. This shows that during January to March 2020, 60% of all adoption orders were issued to mixed-sex couples, 19% to sole applicants, 15% to same-sex couples and 6% to step-parents.
Figure 8: Adoption orders issued, by adopter, January to March 2011 to January to March 2020 (Source: Table 20)
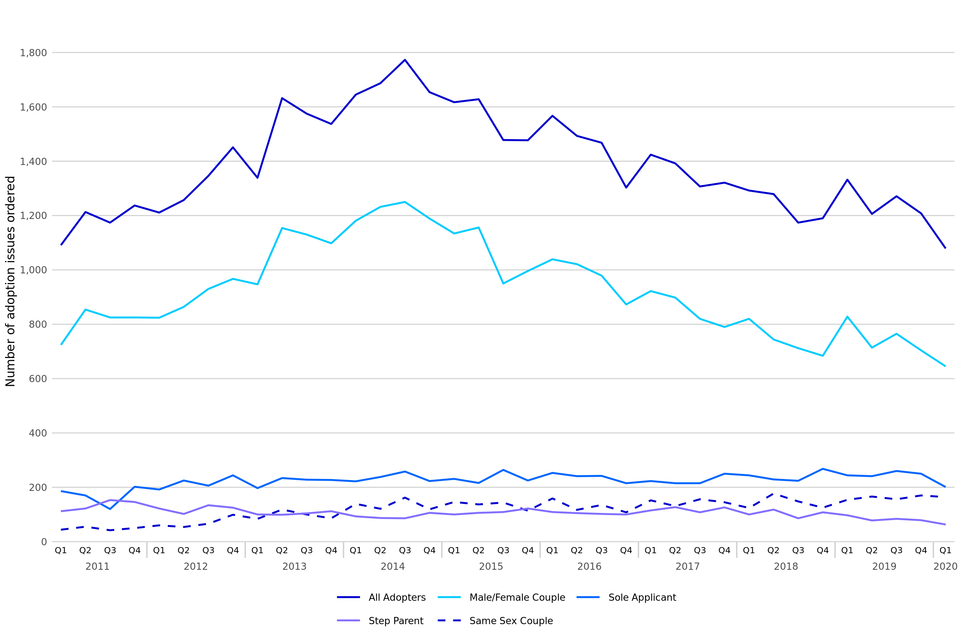
Chart showing adoption orders issued, by adopter, January to March 2011 to January to March 2020 (Source: Table 20)
12. Mental Capacity Act - Court of Protection
Decrease in applications with an increase in orders made in relation to deprivation of liberty
There were 805 applications relating to deprivation of liberty (DoL) made in the most recent quarter down by 39% on the number made in the same quarter in 2019. Furthermore, there was an increase by 41% in the orders made for deprivation of liberty over the same period, from 746 to 1,054.
A decrease in applications whilst orders increase under the Mental Capacity Act 2005 (MCA)
There were 8,267 applications made in January to March 2020 down by 6%. During the same period there were 13,829 orders made, up by 17% - the highest quarterly volumes seen since the start of the series.
Figure 9: Deprivation of Liberty applications, January to March 2008 to January to March 2020 (Source: Table 21)
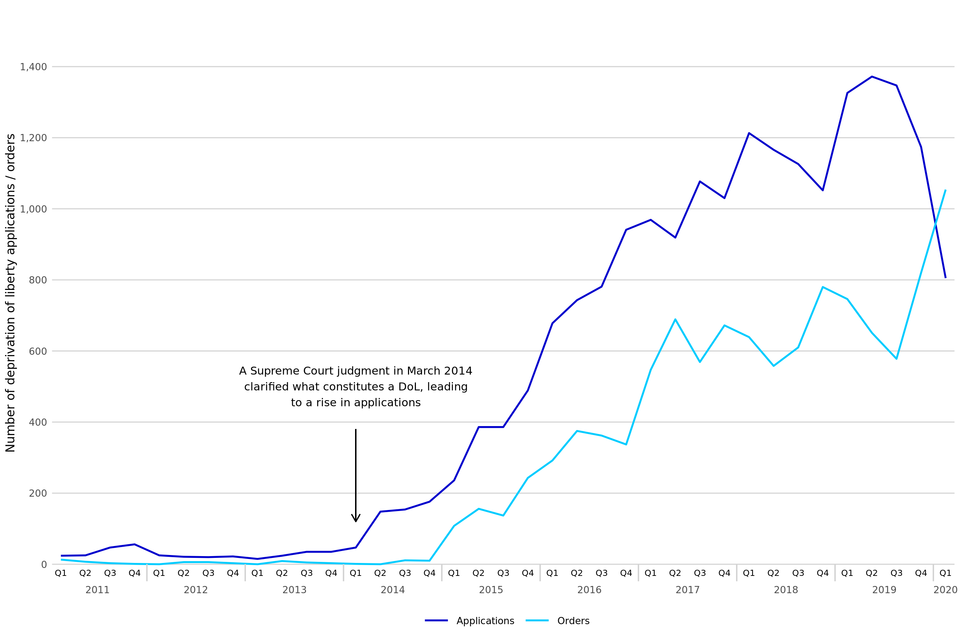
Chart showing deprivation of Liberty applications, January to March 2011 to January to March 2020 (Source: Table 21)
For the first time in this time series, the number of DoL orders made was higher than the number of applications made. Whilst several orders can stem from the same application, it is worth noting that the Court of Protection deployed more resource to the deprivation of liberty orders during 2019-20.
In January to March 2020, there were 8,267 applications made under the Mental Capacity Act 2005 (MCA), down by 6% on the equivalent quarter in 2019 (8,770 applications). Of those, 47% related to applications for appointment of a property and affairs deputy (Table 21).
In comparison, there were 13,829 orders made under the Mental Capacity Act 2005 (MCA), up by 17% on the same quarter in 2019. Of those, 36% related to orders by an existing deputy or registered attorney (Table 22).
13. Mental Capacity Act - Office of the Public Guardian
Continuing increasing trend in Lasting Powers of Attorney (LPAs)
In January to March 2020, there were 237,408 LPAs received, up 5% compared to the equivalent quarter in 2019 (Table 23).
In total there were 239,647 Powers of Attorney (POAs) received in January to March 2020 up 5% from the same quarter in 2019 (Table 23). Lasting Power of Attorney (LPAs) made up 99% of POAs received in January to March 2020, with Enduring Powers of Attorney (EPAs) making up the other 1%. The sharp increase in LPAs seen during 2015 and 2016 was largely due to increased publicity and the new online forms introduced in July 2015 making it simpler and faster to apply.
There were 2,239 EPAs in January to March 2020, down 20% on the equivalent quarter in 2019.
Figure 10: Powers of attorney received, January to March 2008 to January to March 2020 (Source: Table 23)
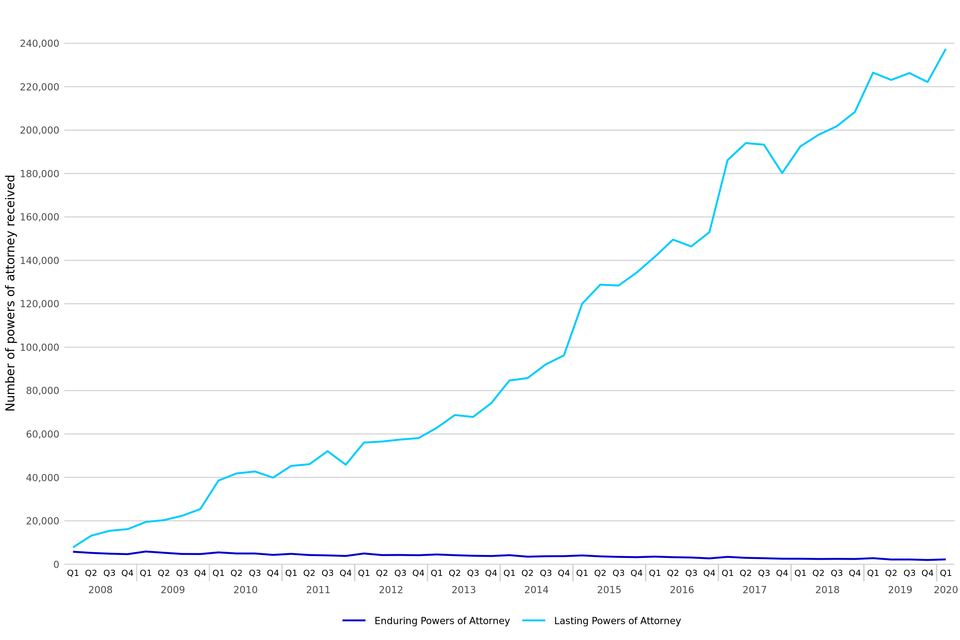
Chart showing Powers of attorney received, January to March 2008 to January to March 2020 (Source: Table 23)
14. Probate Service
Around a fifth of applications for probate grants and probate grants issued were made digitally
In January to March 2020, there were 54,174 applications for probate grants. 49,712 probate grants were issued in the same period. 22% of these applications and grants issued were made digitally (Tables 24 and 25).
Probate grants take less time to be issued than other grants of representation
Probate grants took nearly 7 weeks to be issued after the application was submitted during January to March 2020. Letters of administration with a will and without a will were around 11 and 8 weeks respectively (Table 26).
There were 66,826 applications made for grants of representation in January to March 2020. 54,174 (81%) of these were for probate grants, of which 22% were made digitally (Table 24).
Probate grants also make up the majority (81%) of all grants issued. In January to March 2020, 60% of the grants issued were applied for by solicitors and 40% were personal applications (Table 24). For 49,712 probate grants issued in the same period, 22% were issued digitally.
The average time from application submission to grant issue for probate grants was 7 weeks (median average 4 weeks) overall. Averages for letters of administration with a will and without a will were 11 and 8 weeks respectively for January to March 2020 (Table 26).
When looking at the time from document receipt (i.e. when all accompanying documents and payment have been confirmed with the application) to grant issue, this is around 1 day quicker overall for probate grants.
Figure 11: Grants of representation issued by the Probate Service, 2007 to 2019 (Source: Table 25)[footnote 6]
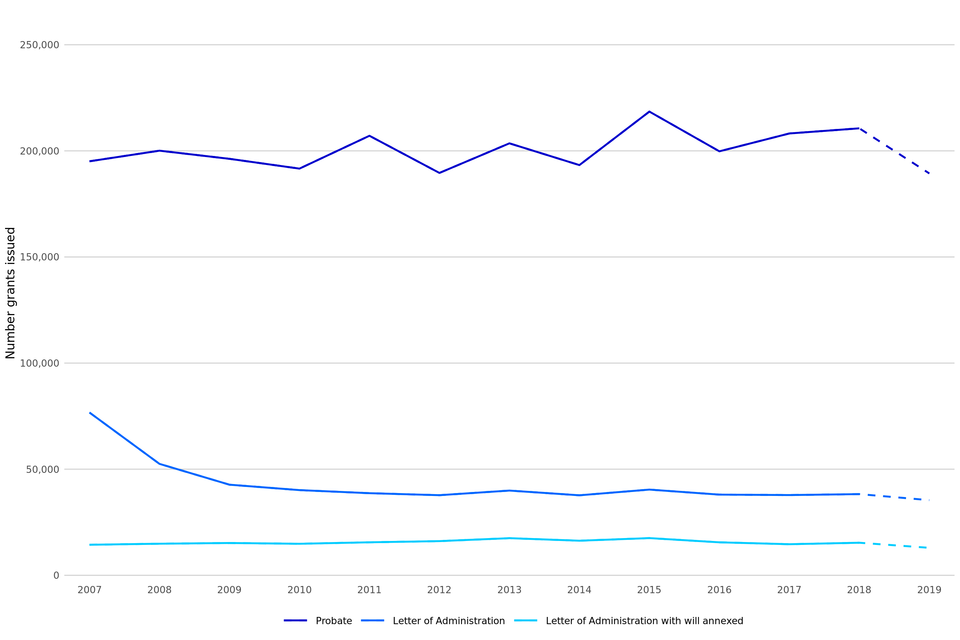
Grants of representation issued by the Probate Service, 2007 to 2019 (Source: Table 25)
Further information
The data presented in this publication are from live administrative databases. Therefore, previously published data is liable to be updated in the latest bulletin, following any further data cleaning or the incorporation of additional cases not available in the extracts used to produce previous bulletins.
Accompanying files
As well as this bulletin, the following products are published as part of this release:
-
A technical guide providing further information on how the data is collected and processed, as well as information on the revisions policy and legislation relevant to family court and background on the functioning of the family justice system
-
A set of overview tables and CSV files, covering each section of this bulletin
-
A family court statistics visualisation tool available at https://public.tableau.com/profile/moj.analysis#!/vizhome/FamilyCourtstatisticstool2020Q1/Frontpage.
National Statistics status
National Statistics status means that official statistics meet the highest standards of trustworthiness, quality and public value.
All official statistics should comply with all aspects of the Code of Practice for Official Statistics. They are awarded National Statistics status following an assessment by the Authority’s regulatory arm. The Authority considers whether the statistics meet the highest standards of Code compliance, including the value they add to public decisions and debate.
It is the Ministry of Justice’s responsibility to maintain compliance with the standards expected for National Statistics. If we become concerned about whether these statistics are still meeting the appropriate standards, we will discuss any concerns with the Authority promptly. National Statistics status can be removed at any point when the highest standards are not maintained, and reinstated when standards are restored.
Contact
Press enquiries should be directed to the Ministry of Justice press office:
Tel: 0203 334 3536
Email: newsdesk@justice.gsi.gov.uk
Other enquiries about these statistics should be directed to the Justice Statistics Analytical Services division of the Ministry of Justice:
Carly Gray, Head of Civil, Administrative and Family Justice Statistics
Ministry of Justice, 3rd Floor, 10 South Colonnade, Canary Wharf, London, E14 4PU
Email: ESD@justice.gov.uk
Next update: 24 September 2020
URL: https://www.gov.uk/government/collections/family-court-statistics-quarterly
© Crown copyright
Produced by the Ministry of Justice
Alternative formats are available on request from ESD@justice.gov.uk
-
See the accompanying technical guide for more information. ↩
-
The Children and Family Court Advisory and Support Service (Cafcass) also publishes (England only) data on the number of private law cases. A comparison of Cafcass and MoJ data and further information can be found in the accompanying guide. ↩
-
Please see the accompanying guide for further details. ↩
-
Removal of Legal Aid was a result of the Legal Aid, Sentencing & Punishment of Offenders Act 2012 (LASPO). ↩
-
Due to quality issues in the transition between data systems, the breakdown by type of grants of representation for Q2 2019 were rounded estimates only, with the average distribution across 2016 to 2018 applied to the known total. These estimates then feed into the total for 2019. ↩