Family Court Statistics Quarterly: April to June 2022
Updated 12 October 2022

© Crown copyright 2022
This publication is licensed under the terms of the Open Government Licence v3.0 except where otherwise stated. To view this licence, visit nationalarchives.gov.uk/doc/open-government-licence/version/3 or write to the Information Policy Team, The National Archives, Kew, London TW9 4DU, or email: psi@nationalarchives.gov.uk.
Where we have identified any third party copyright information you will need to obtain permission from the copyright holders concerned.
This publication is available at https://www.gov.uk/government/statistics/family-court-statistics-quarterly-april-to-june-2022/family-court-statistics-quarterly-april-to-june-2022
1. Main Points
| Increase in the number of cases started in the Family Courts | 69,340 new cases started in Family courts in April to June 2022, up 2% on the same quarter in 2021. This was due to increases in matrimonial (22%) and domestic violence (5%) cases. However, there was a decrease in financial remedy (31%), private law (7%) and adoption (5%) case starts. |
| There were 33,234 divorce applications under the new legislation from 6th April | New divorce legislation came into effect from 6th April. Between April to June 2022 there were 33,234 applications (78% from sole applicants, 22% from joint applicants), including those for dissolution of civil partnerships |
| Increase in the average time for divorce proceedings under the old law | Under the old divorce law, the mean average time from petition to decree nisi was 36 weeks, and decree absolute was 56 weeks - up 12 weeks and 7 weeks respectively when compared to the equivalent quarter in 2021. The median time to decree nisi and decree absolute was 18 and 32 weeks respectively. |
| Increase in domestic violence remedy applications, with a decrease in the orders made. | The number of domestic violence remedy order applications increased by 6% compared to the equivalent quarter in 2021, while the number of orders made decreased by 3% over the same period. |
| Decrease in the number of both adoption applications and orders. | In April to June 2022 there were 980 adoption applications, down 8% on the equivalent quarter in 2021. Similarly, the number of adoption orders issued decreased by 15% to 986. |
| Decrease in deprivation of liberty applications and orders made. | There were 1,457 applications relating to deprivation of liberty in April to June 2022, down 5% on the equivalent quarter in 2021. Orders decreased by 38% in the latest quarter compared to the same period last year. |
| Increase in the proportion of applications for probate grants and probate grants issued made digitally | In April to June 2022, there were 58,875 applications for probate grants. 58,239 probate grants were issued in the same period. 87% of these applications and 88% of these grants issued were made digitally, compared to 76% and 78% respectively in the same quarter in 2021. |
This publication presents statistics on activity in the family courts of England and Wales and provides figures for the latest quarter (April to June 2022). For further information and technical details please refer to the accompanying Guide to Family Court Statistics.
For feedback related to the content of this publication, please let us know at familycourt.statistics@justice.gov.uk
1.1 Data Quality Issues
The rollout of reform in family courts has introduced a new data management system, Core Case Data (CCD), to collect family data. As each service area undergoes reform, existing cases stay on the legacy system FamilyMan (FM) until they are disposed or closed, while new cases are recorded on CCD with some key details copied back to FM.
Currently, family public law (FPL) is undergoing this reform process. However, not all details are copied across for FPL (such as substantive orders other than final). Until work is completed to amalgamate both FM and CCD, several published data series cannot be maintained. These are:
-
The total number of public law disposals (Table 2)
-
The number of orders granted and children involved in orders granted by order type (Table 4)
-
Care and supervision proceedings timeliness (Table 8)
-
Overall public law timeliness (Table 10)
-
Legal representation (Table 11)
These series have been removed from Q1 (Jan-Mar) 2022 and will be reinstated once both data sources have been combined. We will update users with timescales for this project in future releases.
2. Statistician’s comment
Volumes of new cases starting during April to June 2022 increased slightly since the same time period last year, with increases in matrimonial and domestic violence remedy cases and decreases in private law and adoption cases. Closed cases have decreased in most areas, although there was a record high for closing domestic violence remedy cases, following the record levels of applications seen earlier in the pandemic.
Data on the new divorce legislation introduced in April 2022 is published for the first time, incorporating new terminology and new mandatory waiting periods at key stages. There were 33,200 applications in April to June (including for dissolution of civil partnerships), with the majority coming from sole applicants. This is the highest number of applications in a decade; in contrast the number of disposals was the lowest it has been in the eleven years of our series.
There continues to be increases seen in timeliness measures – the average time taken for a private law case to get a final order granted is up almost 6 weeks from the same period last year, creating a new record high. Looking at divorce, time to decree nisi (i.e. those under the old divorce legislation) has increased by more than 11 weeks over the last year.
As the migration to online public law services continues to be rolled out, there have been key data issues as a result. The main data source remains to be the existing FamilyMan system, with limited aggregate data available from the new Core Case Data (CCD) system for the new digital process. As a result, a number of data series regarding public law will not be updated until both FamilyMan and CCD are amalgamated (particularly impacting related timeliness metrics).
3. Overview of the Family Justice System
Increase in the number of cases started in Family Courts and decrease in the number of cases disposed
In April to June 2022, 69,340 new cases started in family courts, up 2% on the equivalent quarter in 2021. This was due to increases in matrimonial (22%) and domestic violence (5%) cases. However, there was a decrease in financial remedy (31%), private law (7%) and adoption (5%) case starts.
There were 49,923 case disposals in April to June 2022, down 23% on the equivalent quarter of 2021. This was due to decreases in most case types: matrimonial (35%), financial remedy (22%), adoption (19%), public law (15%) and private law (12%) cases. However, there was an increase in domestic violence (15%) case disposals. (Table 1)
Figure 1: Cases started and disposed, by case type, January to March 2011 to April to June 2022 (Source: Table 1)
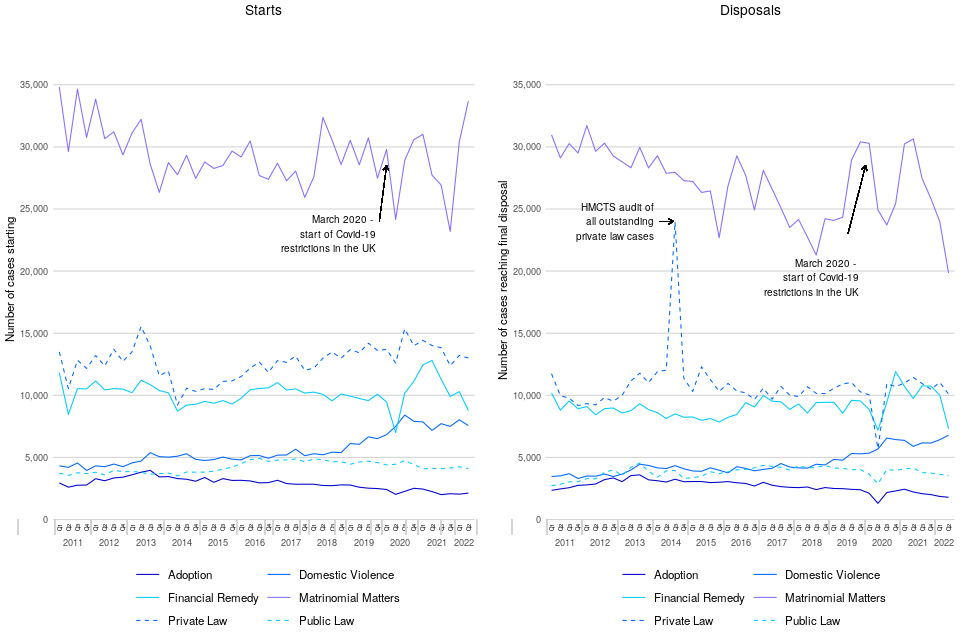
In April to June 2022, 49% of new cases within family courts related to matrimonial matters, up from the equivalent quarter of 2021 (41%).
Timeliness by Case Type
Average time to first disposal varies by case type. The average time for divorce and annulment cases to reach first disposal was up 11 weeks compared to the equivalent quarter in 2021. This is the highest time for divorce cases to reach first disposal in the time series. Private law cases also took longer, with the average time to first disposal in April to June 2022 taking 30 weeks, up 4 weeks compared to the same period in 2021.
Public and private law cases – number of parties, and High Court cases
The vast majority of private law cases involve one applicant and one respondent only (Table 6). However, for public law cases whilst nearly all cases have only one applicant, 72% involve two or more respondents.
A very small proportion of public (2%) and private (1%) law cases started were indicated as being a High Court case during April to June 2022, consistent with the long-term trend (Table 7).
HMCTS monthly management information
The statistics in this publication focus on the period between April to June 2022; however, monthly management information (MI) has been published by HMCTS that covers up to July 2022. https://www.gov.uk/government/statistical-data-sets/hmcts-management-information-july-2022. This MI is subject to the data quality issues associated with extracting data from large live administrative case management systems. Late reporting of cases and regular updating of case details, which can lead to the figures being updated to manage the case - more recent figures may therefore be subject to larger revisions and should be treated with greater care and considered provisional.
4. Children Act - Public Law
No change in the number of case starts with a decrease in the number of public law cases disposed
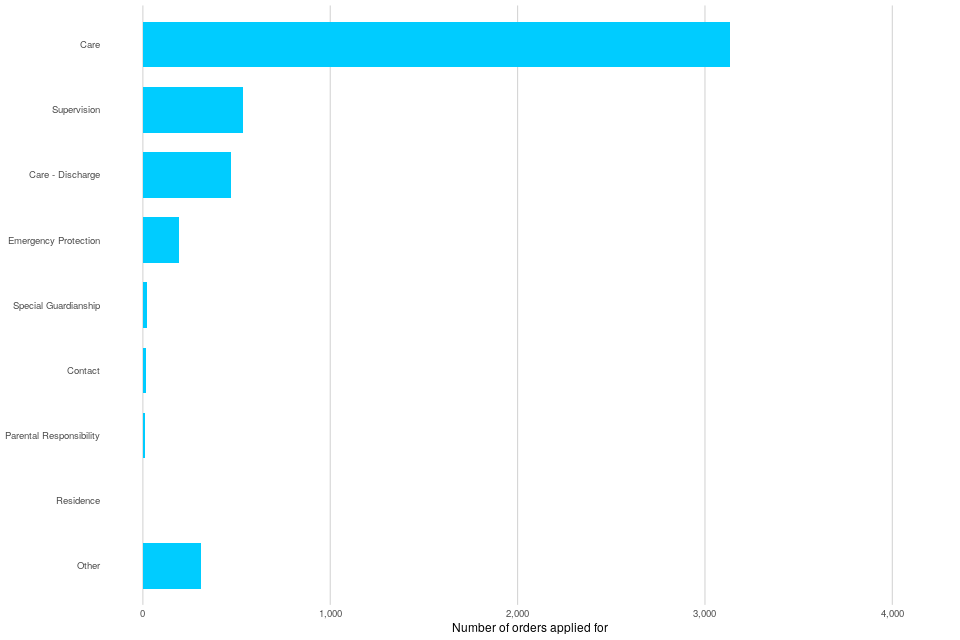
There were 4,099 public law cases starting in April to June 2022, similar to the equivalent quarter in 2021. Cases disposed were down 15% to 3,531 (Table 2).
There were 6,750 individual children involved in new public law applications in April to June 2022, down 3% on the same quarter in the previous year, while the number of applications made decreased by 4%.
Figure 2: Public law applications, by order type, April to June 2022 (Source: Tables 3-4)
5. Children Act - Private Law
Decrease in the number of private law case starts and cases disposed
The number of private law cases[footnote 1] started decreased by 7% (to 13,002) in April to June 2022 compared to the equivalent quarter in 2021. The number of applications made decreased by 7% over the same period.
The number of private law cases disposed of during April to June 2022 was down 12% on the equivalent quarter in 2021, with the number of disposals down by 16% (Table 2).
There were 13,537 new private law applications made in April to June 2022, down 7% on the equivalent quarter in 2021, with 20,183 individual children involved in these applications.
The number of private law disposals in April to June 2022 was 26,924, down 16% on the equivalent quarter in 2021.
Timeliness of Private law cases
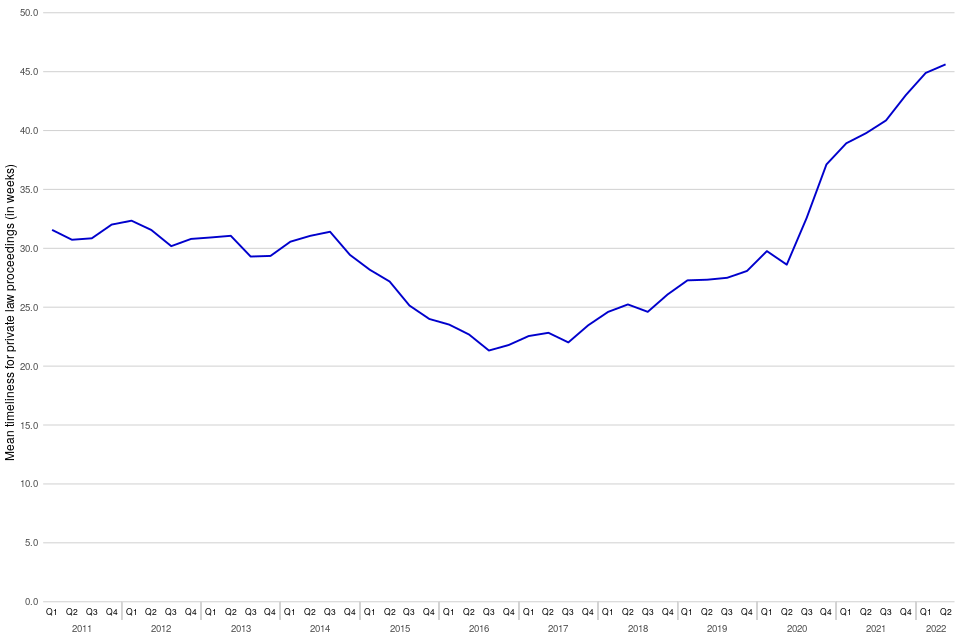
In April to June 2022, it took on average 46 weeks for private law cases to reach a final order, i.e. case closure, up 6 weeks from the same period in 2021 and the highest value in the series we publish. This continues the upward trend seen since the middle of 2016, where the number of new cases overtook the number of disposals (Table 9).
Figure 3: Private law timeliness from case start date to final order in the family court, January to March 2011 to April to June 2022 (Source: Table 9)
6. Legal Representation
Cases with legal representation take longer on average
In general, cases where either both parties or the respondent only had legal representation took longer to be disposed of than those cases where only the applicant was represented or where both parties were without legal representation (Table 10).
Legal representation in private law cases
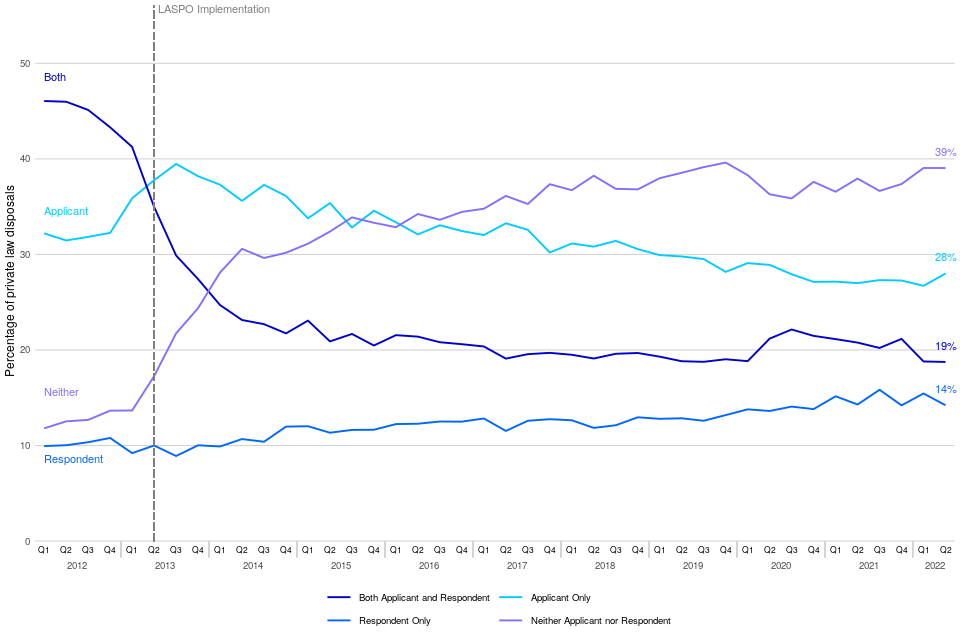
The removal of legal aid for many private law cases in April 2013 resulted in a change in the pattern of legal representation over time[footnote 2],[footnote 3]. In April to June 2022, the proportion of disposals where neither the applicant nor respondent had legal representation was 39%, increasing by 25 percentage points since January to March 2013, and up 1 percentage point from April to June 2021.
Correspondingly, the proportion of cases where both parties had legal representation went from 41% in January to March 2013 to 19% in April to June 2022, down 2 percentage points compared to the same period in 2021 (Figure 4).
Figure 4: Proportion of private law disposals by type of legal representation of the parties, January to March 2012 to April to June 2022 (Source: Table 10)
The change seen in the pattern of legal representation is also demonstrated in private law cases with at least one hearing where the proportion of parties with legal representation stood at 59% in 2012 compared to 28% in April to June 2022.
The proportion of parties with legal representation in cases with at least one hearing varies by case type and range from around 74% for financial remedy cases to 2% for adoption cases, with figures subject to change as new cases progress (Table 11).
7. Divorce
There were 33,234 divorce applications (including civil partnerships) under the new legislation from 6th April 2022
New divorce legislation came into effect from 6th April 2022, which aims to reduce the potential for conflict amongst divorcing couples by:
- removing the ability to make allegations about the conduct of a spouse
- allowing couples to end their marriage jointly.
Between April and June 2022 there were 33,234 applications made under the new law (78% from sole applicants, 22% from joint applicants) (Table 12b). There were 33,566 applications altogether made under both old and new laws. This was an increase of 22% from the same quarter in 2021 and represents the highest number of applications in a decade.
Please note that the new divorce legislation introduced new terminology and new mandatory waiting periods at key stages. For further information, please see the guide that accompanies this publication.
Under the old divorce law, there were 19,758 decree absolutes granted in April to June 2022, down 35% compared to the same quarter in 2021 (Table 12)
Increase in the average time for divorce proceedings under the old law
Under the old divorce law, the mean average time from the date of petition to decree nisi was 36 weeks, up 12 weeks from the same period in 2021. The mean average time from petition to decree absolute was 56 weeks, up 7 weeks from the equivalent quarter in 2021. These increases have been impacted by resourcing issues which have led to backlogs.
The mean timeliness figures can be inflated when historical cases reach decree nisi or decree absolute. These historical cases have less effect on the median timeliness, which may act as a better indicator for the length of current divorce proceedings. In April to June 2022, the median time to decree nisi was 18 weeks and 32 weeks to decree absolute.
Due to the mandatory waiting periods for the new divorce legislation, we will not be commenting on timeliness for ‘new divorce’ cases until there are substantial numbers of conditional/final orders made.
Digital divorce cases
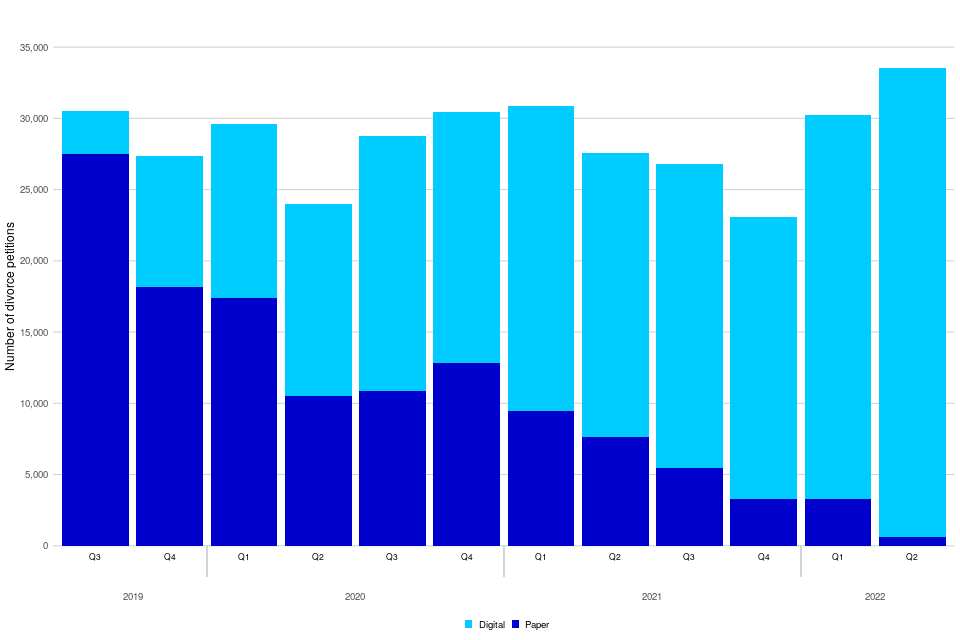
For digital divorce cases (i.e. those dealt with by the Courts and Tribunals Service Centres and are digital at all stages), there were 32,972 petitions made during April to June 2022. This was 98% of the total, up from 72% in the same period of 2021, 99% of applications under the new law were made digitally this quarter, while 89% of applications under the old law were made digitally last quarter. The average time to decree nisi for April to June 2022 was 18 weeks, and 29 weeks from petition to decree absolute.
Figure 5: Divorce petitions made between Q3 2019 to Q2 2022, by case type (Source: Table 12)
8. Financial Remedy
Decrease seen in financial remedy applications and disposals events
In April to June 2022, the number of financial remedy applications was down 31% and the number of disposal events was down 26% compared to the same period in 2021 (Table 15).
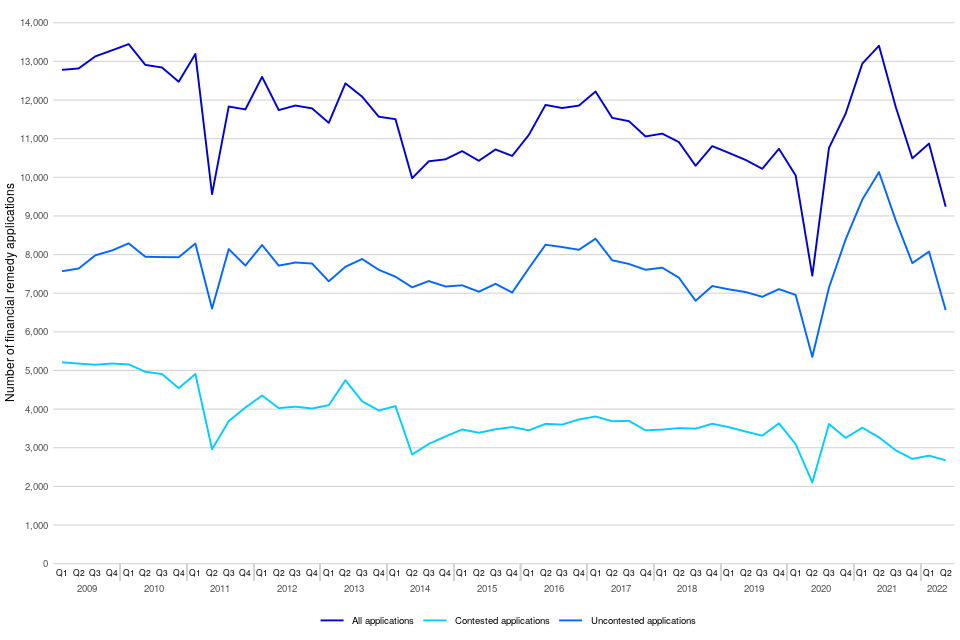
There were 9,235 financial remedy applications made in April to June 2022, down 31% from the same period in 2021, while there were 8,253 financial remedy disposals events, down 26%. During this period, 71% of applications were uncontested and 29% were contested.
Figure 6: Applications for financial remedy orders, January to March 2009 to April to June 2022 (Source: Table 15)
9. Domestic Violence Remedy Orders
Increase in the number of domestic violence remedy applications and decrease in the number of orders made
In April to June 2022, there was a 6% increase in applications made compared to the equivalent quarter in 2021. The number of orders made decreased by 3% over the same period (Table 16).
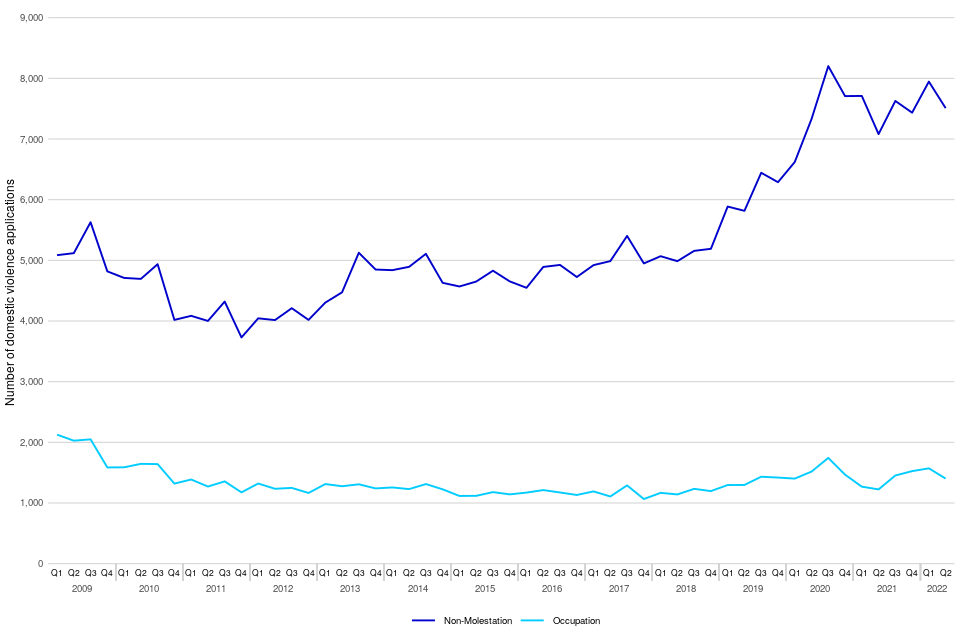
In April to June 2022, there were 7,791 domestic violence remedy applications, up by 6% on the same quarter in 2021 requesting a total of 8,911 orders (multiple orders can be applied for in a single application). Most of the orders applied for were non-molestation orders (84%) compared to occupation orders (16%); these proportions have remained relatively consistent in recent years. Applications for non-molestation and occupation orders in April to June 2022 were both up, by 6% and 15% respectively, compared to the same period in 2021.
There were 9,232 domestic violence orders made in April to June 2022, down 3% from the same period last year. 95% were non-molestation orders and 5% were occupation orders, with non-molestation orders down by 2% and occupation orders down by 11% compared to the equivalent quarter in 2021.
Figure 7: Applications for domestic violence remedy orders, January to March 2009 to April to June 2022 (Source: Table 16)
10. Forced Marriage Protection Orders and Female Genital Mutilation Protection Orders
Long term upward trend in the number of forced marriage protection orders and female genital mutilation protection orders (Table 17 and 18).
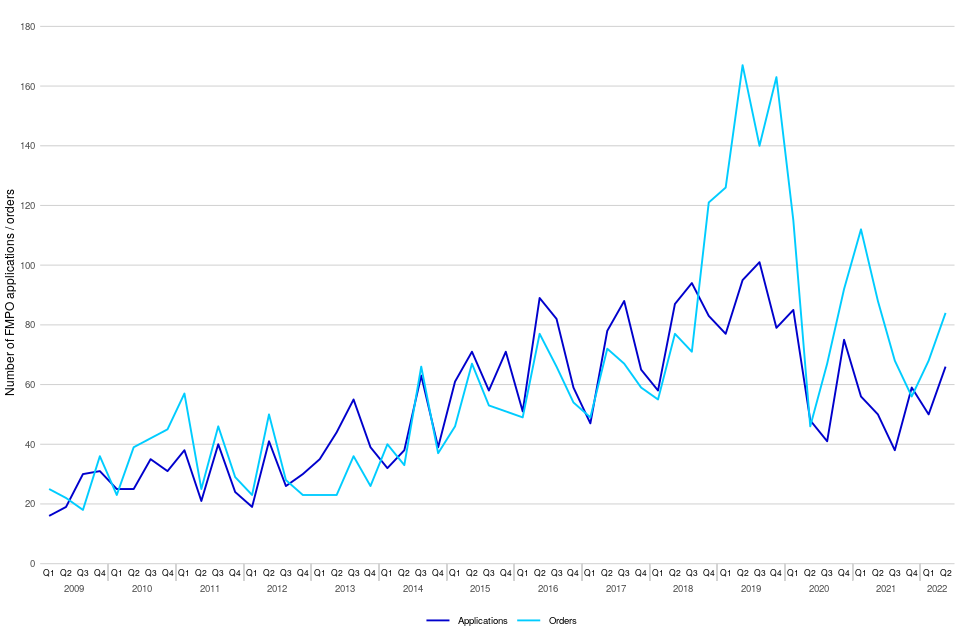
The number of applications and orders made for forced marriage protection orders (FMPOs) is very small. Consequently, numbers fluctuate each quarter but overall there was a long term upward trend from their introduction in November 2008 until the end of 2019.
This trend was impacted with sharp decreases seen during 2020 but has increased since. In April to June 2022, there were 66 applications, of which 70% of applications were for people aged 17 and under. Over the same period, there were 84 orders made, down 5% since the same period from the previous year.
Historically the numbers of orders made outweigh the number of applications. Often there are multiple orders granted per case, where one application covers more than one person, and an order is granted for each person covered in the application. Extensions and increased provision of previous orders can also be granted as new orders, without the need for a new application to be submitted.
Figure 8: Applications and orders made for Forced Marriage Protection Orders, January to March 2009 to April to June 2022 (Source: Table 17)
As with FMPOs, the number of applications and orders made for female genital mutilation protection orders (FGMPOs) is very small, with only 10 applications and 13 orders made respectively in April to June 2022 (Table 18). In total, there have been 539 applications and 764 orders made up to end of June 2022, since their introduction in July 2015.
11. Adoptions
Decrease in the number of adoption applications and orders
During April to June 2022, there were 980 adoption applications made, down 8% from the equivalent quarter in 2021. Over the same period, the number of adoption orders issued also decreased by 15% to 986 (Tables 19 and 20).
There were 2,142 applications under the Adoption and Children Act 2002, including placement orders during April to June 2022, down 5% on the same quarter in the previous year. Total disposals decreased by 19% to 1,816 over the same period.
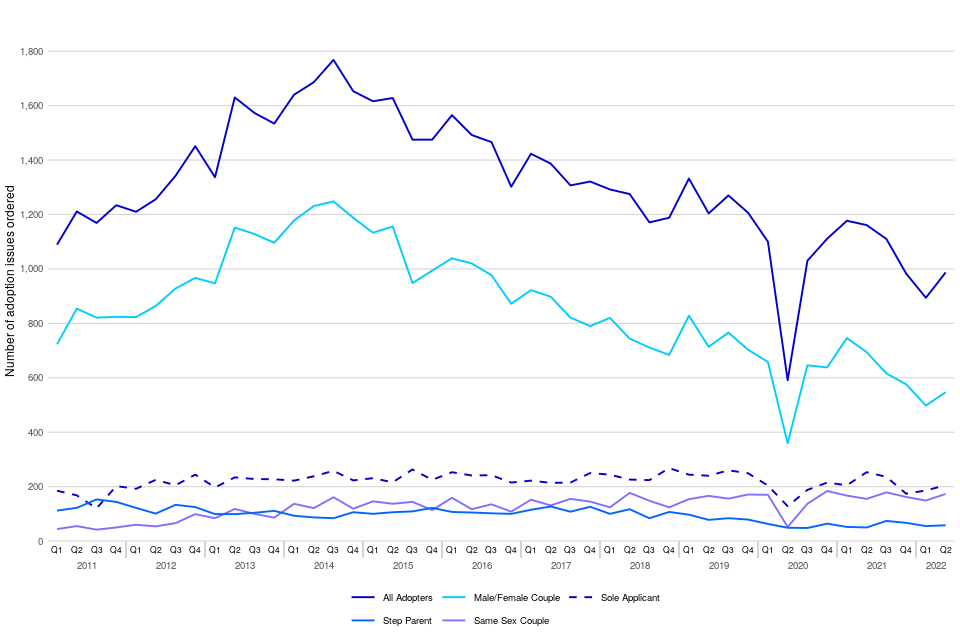
The chart below shows the trend of adoption orders by the type of adopter. This shows that during April to June 2022, 55% of all adoption orders were issued to mixed-sex couples, 21% to sole applicants, 18% to same-sex couples and 6% to step-parents.
Figure 9: Adoption orders issued, by adopter, January to March 2011 to April to June 2022 (Source: Table 20)
12. Mental Capacity Act - Court of Protection
Decrease in both applications and orders made in relation to deprivation of liberty
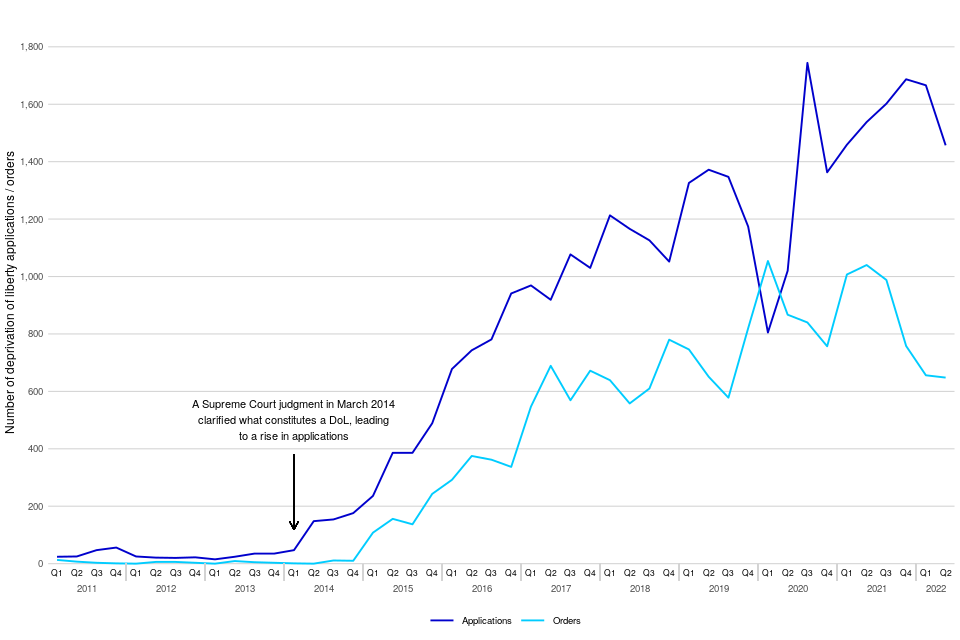
There were 1,457 applications relating to deprivation of liberty made in the most recent quarter, which is a decrease of 5% on the number made in the same quarter in 2021. Furthermore, there was a decrease by 38% in the orders made for deprivation of liberty over the same period from 1,040 to 648.
A decrease in both applications and orders under the Mental Capacity Act 2005 (MCA)
There were 8,498 applications made in April to June 2022, down by 1%. During the same period there were 11,267 orders made, down by 1%.
Figure 10: Deprivation of Liberty applications and orders, January to March 2008 to April to June 2022 (Source: Table 22)
In April to June 2022, there were 8,498 applications made under the Mental Capacity Act 2005 (MCA), down by 1% on the equivalent quarter in 2021 (8,623 applications). Of those, 41% related to applications for appointment of a property and affairs deputy (Table 21).
In comparison, there were 11,267 orders made under the Mental Capacity Act 2005 (MCA), down by 1% on the same quarter in 2021. Of those, 39% related to orders by an existing deputy or registered attorney (Table 22).
13. Mental Capacity Act - Office of the Public Guardian
Continuing increasing trend in Lasting Powers of Attorney (LPAs)
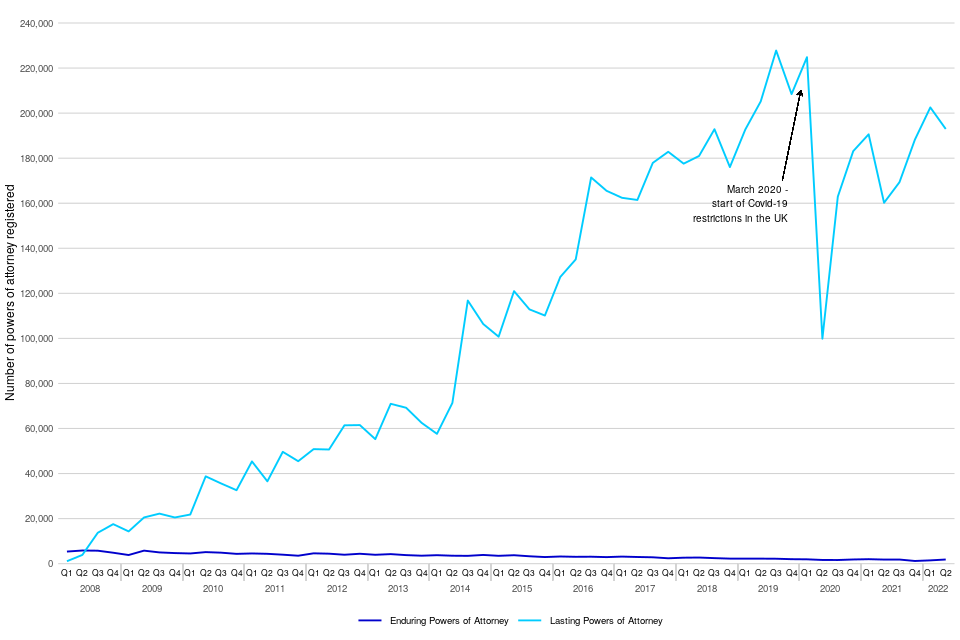
In April to June 2022, there were 192,958 LPAs registered, up 20% compared to the equivalent quarter in 2021 (Table 23).
In total there were 194,796 Powers of Attorney (POAs) registered in April to June 2022, up 20% from the same quarter in 2021 (Table 23). Lasting Power of Attorney (LPAs) made up 99% of POAs registered in April to June 2022, with Enduring Powers of Attorney (EPAs) making up the other 1%. There were 1,838 EPAs registered in April to June 2022, up 2% on the equivalent quarter in 2021.
The sharp increase in LPAs seen during 2015 and 2016 was largely due to increased publicity and the new online forms introduced in July 2015 making it simpler and faster to apply.
Figure 11: Powers of Attorney registered, January to March 2008 to April to June 2022 (Source: Table 23)
56% of POAs registered were from female donors in April to June 2022 and 42% were from male donors. Altogether, 51% were over 75 years old.
14. Probate Service
Increase in both the proportion of digital applications for probate grants and probate grants issued digitally
In April to June 2022, there were 58,875 applications for probate grants. 58,239 probate grants were issued in the same period. 87% of these applications and 88% of these grants issued were made digitally, compared to 76% and 78% respectively in the same quarter in 2021 (Table 24).
Probate grants issued more quickly than other grants of representation
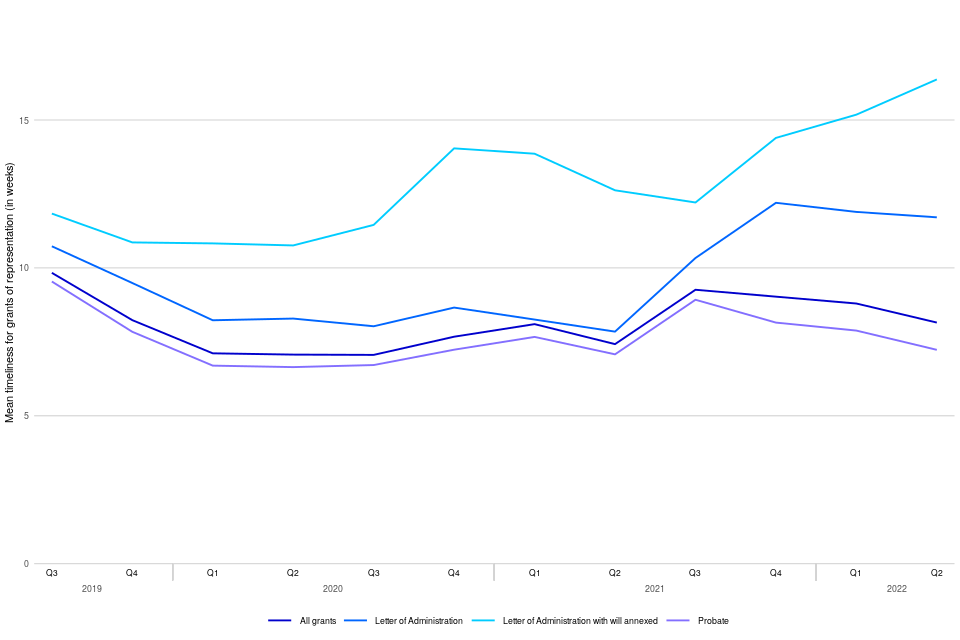
Probate grants took approximately 7 weeks to be issued after the application was submitted during April to June 2022. Letters of administration with a will and without a will took around 16 and 12 weeks respectively (Table 25).
There were 70,767 applications made for grants of representation in April to June 2022. 58,875 (83%) of these were for probate grants, of which 87% were made digitally (Table 24).
Probate grants also make up the majority (83%) of all grants issued. In April to June 2022, 61% of the grants issued were applied for by legal professionals and 39% were personal applications (Table 24). For the 58,239 probate grants issued in the same period, 88% were issued digitally.
Timeliness of probate grants
The average time from application submission to grant issue for probate grants was 7 weeks (median average 5 weeks) overall. Averages for letters of administration with a will and without a will were 16 and 12 weeks respectively for April to June 2022 (Table 25).
Timeliness of grants issued can be affected if the case has been ‘stopped’ for any reason (which can occur when there’s a dispute about either who can apply for probate or issues with a will or proposed will, or if an error is identified and a request for further information made). Probate grants that were stopped during April to June 2022 took 14 weeks on average to be issued, compared to 5 weeks for those that were not stopped.
When looking at the time from document receipt (i.e. when payment has been made and the application and all accompanying documents are ready for examination) to grant issue, this is around 2 weeks quicker than the average time from application submission for probate grants.
Figure 12: Average (mean) time for grants of representation issued from application submission by the Probate Service, July to September 2019 to April to June 2022 (Source: Table 26)[footnote 4]
15. Further information
The data presented in this publication are from live administrative databases. Therefore, previously published data is liable to be updated in the latest bulletin, following any further data cleaning or the incorporation of additional cases not available in the extracts used to produce previous bulletins.
Accompanying files
As well as this bulletin, the following products are published as part of this release:
-
A technical guide providing further information on how the data is collected and processed, as well as information on the revisions policy and legislation relevant to family court and background on the functioning of the family justice system
-
A set of overview tables and CSV files, covering each section of this bulletin
National Statistics status
National Statistics status means that official statistics meet the highest standards of trustworthiness, quality and public value.
All official statistics should comply with all aspects of the Code of Practice for Official Statistics. They are awarded National Statistics status following an assessment by the Authority’s regulatory arm. The Authority considers whether the statistics meet the highest standards of Code compliance, including the value they add to public decisions and debate.
It is the Ministry of Justice’s responsibility to maintain compliance with the standards expected for National Statistics. If we become concerned about whether these statistics are still meeting the appropriate standards, we will discuss any concerns with the Authority promptly. National Statistics status can be removed at any point when the highest standards are not maintained, and reinstated when standards are restored.
Contact
Press enquiries should be directed to the Ministry of Justice press office:
Tel: 0203 334 3536
Email: newsdesk@justice.gsi.gov.uk
Other enquiries about these statistics should be directed to the Data and Evidence as a Service division of the Ministry of Justice:
Carly Gray, Head of Access to Justice Data and Statistics, using the following email address familycourt.statistics@justice.gov.uk
Next update: 15 December 2022
URL: https://www.gov.uk/government/collections/family-court-statistics-quarterly
© Crown copyright
Produced by the Ministry of Justice
Alternative formats are available on request from ESD@justice.gov.uk
-
The Children and Family Court Advisory and Support Service (Cafcass) also publishes (England only) data on the number of private law cases. A comparison of Cafcass and MoJ data and further information can be found in the accompanying guide. ↩
-
Please see the accompanying guide for further details. ↩
-
Removal of Legal Aid was a result of the Legal Aid, Sentencing & Punishment of Offenders Act 2012 (LASPO). ↩
-
Due to quality issues in the transition between data systems, the breakdown by type of grants of representation for Q2 2019 were rounded estimates only, with the average distribution across 2016 to 2018 applied to the known total. These estimates then feed into the total for 2019. ↩