Economic labour market status of individuals aged 50 and over, trends over time: September 2021
Published 9 September 2021

© Crown copyright 2021
This publication is licensed under the terms of the Open Government Licence v3.0 except where otherwise stated. To view this licence, visit nationalarchives.gov.uk/doc/open-government-licence/version/3 or write to the Information Policy Team, The National Archives, Kew, London TW9 4DU, or email: psi@nationalarchives.gov.uk.
Where we have identified any third party copyright information you will need to obtain permission from the copyright holders concerned.
This publication is available at https://www.gov.uk/government/statistics/economic-labour-market-status-of-individuals-aged-50-and-over-trends-over-time-september-2021/economic-labour-market-status-of-individuals-aged-50-and-over-trends-over-time-september-2021
The latest release of these statistics can be found in the collection of economic labour market status of individuals aged 50 and over statistics.
This publication details the trends over time in the economic labour market status of individuals aged 50 and over. We have refreshed the name for the Fuller Working Lives (FWL) agenda to 50 PLUS: Choices. This signals the government’s recognition of the different situations, transitions and challenges currently faced by those aged 50 and over in the labour market.
Analysis is provided on the 3 headline measures announced in the Fuller Working Lives (FWL) Strategy 2017 that the government use to monitor progress on FWL:
-
Employment rate of people aged 50 years and over, by five-year age bands and gender
-
Average age of exit from the labour market, by gender
-
Employment rate gap between people aged 50 to 64 and people aged 35 to 49 years, broken down by five-year age band and gender
This is an annual release and the next release will be in September 2022.
1. Introduction
The UK has an ageing population and workforce, therefore it is of growing importance to understand the economic labour market status of individuals approaching, at, and above State Pension age (SPa) and how trends are changing over time.
The coronavirus (COVID-19) pandemic has impacted the UK labour market, and the statistics in this release should be interpreted in the context of COVID-19. Please see the What you need to know section for more details.
2. Main stories
The main stories are:
-
people aged 50 years and over have, like other age groups, been impacted in the labour market by the COVID-19 pandemic since March 2020, including the 12 months covered by this report. It is too early to determine if changes over the past year are short-term fluctuations or the beginning of a longer-term trend
-
from the mid-1990s up to the start of the pandemic, the employment rate for people aged 50 years and over has been increasing and the employment rate gap between people aged between 35 and 49 year and people aged between 50 and 64 years has been narrowing
-
also from the mid-1990s up to the start of the pandemic, the average age of exit from the labour market has been increasing steadily for both males and females
-
over the past year, the employment rate of people aged between 50 and 64 years has fallen slightly (although not statistically significantly) from 72.1% in 2020 to 71.2% in 2021
-
with little change in the employment rate of people aged between 35 and 49 years, the employment rate gap between the two age groups has seen a statistically significant increase from 12.9% in 2020 to 13.9% in 2021
-
the average age of exit from the labour market has fallen slightly for both males and females over the past year. In 2020, the average age of exit for men was aged 65.3 years, decreasing by 0.2 percentage points in 2021. Similarly, the 2020 average age of exit for women was 64.3, and decreased slightly by 0.3 percentage points in 2021
-
being sick, injured or disabled continues to be the main reason why people aged between 50 and 64 years are economically inactive in the labour market (36.9%, or 1.3 million), although the number of people in this age group stating retirement as a reason for not seeking work is close behind (35.1% or 1.2 million)
-
over 790,000 people aged between 50 and 64 years are either actively seeking work, or are inactive but are willing or would like to work, a fall from 810,000 in 2020
3. What you need to know
This is the sixth annual publication on the economic labour market status of individuals aged 50 and over in the UK. It provides more detailed breakdowns of the labour market outcomes of older workers over time than those routinely published by the Office for National Statistics (ONS) in their monthly Labour Market Statistics. Previous versions of this publication can be found on the GOV.UK website.
When interpreting results, particularly comparing time periods, users should be aware of the potential effect of the coronavirus (COVID-19) pandemic. This release covers the period up to April to June 2021, over a year into the pandemic and during a period of transition where restrictions were easing in line with the UK Government’s roadmap out of lockdown for England and corresponding changes made by the devolved administrations in Scotland, Wales and Northern Ireland.
The Latest statistics show the labour market continuing to recover, with the number of payroll employees showing increases in recent months. Since the start of the pandemic, analysis using the Labour Force Survey shows the employment rate has generally decreased, and the unemployment rate increased. However, since the end of 2020 both have shown signs of recovery. With the relaxation of many coronavirus restrictions, total hours worked increased in the latest quarter, however these are still below pre-pandemic levels. The redundancy rate decreased in the latest quarter and has returned to pre-pandemic levels.
HMRC Official Statistics showed that, at end of June 2021, a total of 1.9 million jobs were being furloughed through Coronavirus Job Retention Scheme (JRS), representing 6% of eligible employments. Amongst workers aged 50 and over, more than 600,000 jobs were furloughed, representing over one third of workers on furlough (34%), and up from 31% (nearly 800,000) at the end of May 2021.
Self-Employment Income Support Scheme (SEISS) Official Statistics show that to June 2021, 9.1 million claims had been made, by 2.9m individuals (these figures cover all four grants that have been available). For the fourth SEISS grant, the overall take-up rate of eligible workers was 58%, however, the take-up rate was lower compared to age groups between 25 and 54 for people aged 55 to 64 years (55%) and people aged 65 and over (42%).
The Office for National Statistics published analysis (on 4 May 2021) summarising the demographic and economic characteristics of older workers aged 50 years and over prior to the coronavirus (COVID-19) pandemic, and how the impact of the pandemic on older workers has varied based on these characteristics.
The most recent analysis by the Office for National Statistics (published on 25 August 2021) compares the characteristics of older workers aged 50 years and over by whether they have switched to working from home during the pandemic. They found that the characteristics of those who did not switch to working from home during the pandemic were similar to the characteristics of those who exit the labour market early reported in other research; they tend to have poorer health, lower well-being, live in deprived areas and have lower or no qualifications. It suggests while home working may help some older workers stay in the labour market for longer, it has not been an option for all, and may entrench existing inequalities.
Additional research and analysis has been carried out by other organisations – such as ‘A U-shaped crisis’ by the Resolution Foundation, and ‘The coronavirus pandemic and older workers’ by the Institute for Fiscal Studies.
Recent trends in employment should also be considered in the context of changes to State Pension age (SPa). Since 2010, female SPa gradually increased from 60 years, rising to 65 years by November 2018, at which point it equalled male SPa. In October 2020, SPa for both males and females increased to 66 years and will rise to 67 years by 2028. The 2017 SPa Review outlined a planned increase in SPa to 68 years by the period 2037 to 2039.
Working age is recognised internationally as people aged 16 to 64 years, whereby the State Pension age in the UK was formerly the upper limit. In order to understand trends over time, this release will continue to report on the 50 to 64 age group. However, data on people aged 50 to 65 years and more detailed tables containing statistics used in this release are in the data tables accompanying this release.
In this report, everybody aged 16 or over is defined as either employed, unemployed or economically inactive. Employed is defined as being in work, including those working part-time and those who are self-employed. Economic inactivity is defined as not working, have not been looking for work within the last 4 weeks or who are unable to start work within the next 2 weeks. Examples of economically inactive people include: people not looking for work because they are students; looking after the family or home; because of illness or disability or because they have retired. Unemployment is defined as not working, have been looking for work within the last 4 weeks and are able to start work within the next 2 weeks. A common misconception is that the unemployment statistics are a count of people on benefits; this is not the case as they include unemployed people not claiming benefits.
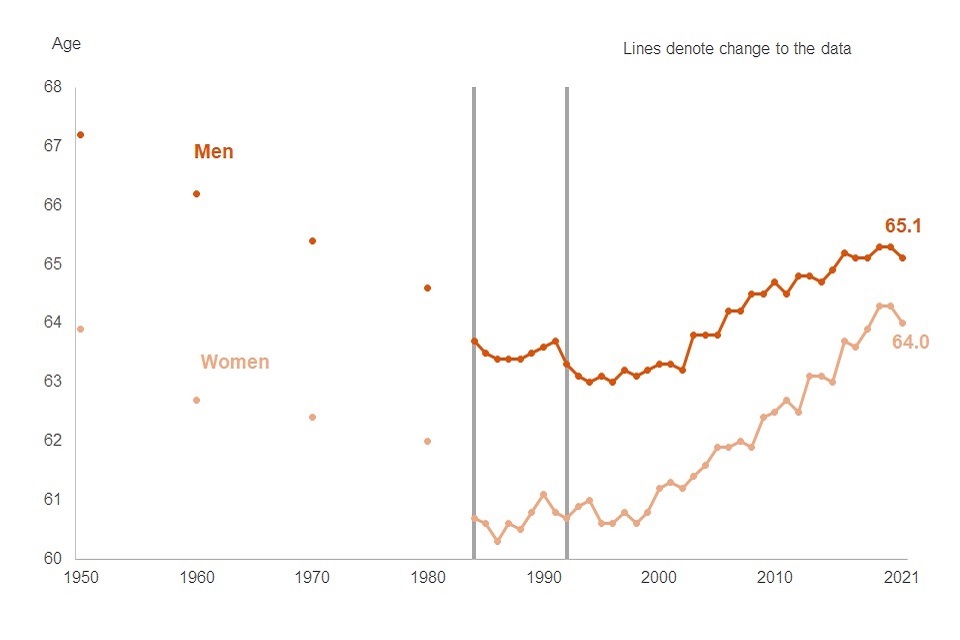
4. Average age of exit from the labour market
The average age of exit from the labour market is broken down for men and women due to the historic difference of state pension age for men and women. See the What you need to know section for further details.
In 1950, the average age of exit of men was aged 67.2 years. The average age of exit for men fell until 1980, when there was a change to the data source. Details of the change can be found in the background information and methodology.
In 2021, the male average age of exit from the labour market was aged 65.1 years, compared to aged 65.3 years in 2020, during which time, the State Pension age for men and women increased from 65 to 66 by October 2020.
The male average age of exit has increased by 2.1 years since 1996 when it reached its lowest point of aged 63.0 years.
Average age of men and women exiting from the labour market, 1950 to 2021, UK
Source: Table 1 of the data tables accompanying this release of statistics
The average age of exit for women in 1950 was aged 63.9 years. It fell and reached its lowest point in 1986 at aged 60.3 years. Since then, the average age of exit for women has increased by 3.7 years to aged 64.0 years in 2021.
Between 2009 (before the change to female SPa) and 2018, when female SPa incrementally increased from aged 60 to 65 years to equal men’s SPa, the average age of exit increased from 62.4 by 1.5 years to 63.9 years. The average age of exit of women continued to increase by 0.4 years to 64.3 years in 2020, when male and female SPa increased to 66.
However, it has now decreased by 0.3 years to aged 64.0 years in 2021, compared to aged 64.3 years in 2020.
5. Employment
The employment rate for people aged 50 to 64 years was 71.2% in the April to June 2021 period. This rate has been increasing steadily since the mid-1990s, when it stood at 57.2% in 1995. In the past year, the pandemic has reversed the upward trend, and the employment rate has decreased by 0.9 percentage points.
The gap between the employment rate of people aged 50 to 64 years and people aged 35 to 49 years was 13.9 percentage points in the April to June 2021 period, a significant increase of 1 percentage point in the last year (from 12.9 percentage points in April to June 2020). This gap has widened for both men and women. The employment rate gap between men aged 50 to 64 years and men aged 35 to 49 years widened by 1.3 percentage points in the last year, and by 0.9 percentage points for women aged 50 to 64 years and women aged 35 to 49 years.
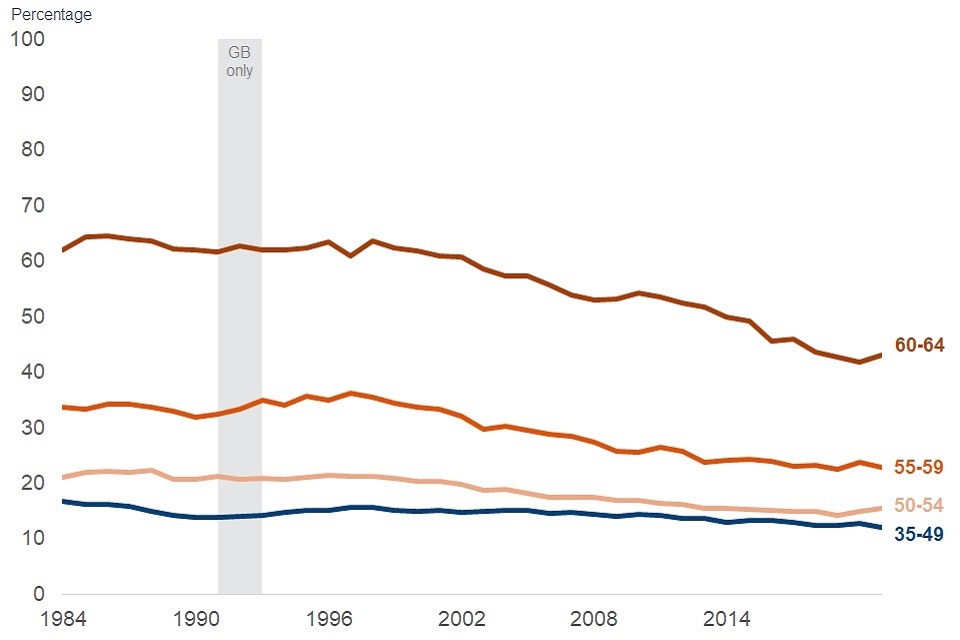
Employment rates of people aged 35 to 49 years and people aged 50 to 64 years, UK
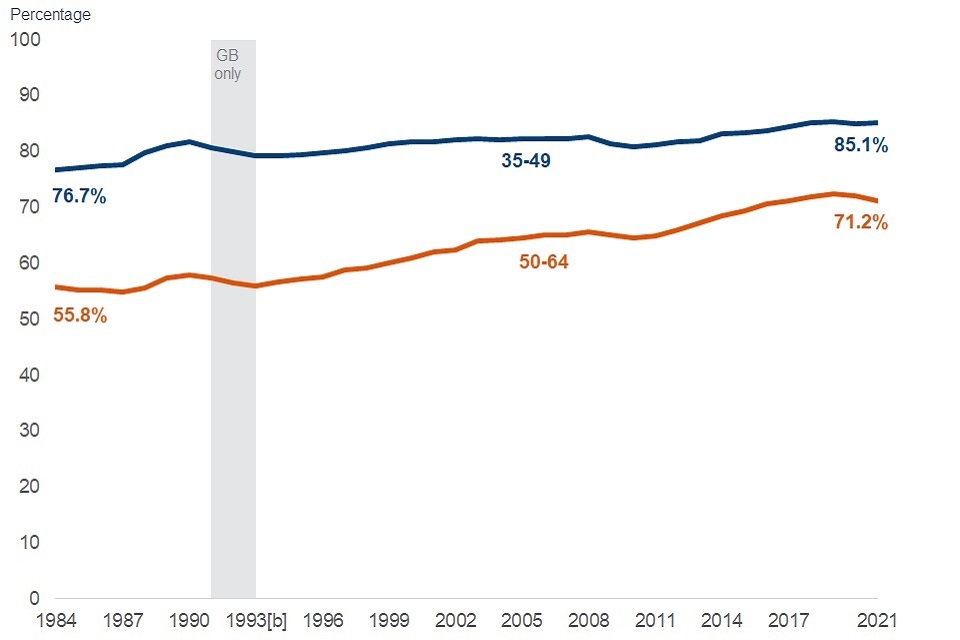
Source: Table 2 of the data tables accompanying this release of statistics
Over the past 10 years, the employment rates for each of the five-year age bands 50 to 54, 55 to 59, and 65 to 69 have shown very gradual upward trends. For people aged 60 to 64 years the increase has been much more marked, both amongst males and females. Most five-year age bands for over 50s have seen this trend reverse in the past year, with the exception of people aged 55 to 59 years whose employment rate is unchanged in the past year, and people aged 70 to 74 years whose employment rate has increased in the past year. Those aged 60 to 64 years appear to be particularly affected, with an employment rate drop of 2.0 percentage points in the past year.
The upward trend of employment rates for people aged 50 to 64 years over the past 25 years has been driven by increases in both full-time and part-time employment. Compared with 5 years ago, in 2021 there are a higher proportion of workers in all age bands above 50 in full-time employment. However, the recent fall in employment rates for people aged 50 to 64 years may be driven by a reversing trend for part-time employment. In 2021, proportions of older workers in part-time employment have fallen compared with 5 years ago, with the exception of people aged 60 to 64 years. In contrast, the upward trend of employment rates for people aged 35 to 49 over the past 25 years has been primarily driven by increases in full-time employment, with part-time employment only slightly fluctuating around a constant level up until 2021. As with the age bands above 50, compared with 5 years ago the employment rates for people aged 35 to 49 years in full-time employment have risen, but part-time employment rates have fallen.
The proportion of people aged 60 to 64 years in full-time employment has risen by 1.0 percentage points compared to 2016, with one in three people aged 60 to 64 years now in full-time employment (33.8%).
Full-time and part-time employment rates, UK
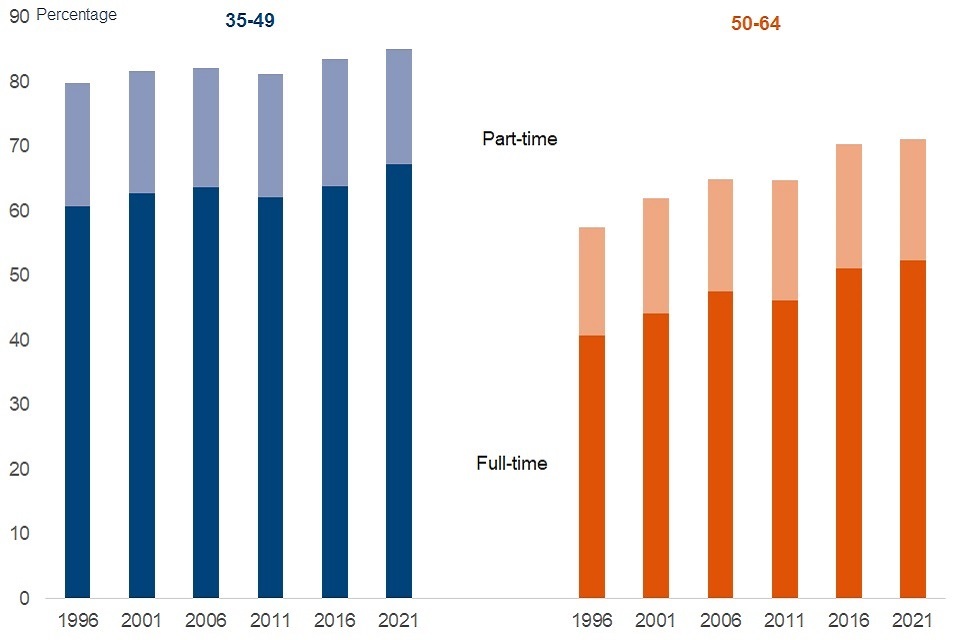
Source: Table 4 of the data tables accompanying this release of statistics
Women aged 50 to 64 years are considerably more likely than men of the same age to be in part-time employment. Between aged 50 and 54 years, women are four times more likely to be employed part-time than men, but are twice as likely to be employed part-time for those aged 60 to 64 years, with higher proportions of men moving into part-time work between age 60 and 64.
Full-time employment for people aged 65 and over has increased at a steady, constant rate since 1996. Part-time employment for people aged 65 and over has also increased steadily since 1996, but has fallen slightly in 2021. Part-time employment for people aged 65 and over has fallen by 0.8 percentage points between 2016 and 2021 (to 6.2%). This fall is driven by a fall of 1.2 percentage points for men aged 65 and over working part-time, compared with a slight fall of 0.2 percentage points for women aged 65 and over working part-time.
The number of people aged 50 to 64 years in self-employment fell significantly from 1.7 million (18.5%) in 2020 to 1.6 million (17.1%) in 2021. Similarly, the number of people aged 35 to 49 years in self-employment fell significantly from 1.6 million (15.1%) in 2020 to 1.4 million (13.3%) in 2021.
Proportions of people aged 35 to 49 years and people aged 50 to 64 years by industry sector, April to June 2021, UK
Workers aged 50 to 64 years have a broadly similar distribution amongst industry sectors to those aged 35 to 49 years. Older workers are most prevalent in the public admin, education and health sectors with over one in three older workers employed in these sectors. The same is true for people aged 35 to 49 years.
The sector with the lowest proportion of both age groups is the agriculture, forestry and fishing sector, though this is the only sector where older workers have a higher employment level than people aged 35 to 49 years.
More than half (52.1%) of female workers aged 50 to 64 years are employed in the public admin, education and health sectors, with another 29.5% of older female workers in the distribution, hotels and restaurants industries, or banking and finance. Similar rates are seen for female workers aged 35 to 49 years, with 49.1% employed in public admin, education and health sectors, and 30.4% employed in the distribution, hotels and restaurants industries, or banking and finance.
In comparison, older males have a more even distribution across all industry sectors, with public admin, education and health again the most prevalent but at 19.7%, or just under one in five older men.
Men aged 50 to 64 years are twice as likely as women to be employed in agriculture, forestry and fishing, are almost three times as likely as women to be employed in manufacturing, and are almost four times as likely as women to be employed in the construction, transport and communication sectors. Although these gender differences are not specific to people aged 50 to 64 years, they appear to be more pronounced than for people aged 35 to 49 years. Men aged 35 to 49 years are twice as likely as women of the same age to be employed in agriculture, forestry and fishing, are twice as likely as women to be employed in manufacturing, and are nearly 3 and a half times as likely as women to be employed in the construction, transport and communication sectors.
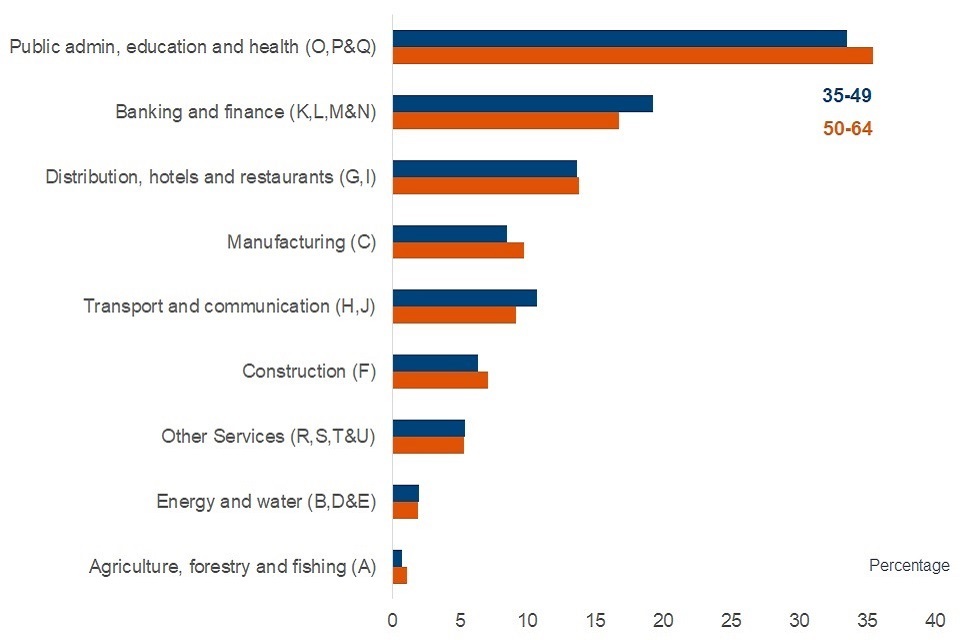
Source: Table 13 of the data tables accompanying this release of statistics
Employment rates of people aged 35 to 49 years and people aged 50 to 64 years by region, April to June 2021, UK
Northern Ireland has the lowest employment rate for people aged 50 to 64 years at 63.4%, compared to 71.7% for England. Northern Ireland is also significantly lower than Scotland (69.3%), but is not significantly lower than Wales (69.6%).
Amongst the English regions, the South East has the highest employment rate for people aged 50 to 64 years at 76.1%, while the North East has the lowest at 66.3%.
Although all regions have seen changes in the employment rate between 2020 and 2021, these changes are not statistically significant.
There is variation in the employment rate gap between people aged 35 to 49 years and people aged 50 to 64 years across regions and countries. The lowest gap is in London (9.3 percentage points), whilst Northern Ireland has the largest gap (21.9 percentage points).
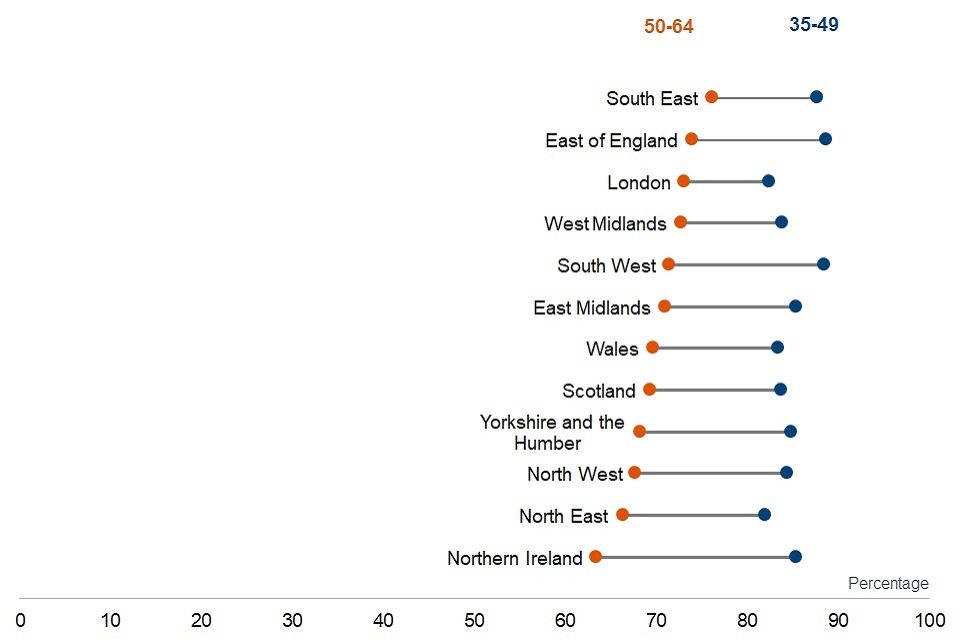
Source: Table 14 of the data tables accompanying this release of statistics
6. Economic inactivity
Alongside the fall of 0.9 percentage points in the employment rate for people aged 50 to 64 years in the past year, economic inactivity has only seen a slight increase of 0.3 percentage points. The economic inactivity rate for people aged 50 to 64 years overall was 26.3% between April to June 2021, and has been largely driven by females aged 60 to 64 years. This rate has generally been falling steadily since 1986, when it stood at 40.3%.
Economic inactivity, UK
Source: Table 6 of the data tables accompanying this release of statistics
Since 1995, the largest percentage point decrease in economic inactivity rates, for the 5-year age bands, has occurred for females aged 60 to 64 years (down by 26.1 percentage points from 74.3% to 48.2%); this corresponds with the increases in employment rates over this time period.
Reasons for not looking for work, individuals aged 50 to 64 who are inactive but are willing or would like to work, UK
In the period April to June 2021, there were 471,000 people aged 50 to 64 years who were economically inactive but were willing or would like to work. Of these, 222,000 were male and 249,000 were female.
About half of the 471,000 people who were economically inactive but willing or would like to work gave the reason for not looking for work as ‘being sick, injured or disabled’ (52.0%). This has significantly increased from 51.4% in the same period in 2020.
‘Looking after home or family’ was given as a reason by 14.9%. This has risen significantly from 14.4% in the same period in 2020. Around a third (33.1%) gave a reason of ‘Other’. The initial impact of the COVID-19 pandemic might have driven these changes on the year.
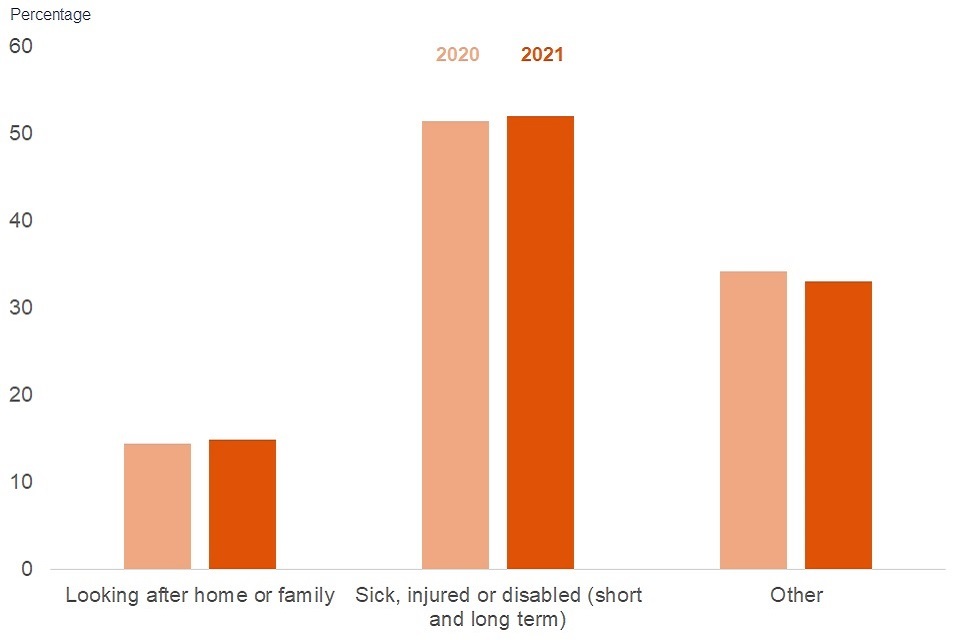
Source: Table 12 of the data tables accompanying this release of statistics
7. Unemployment
The 2021 fall in employment rates for people aged 50 to 64 years (drop of 0.9 percentage points) has resulted in an increase of 0.8 percentage points in their unemployment rate. The latest unemployment rate for this group is 3.4%, compared with 2.6% in 2020.
The unemployment rate for people aged 50 to 64 years follows a similar overall trend to the rate for people aged 35 to 49 years, with both rates tracking very closely since 2014.
Unemployment rate for people aged 35 to 49 years and people aged 50 to 64 year, 1984 to 2021, UK
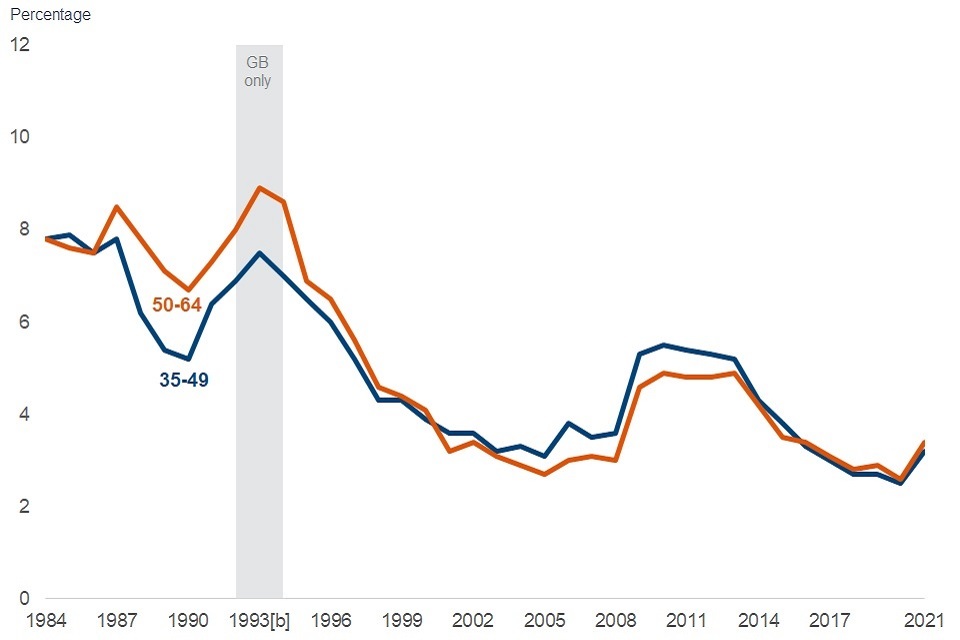
Source: Table 8 of the data tables accompanying this release of statistics
In the early 1990s, the unemployment rate for men aged 50 to 64 years was about 6 percentage points higher than the rate for women aged 50 to 64 years. At this time, women aged 50 to 64 years were more likely than men to be economically inactive. The gender difference in the unemployment rate started to narrow, but fluctuate, from the mid-1990s. For the latest period, April to June 2021, the unemployment rate for men aged 50 to 64 years was 0.9 percentage points higher than the rate for women aged 50 to 64 years.
Reason for leaving last job, people aged 50 to 64 who are not in work, UK
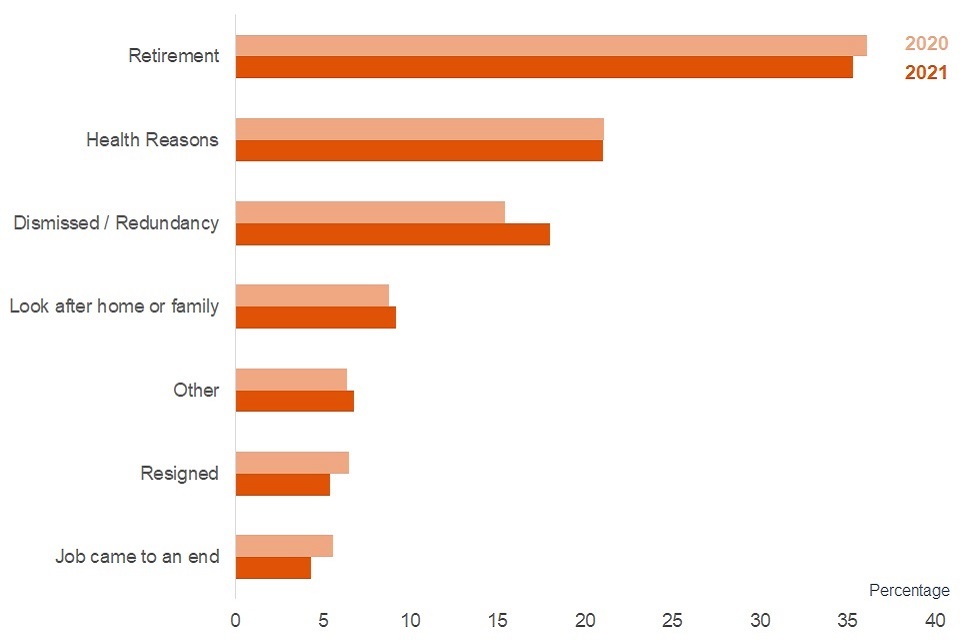
Source: Table 15 of the data tables accompanying this release of statistics
Of the 2.2 million people aged 50 to 64 years who were not in work in the period April to June 2021 and who had left their last job at some point in the last eight years, over one third (35.3%) gave a reason for leaving their last job as ‘retirement’. Although retirement is still the largest reason given, this has fallen slightly since 2020 (from 36.1%). ‘Health’ is the second largest reason given at 21.1%. Dismissal and redundancy are the third largest reason given and have seen a rise of 2.6 percentage points in the last year (from 15.4% to 18.0%). ‘Looking after home or family’ has also risen slightly since 2020 (8.8% to 9.2%).
8. About these statistics
These Official Statistics have been compiled using data from the Labour Force Survey (LFS) which is produced by the Office for National Statistics (ONS), and follow the same definitions and UK coverage used in the ONS Labour Market Statistics bulletin. These statistics have been developed using guidelines set out by the UK Statistics Authority. They continue to be badged as Experimental Official Statistics and include average age of exit from the labour market and in-depth statistics on the employment rate gap between people aged 50 to 64 years and people aged 35 to 49 years. These align with the three headline measures announced in the FWL Strategy 2017. The methodology of using static average age of exit will be considered for future iterations of this release. Please note these statistics are not seasonally adjusted. Users are invited to comment on the development and relevance of these statistics at this stage.
As part of continuing work to improve Labour Force Survey estimates (which have been affected by changes to survey operation caused by the coronavirus (COVID-19) pandemic), weighting methodology, improving the UK, EU and non-EU born population estimates, were implemented from 15 July 2021 for periods from January to March 2020 onward. This has provided a more precise estimation for the labour force.
Statistical significance
Statistical significance is a technical concept that states whether or not an estimated value is likely to have arisen only from random variations in the sampling. It is most often used when talking about a change or a difference: a significant change or difference is one that is not likely to be due only to the sampling, and therefore is likely to be a real change or difference.
Changes in levels or rates that have been highlighted in the text of this release are statistically significant at the 95% level, unless stated.
Where to find out more
For more information on the LFS see the background information and methodology document published alongside these statistics.
More information about the LFS can be found on the Labour Force Survey (LFS) QMI.
Contact information and feedback
The Department for Work and Pensions (DWP) would like to hear your views on these statistics. We would be interested in hearing what you use them for and how well they meet your requirements as well as interest in extending the analyses to fuller working lives. Feedback and queries about the statistics by e-mailing 50pluschoices.analysis@dwp.gov.uk
Press enquiries should be directed to the DWP Press Office: 020 3267 5144
Lead Statistician: Michael Payne