Drug Misuse: Findings from the 2012 to 2013 Crime Survey for England and Wales
Published 25 July 2013
Applies to England and Wales

© Crown copyright 2013
This publication is licensed under the terms of the Open Government Licence v3.0 except where otherwise stated. To view this licence, visit nationalarchives.gov.uk/doc/open-government-licence/version/3 or write to the Information Policy Team, The National Archives, Kew, London TW9 4DU, or email: psi@nationalarchives.gov.uk.
Where we have identified any third party copyright information you will need to obtain permission from the copyright holders concerned.
This publication is available at https://www.gov.uk/government/statistics/drug-misuse-findings-from-the-2012-to-2013-csew/drug-misuse-findings-from-the-2012-to-2013-crime-survey-for-england-and-wales
1. Extent and trends in illicit drug use among adults
1.1 Introduction
This section covers the extent and trends in illicit drug use among adults aged 16 to 59 measured by the 2012 to 2013 Crime Survey for England and Wales (CSEW). Also included separately are figures for young adults aged 16 to 24. Figures are presented since 1996 when comparable questions were first included on the survey.
The User Guide provides further details relating to illicit drug use measures.
1.2 Key facts
- Around 1 in 12 (8.2%) adults had taken an illicit drug (excluding mephedrone) in the last year, a fall compared with 2011/12 (8.9%). This equates to around 2.7 million people;
- According to the 2012/13 CSEW, 2.6% of adults aged 16 to 59 had taken a Class A drug in the last year (equivalent to almost 850,000 people);
- Cannabis was the most commonly used drug, with 6.4% of adults aged 16 to 59 using it in the last year;
- The next most commonly used drugs in the last year were powder cocaine (1.9%) and ecstasy (1.3%). Along with cannabis, these were also the most used drugs in 2011/12;
- For all adults, the use of mephedrone in the last year has fallen from 1.1% in 2011/12 to 0.5% in 2012/13;
- Young adults (those aged 16 to 24) were more likely to have used drugs in the last year than older adults. However, the proportion of adults aged 16 to 24 taking any drug in the last year was 16.3%, down from 19.3% in 2011/12.
1.3 Extent and trends in overall drug use and Class A drug use
From the 2012/13 CSEW (and shown in Figure 1.1):
- Around 1 in 12 (8.2%) adults had taken an illicit drug (excluding mephedrone) in the last year, a fall compared with 2011/12 (8.9%);
- Despite remaining broadly flat until 2003/04 (at around 12%), the proportion of adults taking any illicit drug in the last year has subsequently decreased to 8.2% in 2012/13;
- The proportion of adults aged 16 to 24 taking any drug in the last year was almost double the proportion in the 16 to 59 age group, at 16.3%.
However, this was a decrease compared with 2011 to 2012 (19.3%).
Figure 1.1: Trends in illicit drug use (excluding mephedrone) in the last year among adults, 1996 to 2012/13, Crime Survey for England and Wales
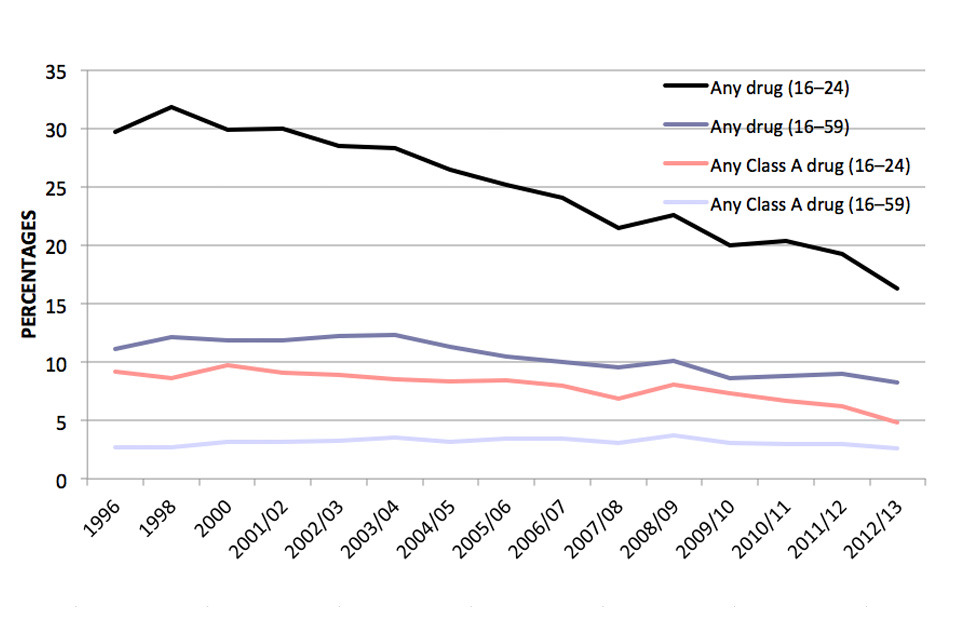
This line graph shows trends in any illicit drug use and Class A drug use in the last year among adults, between 1996 and 2012 to 2013.
Chart notes
Source: Home Office, Illicit drug use among adults tables: Tables Ext_02 and Ext_05.
Including mephedrone, the proportion of adults aged 16 to 59 taking any illicit drug in the last year was 8.2% in 2012/13 (i.e. no different to the proportion when excluding mephedrone). This was a decrease from 9.1% in 2011 to 2012.
According to the 2012 to 2013 CSEW, 2.6% of adults aged 16 to 59 had taken a Class A drug in the last year (equivalent to around 850,000 people). As shown in Figure 1.1, the long-term trend in Class A drug use in the last year for all adults has been broadly stable since 1996. Supporting this finding, there is no statistically significant difference between the 1996 (2.7%) and 2012 to 2013 (2.6%) surveys. Figure 1.1 also shows that the long-term trend in Class A drug use in the last year for adults aged 16 to 24 decreased between the 1996 (9.2%) and 2012 to 2013 (4.8%) surveys. This decrease can be explained by a decline over the same period in last year use of ecstasy, LSD and magic mushrooms (see the next section ‘Extent and trends in individual drug use’).
1.4 Extent and trends in individual drug use
Cannabis
As in previous years, cannabis was the most commonly used drug in the last year, with 6.4% of adults using it last year. As shown in Figure 1.2, this is down on 2011 to 2012 (6.9%) and is the lowest proportion since measurement began in 1996 (when the proportion was 9.5%). Last year cannabis use for 16 to 59 year olds was highest in 2002 to 2003 (10.9%) and has since fallen.
Figure 1.2: Extent of last year cannabis use among adults, 1996 to 2012 to 2013, Crime Survey for England and Wales
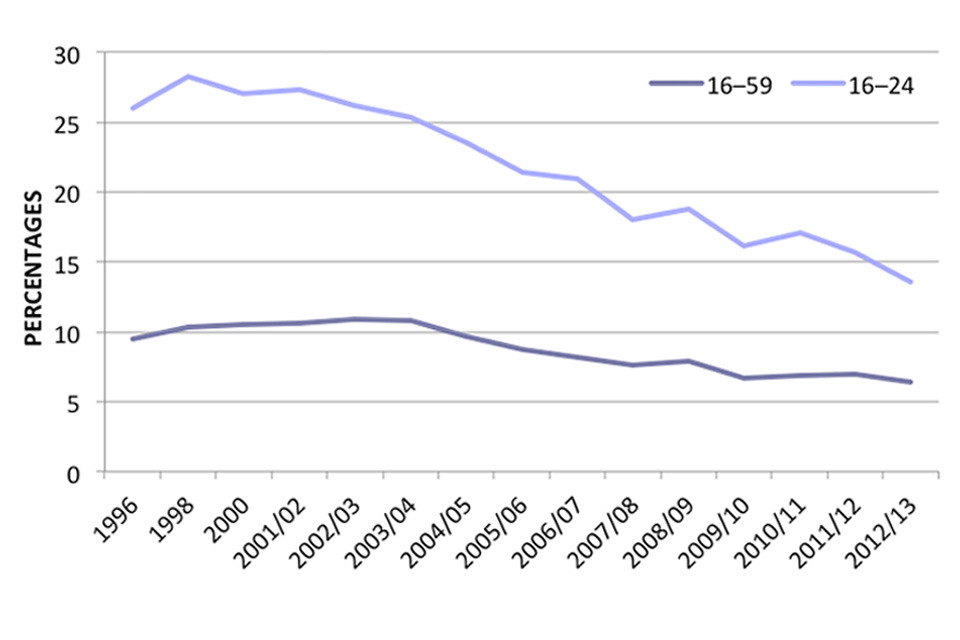
This line graph shows trends in cannabis use in the last year among adults aged 16 to 59 and young adults aged 16 to 24, between 1996 and 2012 to 2013.
Chart notes
Source: Home Office, Illicit drug use among adults tables: Tables Ext_02 and Ext_05.
Similar to the findings for all adults, cannabis was the most commonly used drug in the last year among young adults, with 13.5% of adults aged 16 to 24 using it last year. As shown in Figure 1.2, this is down on 2011 to 2012 (15.7%) and is the lowest proportion since measurement began in 1996 (when the proportion was 26.0%) and on the peak in 1998 (28.2%).
Powder cocaine
As in 2011 to 2012 after cannabis, the next most commonly used drug in the last year by adults aged 16 to 59 was powder cocaine (1.9%). As shown in Figure 1.3, the proportion of adults aged 16 to 59 using powder cocaine in the last year was at around the same level in 2012 to 13 (1.9%) as in 2011 to 12 (2.2%). However, it is higher than the proportion in 1996 (0.6%), although lower than the peak usage in 2008 to 2009 (3.0%).
Figure 1.3: Extent of last year powder cocaine use among adults, 1996 to 2012 to 2013 Crime Survey for England and Wales
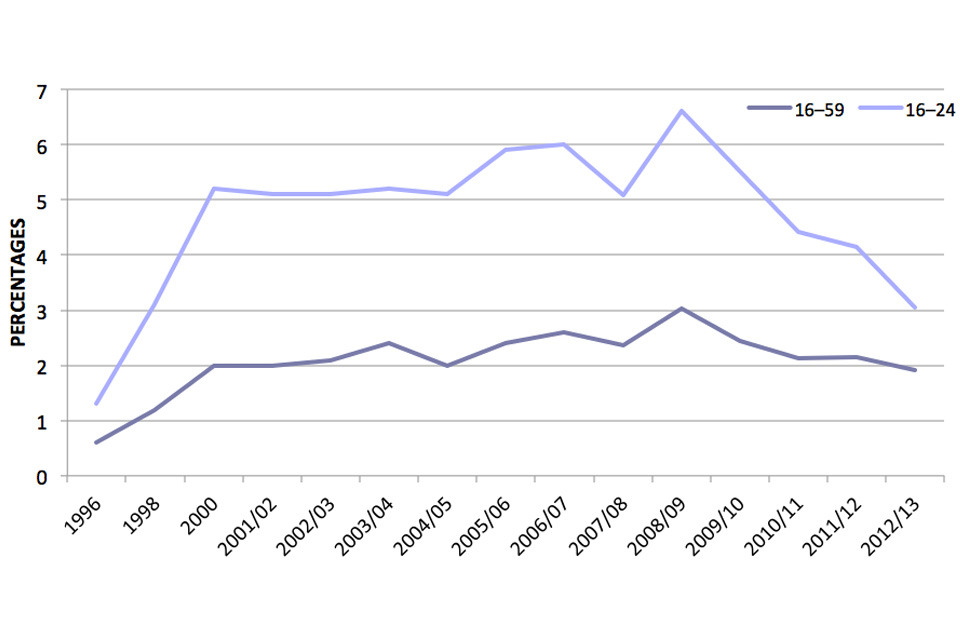
This line graph shows trends in powder cocaine use in the last year among adults aged 16 to 59 and young adults aged 16 to 24, between 1996 and 2012 to 2013.
Chart notes
Source: Home Office, Illicit drug use among adults tables: Tables Ext_02 and Ext_05.
Despite the fall in young adult overall Class A drug use (see Section ‘Extent and trends in overall drug use and class A drug use’) in the last year between 1996 and 2012/13, there was a significant increase in the use of powder cocaine over the same period (1.3% to 3.0%).The trend in cocaine use in the last year for those aged 16 to 24 follows a similar pattern to that for all adults aged 16 to 59, although since 1998 the proportions have been consistently around twice that of the wider age group, with the exception of the latest year where the gap has decreased.
Other illicit drugs
As shown in Figure 1.4, ecstasy use in the last year by adults aged 16 to 59 has fallen from 1.7% in 1996 to 1.3% in 2012 to 2013, although use remains similar to 2011 to 2012 (1.4%).
Figure 1.4: Extent of last year ecstasy use among adults, 1996 to 2012 to 2013 Crime Survey for England and Wales
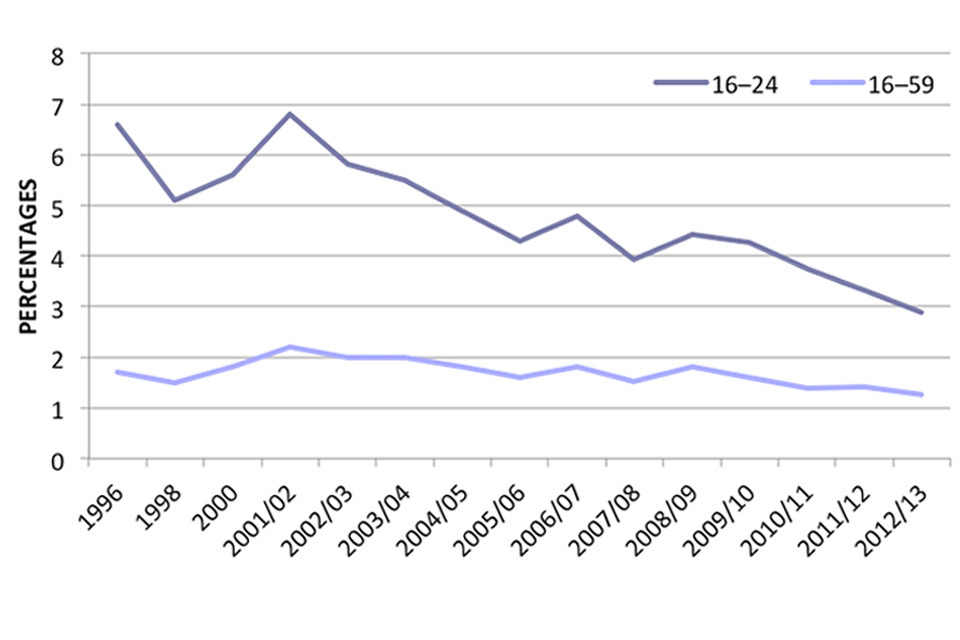
This line graph shows trends in ecstasy use in the last year among adults aged 16 to 59 and young adults aged 16 to 24, between 1996 and 2012 to 2013.
Chart notes
Source: Home Office, Illicit drug use among adults tables: Tables Ext_02 and Ext_05.
In 2012 to 2013, ecstasy use among young adults fell to the lowest proportion (2.9%) since measurement began in 1996 (when the proportion was 6.6%), as shown in Figure 1.4. Last year ecstasy use for 16 to 24 year olds peaked in 2001/2 (6.8%) and has since fallen.
For adults aged 16 to 59, decreases in the last year use of the following ‘other’ drugs were statistically significant between 2011 to 2012 and 2012 to 2013:
- mephedrone (1.1% to 0.5% in 2012/13);
- ketamine (0.6% to 0.4% in 2012/13);
- magic mushrooms (0.5% to 0.3% in 2012/13);
- methadone (0.2% to 0.1% in 2012/13).
For young adults aged 16 to 24, decreases in the last year use of the following ‘other’ drugs were statistically significant between 2011 to 2012 and 2012 to 2013:
- mephedrone (3.3% to 1.6% in 2012/13);
- ketamine (1.8% to 0.8% in 2012/13);
- magic mushrooms (1.2% to 0.6% in 2012/13);
- methadone (0.4% to 0.0% in 2012/13).
For both age groups the proportion of adults using amyl nitrite in the last year was the lowest since measurement began in 1996:
- 0.8% of adults aged 16 to 59 had used amyl nitrite in the last year, compared with 1.3% in 1996;
- 1.2% of young adults (aged 16 to 24) had used amyl nitrite in the last year, compared with 4.6% in 1996.
The proportion of adults using heroin stayed low, with 0.1% of adults aged 16 to 59 and 0.0% of young adults (aged 16 to 24) having used heroin in the last year.
There were no statistically significant increases between 2011 to 2012 and 2012 to 2013 for last year drug use for any type of drugs for adults aged 16 to 59 and young adults aged 16 to 24.
Questions on khat were not asked in the 2012 to 2013 survey, however the 2011 to 2012 survey showed that the proportion of adults using khat in the last year was 0.2%, the same level as in 2010 to 11.
1.5 Last year use of legal emerging drugs
For the 2012 to 2013 CSEW, questions were added for the first time on the last year use of legal emerging drugs salvia and nitrous oxide:
- 2.0% of adults aged 16 to 59 had taken nitrous oxide in the last year
- 0.3% of adults aged 16 to 59 had taken salvia in the last year
For young adults, aged 16 to 24:
- 6.1% had taken nitrous oxide in the last year
- 1.1% had taken salvia in the last year
1.6 Lifetime use of illicit drugs
According to the 2012 to 2013 CSEW:
- Around one-third of adults (35.9%) have taken an illicit drug in their lifetime;
- 15% of adults aged 16 to 59 had taken a Class A drug in their lifetime (around 5 million people);
- In 2012 to 2013, for all adults the most commonly used drugs ever used were cannabis (30.0%), amphetamines (10.4%) and amyl nitrite (9.3%);
- The proportion of adults aged 16 to 24 having ever taken an illicit drug was similar to adults of all ages (36.7%). This is a statistically significant fall from 1996 (48.6% in the same age group);
- 12.5% of 16 to 24 year olds had taken a Class A drug in their lifetime (around 800,000 people). This represented a decline from the previous year (15.1% in 2011 to 2012);
- For young adults, the drugs most widely used ever were cannabis (30.9%), powder cocaine (8.4%) and amyl nitrite (8.1%).
1.7 Summary of trends
Table 1: Summary of trends in last year drug use among adults aged 16 to 59
Compared with when drug questions were added to survey: Between 1996 and 2012 to 2013
| Increase | Decrease | No change |
|---|---|---|
| Powder cocaine | Any drug | Any Class A drug |
| Any stimulant drug | Crack cocaine | |
| Ecstasy | Heroin | |
| LSD | Methadone | |
| Magic mushrooms | Tranquillisers | |
| Amphetamines | Anabolic steroids | |
| Cannabis | ||
| Amyl nitrite |
Compared with 10 years ago: Between 2002 to 2003 and 2012 to 2013
| Increase | Decrease | No change |
|---|---|---|
| Anabolic steroids | Any drug | Powder cocaine |
| Any stimulant drug | Crack cocaine | |
| Any Class A drug | LSD | |
| Ecstasy | Heroin | |
| Magic mushrooms | Methadone | |
| Amphetamines | Tranquillisers | |
| Cannabis | ||
| Amyl nitrite |
Compared with last year: Between 2011 to 2012 and 2012 to 2013
| Increase | Decrease | No change |
|---|---|---|
| Any drug | Powder cocaine | |
| Any stimulant drug | Crack cocaine | |
| Any Class A drug | Ecstasy | |
| Magic mushrooms | LSD | |
| Methadone | Heroin | |
| Mephedrone | Amphetamines | |
| Cannabis | Methamphetamine | |
| Ketamine | Tranquillisers | |
| Anabolic steroids | ||
| Amyl nitrite |
Table notes
Source: Home Office, Illicit drug use among adults tables: Tables Ext_02 and Ext_05.
‘Any drug’ comprises powder cocaine, crack cocaine, ecstasy, LSD, magic mushrooms, ketamine, heroin, methadone, amphetamines, methamphetamine, cannabis, tranquillisers, anabolic steroids, amyl nitrite, any other pills/powders/drugs smoked. Where drugs are aggregated into composite groups, these are listed in bold typeface. Drugs listed in the increase or decrease columns have seen a statistically significant change in reported usage.
Table 2: Summary of trends in last year drug use among adults aged 16 to 24
Compared with when drug questions were added to survey: Between 1996 and 2012 to 2013
| Increase | Decrease | No change |
|---|---|---|
| Powder cocaine | Any drug | Crack cocaine |
| Any stimulant drug | Heroin | |
| Any Class A drug | Methadone | |
| Ecstasy | Tranquillisers | |
| LSD | Anabolic steroids | |
| Magic mushrooms | ||
| Amphetamines | ||
| Cannabis | ||
| Amyl nitrite |
Compared with 10 years ago: Between 2002 to 2003 and 2012 to 2013
| Increase | Decrease | No change |
|---|---|---|
| Any drug | Crack cocaine | |
| Any stimulant drug | Anabolic steroids | |
| Any Class A drug | ||
| Powder cocaine | ||
| Ecstasy | ||
| LSD | ||
| Magic mushrooms | ||
| Heroin | ||
| Methadone | ||
| Amphetamines | ||
| Cannabis | ||
| Tranquillisers | ||
| Amyl nitrite |
Compared with last year: Between 2011 to 2012 and 2012 to 2013
| Increase | Decrease | No change |
|---|---|---|
| Any drug | Powder cocaine | |
| Any stimulant drug | Crack cocaine | |
| Any Class A drug | Ecstasy | |
| Magic mushrooms | LSD | |
| Methadone | Heroin | |
| Cannabis | Ampethamines | |
| Mephedrone | Methamphetamine | |
| Ketamine | Tranquillisers | |
| Anabolic steroids | ||
| Amyl nitrite |
Table notes
Source: Home Office, Illicit drug use among adults tables: Tables Ext_02 and Ext_05.
‘Any drug’ comprises powder cocaine, crack cocaine, ecstasy, LSD, magic mushrooms, ketamine, heroin, methadone, amphetamines, methamphetamine, cannabis, tranquillisers, anabolic steroids, amyl nitrite, any other pills/powders/drugs smoked. Where drugs are aggregated into composite groups, these are listed in bold typeface. Drugs listed in the increase or decrease columns have seen a statistically significant change in reported usage.
1.8 Data tables
Estimates of illicit drug use among adults from the 2012 to 2013 CSEW can be found in the Illicit drug use among adults tables. Illicit drug use among adults tables: Tables Ext_02 and Ext_05.
For information on data quality, how to interpret these figures and other data sources, please see Section 6 and the User Guide.
2. Frequent drug use in the last year
2.1 Introduction
This section investigates levels of frequent drug use, defined as taking any illicit drug more than once a month on average in the last year, among adults aged 16 to 59 and among young adults aged 16 to 24 as measured by the 2012 to 2013 Crime Survey for England and Wales (CSEW, formerly the British Crime Survey).
2.2 Key facts
-
In 2012 to 2013, 2.8% of adults aged 16 to 59 were defined as frequent drug users (having taken any illicit drug more than once a month on average in the last year), a lower proportion than in 2011 to 2012 (3.3%).
-
Although the proportion of young adults aged 16 to 24 classed as frequent drug users (5.1%) was almost twice as high as the proportion of all adults aged 16 to 59 (2.8%) in 2012 to 2013, this was a decrease compared with 2011 to 2012 (7.0%).
2.3 Extent of frequent drug use
Estimates from the 2012 to 2013 CSEW show that 2.8% of adults aged 16 to 59 were defined as frequent drug users (having taken any illicit drug more than once a month on average in the last year), lower than in 2011 to 2012 (3.3%). Frequent drug users made up 38% of the adults who reported drug use within the last year, a similar proportion to the 2011 to 2012 survey (40%).
The proportion of young adults (i.e. those aged 16 to 24) defined as frequent drug users was almost twice as high (5.1%) as the proportion of frequent drug users among all adults aged 16 to 59 (2.8%). However, among young adults who reported taking any drug in the last year, just over one-third (35%) were defined as frequent drug users, a similar proportion to among adults aged 16 to 59 who reported taking drugs last year (38%).
As reported in the previous section, Extent and trends in illicit drug use among adults, cannabis was the most prevalent drug taken in the last year among adults aged 16 to 59 (6.4%). Of those who had used drugs in the previous year, 78% reported taking cannabis. Among all young adults aged 16 to 24, 13.5% had taken cannabis in the last year, and 83% of last year drug users had taken cannabis. Of those aged 16 to 59 reporting use of cannabis during the last year, 41% reported frequent use of this drug (i.e. they had taken it more than once a month on average in the last year). The equivalent proportion for young adults aged 16 to 24 was similar, at 36%.
2.4 Trends in frequent drug use
There has been a decrease in frequent drug use among 16 to 24 year-olds since measurement began in the 2002 to 2003 survey (from 11.6% to 5.1%). As shown in Figure 2.1, there was a general downward trend between 2003 to 2004 (12.4%) and 2007 to 2008 (7.3%). Although the trend was broadly flat between 2007 to 2008 and 2011 to 2012, there was a further reduction in 2012 to 2013 (5.1%). Questions on frequency of use in the last year were first completed by all adults aged 16 to 59 in the 2009 to 2010 survey and there was a fall between 2011 to 2012 (3.3%) and 2012 to 2013 (2.8%).
Figure 2.1: Proportion of 16 to 24 and 16 to 59 year olds classified as frequent drug users, 2002 to 2003 to 2012 to 2013 Crime Survey for England and Wales
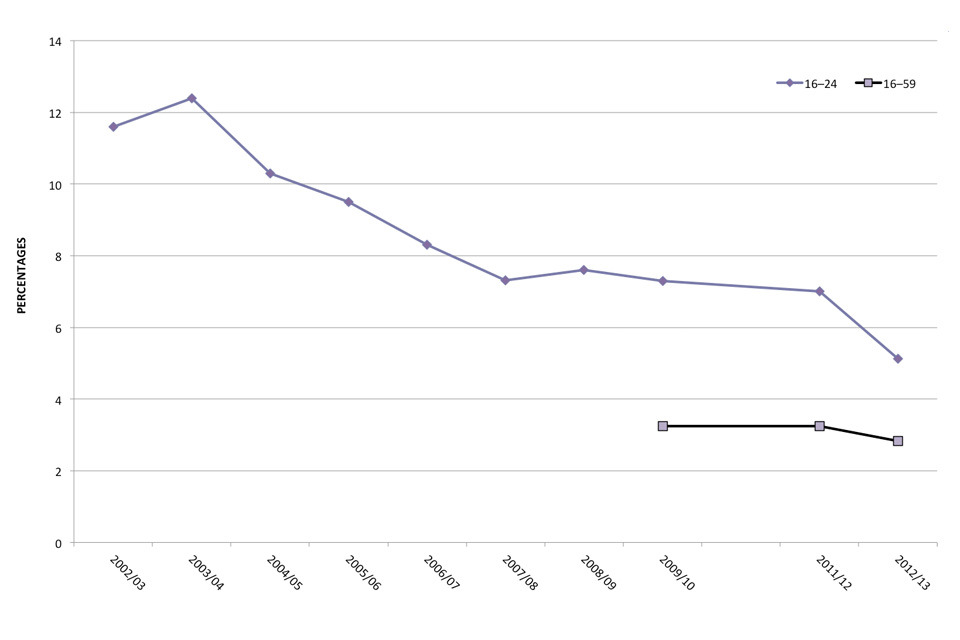
This line graph shows the trend in the proportion of 16 to 24 year olds and 16 to 59 year olds classified as frequent drug users, between 1996 and 2012/13.
Chart notes
Source: Home Office, Extent and Trends tables: Table Ext_02 and Ext_05.
For the first time, figures for 2012 to 2013 include frequent users of mephedrone only. However, these numbers are so small that excluding them from the 2012 to 2013 figures does not change the proportions to one decimal place. Data for 2010 to 2011 are not available, see the Data quality and interpreting the figures section for more information.
2.5 Frequent drug use by selected personal, household and area characteristics
The proportion of frequent drug users varied by personal and area characteristics. For example: * Levels of use of any illicit drug more than once a month on average in the last year were higher among men than women in 2012 to 2013. Men were three times as likely as women to report frequent drug use in the last year (4.2% and 1.4% respectively); * Around 8.5% of respondents who had been to a nightclub four or more times in the last month were frequent drug users. This compares with 2.3% of respondents who had not visited a nightclub in the past month; * A larger proportion (3.1%) of respondents in urban locations were frequent drug users compared with those who lived in rural locations (1.8%); * The likelihood of frequent drug use in the last month tended to decrease as household income rose – 6.8% of respondents with an annual household income of under £10,000 reported frequent drug use, decreasing to 1.4% of respondents with a total household income of £50,000 or more.
A full breakdown of frequent drug use by personal, area and household characteristics appears in Frequent drug use tables F_03 and F_04.
2.6 Data tables
Estimates of frequent drug use in the last year among adults from the 2012 to 2013 CSEW can be found in the Frequent drug use tables. Historic frequent drug use data can be found in the Extent and trends in illicit drug use tables.
For information on data quality, how to interpret these figures and other data sources, please see Section 6 and the User Guide.
3. Illicit drug use by personal, household and area characteristics and lifestyle factors
3.1 Introduction
This section presents findings from the 2012 to 2013 Crime Survey for England and Wales (CSEW, formerly the British Crime Survey) on levels of illicit drug use over the last year by age, gender, frequency of nightclub and pub/wine bar visits, alcohol consumption and some area characteristics.
3.2 Key facts
- Levels of any drug use in the last year were highest among young adults aged 16 to 19 (16.4%) and 20 to 24 (16.2%);
- Class A drug use was highest among 20 to 29 year olds (5.7% of 20 to 24 year olds and 5.4% of 25 to 29 year olds);
- Since 1996 levels of any drug use, Class A drug use, and use of individual drugs in the last year have been higher for men than for women;
- As shown in previous years, levels of drug use increased with frequency of visits to a nightclub or pub/wine bar, and with frequency of alcohol consumption.
3.3 Extent and trends in illicit drug use by age group
As shown in previous years, the level of any drug use in the last year was highest among the youngest age groups; 16.4% of 16 to 19 year olds and 16.2% of 20 to 24 year olds reported any drug use in the last year. Levels of illicit drug use then decreased as age increased, from 12.8% of those aged 25 to 29 to 2.3% of 55 to 59 year olds.
Figure 3.1: Proportion of 16 to 59 year olds reporting use of any drug in the last year by age group, 1996 to 2012 to 2013 Crime Survey for England and Wales
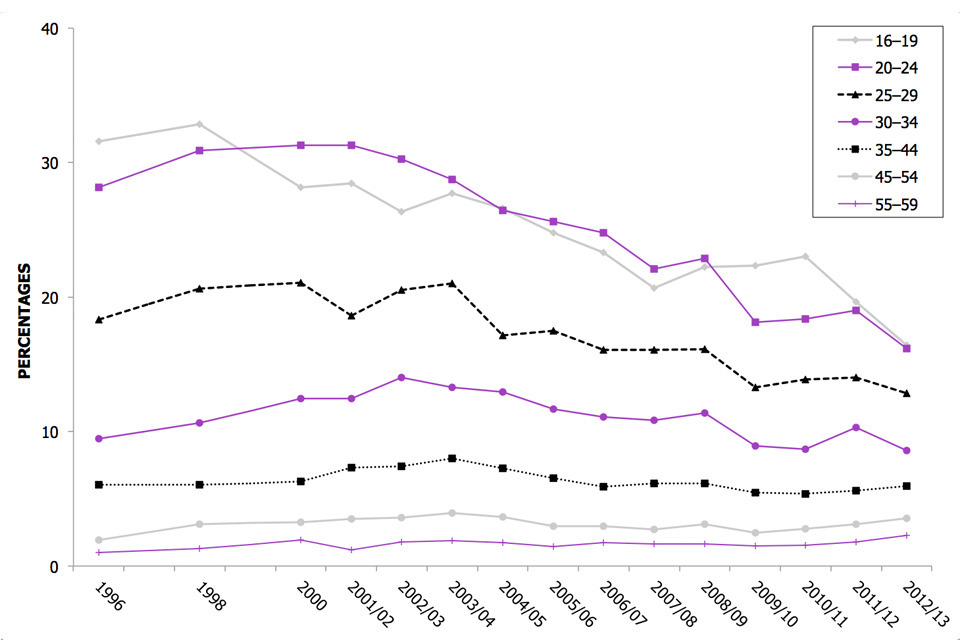
This line graph shows the proportion of 16 to 59 year olds reporting use of any drug in the last year by age group, between 1996 and 2012/13.
Chart notes
Source: Home Office, Illicit drug use by demographics tables: Table D_03.
Between the 1996 and 2012 to 2013 CSEW last year use of any illicit drug fell overall, due in large part to the declines in illicit drug use among 16 to 24 year olds (as shown in Figure 3.1) for the most prevalent drug types (cannabis, ecstasy, amphetamines and hallucinogens). Over the same period, there have been increases in any drug use among 45 to 59 year olds (from 1.9% to 3.5% for 45 to 54 year olds and from 1.0% to 2.3% for 55 to 59 year olds). These have primarily been driven by increases in the use of cannabis, although use of this drug among these age groups is still relatively low compared to younger age groups.
As shown in ‘Extent and trends in illicit drug use among adults’, cannabis use has declined overall between 2011 to 2012 and 2012 to 2013 (from 6.9% to 6.4%) and, more specifically, use among 20 to 24 year olds fell from 15.7% to 13.0% over this period. Class A drug use was highest among 20 to 29 year olds with 5.7% of 20 to 24 year olds and 5.4% of 25 to 29 year olds reporting use of these types of drugs in the last year. The overall use of Class A drugs has remained stable since 1996 but fell between 2011 to 2012 and 2012 to 2013 from 3.0% to 2.6%. Between 1996 and 2012 to 2013, any Class A use declined among 16 to 19 year olds (down from 9.6% in 1996 to 3.5% in 2012 to 2013 and 20 to 24 years olds (from 8.9% to 5.7%), but increased among 30 to 54 year olds (for example, from 1.9% in 1996 to 3.1% in 2012 to 2013 among 30 to 34 year olds). Use among 25 to 29 year olds and 55 to 59 year olds has remained stable since 1996. Patterns of use for individual drugs vary by age group. As shown in Figure 3.2, while cannabis is the most prevalent drug across all age groups, use peaks among 16 to 19 year olds (14.3% used cannabis in the last year) and decreases with increasing age. Whereas, the prevalence of ecstasy use peaks among 20 to 24 year olds (at 3.3% in 2012 to 2013) and powder cocaine use peaks among 25 to 29 year olds (at 4.4% in 2012 to 2013). Both ecstasy and powder cocaine use then decrease with increasing age.
Figure 3.2: Proportion of 16 to 59 year olds reporting use of powder cocaine, ecstasy and cannabis in the last year by age group, 2012 to 2013 Crime Survey for England and Wales
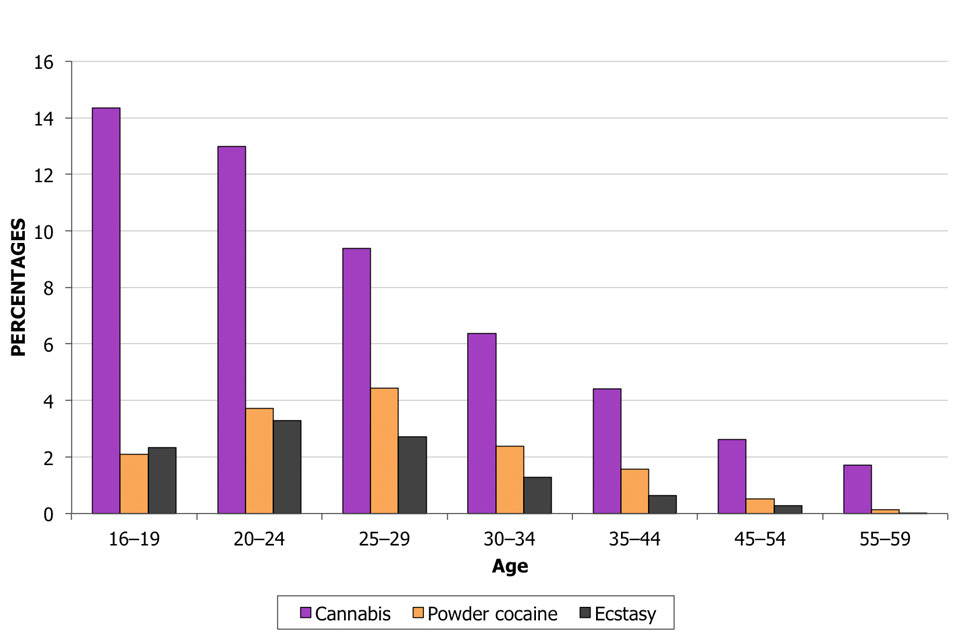
This bar chart shows the proportion of 16 to 59 year olds reporting use of powder cocaine, ecstasy and cannabis in the last year by age group.
Chart notes
Source: Home Office, Illicit drug use by demographics tables: Table D_03
3.4 Extent and trends in illicit drug use by gender
Levels of use of any illicit drug and any Class A drug during the last year were higher among men than women in 2012 to 2013, a pattern which has been seen every year since 1996. This pattern can also be seen for individual drugs, for example, according to the 2012 to 2013 survey, men were twice as likely to report use of cannabis in the last year as women (8.6% and 4.1% respectively).
In 2012 to 2013, use of cannabis, any Class A drug and any drug in the last year declined among men compared with 2011 to 2012:
- cannabis use fell from 9.7% to 8.6%;
- use of any Class A drug fell from 4.4% to 3.7%;
- use of any drug fell from 12.4% to 11.0%.
Among women, use of hallucinogens fell between 2011 to 2012 and 2012 to 2013 (from 0.2% to 0.1%) but use of the other drugs measured in the survey remained stable.
Over the longer term, i.e. between 1996 and 2012 to 2013, there have been falls in use of hallucinogens, amphetamines, cannabis and any drug, but an increase in the use of powder cocaine, among both men and women.
3.5 Extent and trends in illicit drug use by lifestyle factors
Illicit drug use varied by lifestyle factors such as frequency of nightclub and pub/wine bar visits and alcohol consumption.
As shown in previous years, levels of drug use in the last year increases with the frequency of nightclub and pub/wine bar visits. For example, in the 2012 to 2013 CSEW, among adults aged 16 to 59: * Use of mephedrone in the 12 months prior to interview, was around 20 times higher (the largest difference across all types of drugs measured in the CSEW) among those who had visited a nightclub 4 or more times in the past month (4.4%) compared with those who had not visited a nightclub in the past month (0.2%). * Last year use of powder cocaine was around 11 times higher among those who had visited a pub/wine bar 9 or more times in the past month (8.1%) compared with those who had not visited a pub/wine bar in the past month (0.7%).
As shown in Figure 3.3, in 2012 to 2013, as frequency of alcohol consumption increased, so did drug use within the last year. Adults aged 16 to 59 who reported drinking alcohol three or more days per week in the last month were around twice as likely to have used any illicit drug (10.6%) and five times more likely to have used a Class A drug (4.5%) in the last year than those who reported drinking less than once a month (including non-drinkers) (4.9% for any drug and 0.9% for any Class A drug).
Figure 3.3: Proportion of 16 to 59 year olds reporting use of individual drugs in the last year by frequency of alcohol consumption, 2012 to 2013 Crime Survey for England and Wales
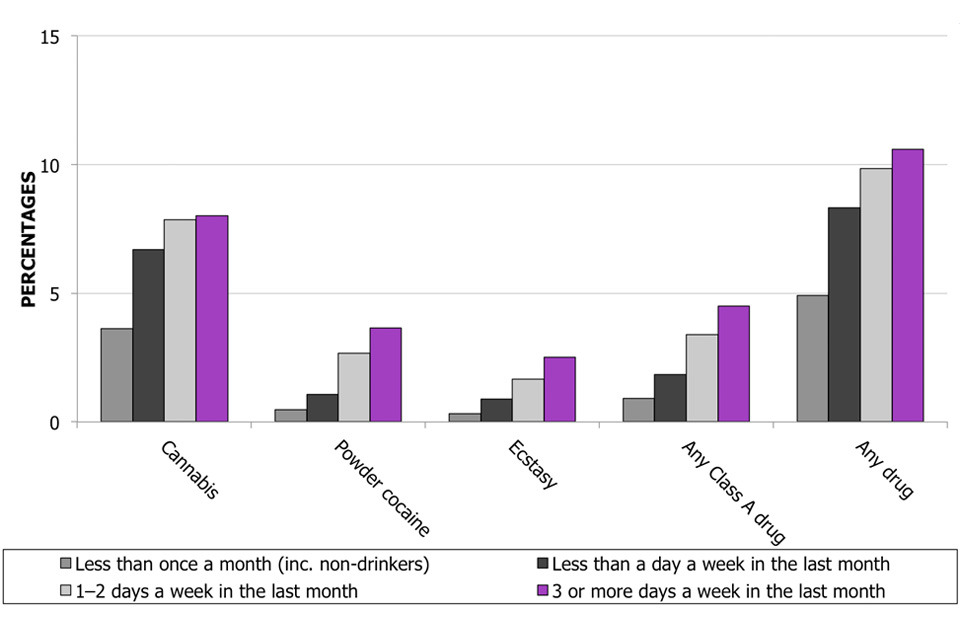
This bar chart shows the proportion of 16 to 59 year olds reporting use of individual drugs in the last year by frequency of alcohol consumption.
Chart notes
Source: Home Office, Illicit drug use by demographics tables: Table D_01.
3.6 Extent and trends in illicit drug use by area factors
In the 2012 to 2013 CSEW, levels of any drug use in the last year varied by area characteristics. For example:
- Use of any drug, any Class A drug and any stimulant drug, was higher among those living in urban areas compared with those living in rural areas. For example, 8.6% of people living in urban areas had used any drug compared with 6.4% of those living in rural areas;
- There was variation in drug use by Output Area Classification. Those living in ‘City Living’ and ‘Constrained by Circumstances’ areas more likely to have used any drug (13.3% and 10.6% respectively) than those living in other types of areas (e.g. 5.4% of those living in ‘Prospering Suburbs’ areas). Use of any Class A drug was higher among those living in ‘City Living’ (5.7%) and ‘Multicultural’ (4.0%) areas compared with other types, such as ‘Countryside’ areas (1.6%).
3.7 Data tables
Estimates of last year illicit drug use by personal, household and area characteristics and lifestyle factors from the 2012 to 2013 CSEW, alongside long-term trends for certain characteristics, can be found in the Illicit drug use by demographics tables.
For information on data quality, how to interpret these figures and other data sources, please see Section 6 and the User Guide.
4. Accessibility of drugs
4.1 Introduction
Findings presented here are from the 2012 to 2013 Crime Survey for England and Wales (CSEW) on the source from which the most recent drugs taken were obtained, the location where they were obtained (i.e. where the drugs were bought by, or given to, the individual) and the location where they were subsequently taken. The analysis is based only on those adults aged 16 to 59 who said they had taken drugs in the 12 months previous to interview. The results in this section will be heavily influenced by use of cannabis, as this was the most prevalent drug used in the last year (see Section 1). It was not possible to carry out separate analysis by drug type.
4.2 Key facts
- Over half (54%) of adults aged 16 to 59 who had taken drugs in the last 12 months said that they had last obtained them from someone well known to them who was not a family member.
- Over half (53%) were in a domestic setting when they last obtained them (e.g. their own home or someone else’s home).
- Almost two-thirds (62%) had been in a domestic setting (i.e. at their home or someone else’s home) the last time they took drugs.
- The proportion of adults taking drugs in their own home increased with age, from 20% of the 16 to 24 age group to 56% of the 45 to 59 age group.
- Generally, adults are more likely to take drugs in the same location as they obtained them. For example, of those who obtained the drugs at home, 88% took the drugs at home as well.
4.3 Source of drugs last taken
As shown in Figure 4.1, of those adults who said they had taken drugs in the last 12 months, over half (54%) said that they had last obtained them from someone well known to them who was not a family member, for example a friend, work colleague or neighbour (this is a fall from 63% in 2011 to 2012). A quarter (25%) obtained their drugs from a dealer (an increase from 16% in 2011 to 2012), while just 4% obtained their drugs from a family member. The remaining proportion (17%) obtained their drugs from other sources such as someone known only by sight or to speak to casually, a stranger, a shop or the internet. For the latter, just 1.2% of adults who used drugs in the last 12 months sourced them from the internet.
Figure 4.1 Source drugs were obtained from the last time they were taken, 2012 to 2013 Crime Survey for England and Wales
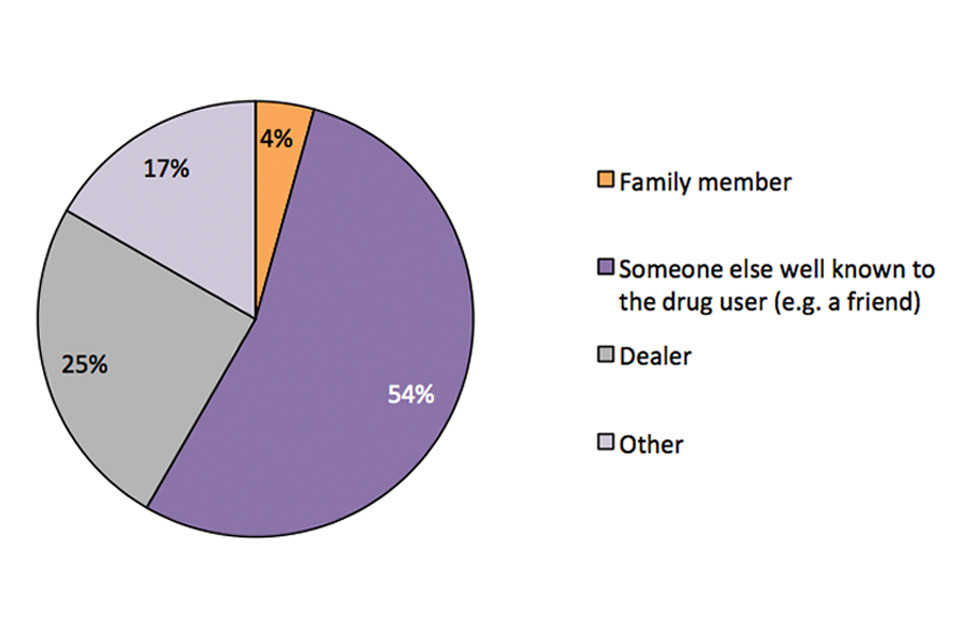
This pie chart shows the source where drugs were obtained the last time they were taken.
Chart notes
Source: Home Office, Accessibility of drugs tables: Table A_01. Percentages may not sum to 100% due to rounding.
However, the proportion obtained from each source varied according to age (Figure 4.2). In particular, the proportion of adults obtaining drugs from a dealer generally decreased as age increased. Conversely, the proportion of adults obtaining drugs from a family member increased as age increased. Despite this, the most popular source of drugs for every age group was someone else well known (e.g. a friend), particularly in the lowest and highest age groups.
Figure 4.2 Source drugs were obtained from the last time they were taken by age, 2012 to 2013 Crime Survey for England and Wales
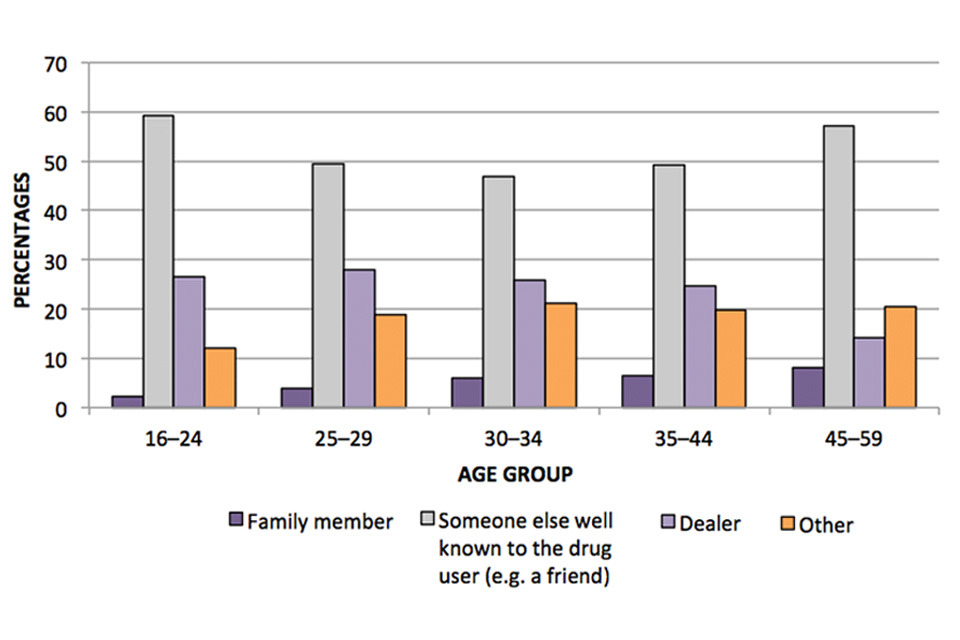
This bar chart shows the source where drugs were obtained the last time they were taken, by age group.
Chart notes
Source: Home Office, Accessibility of drugs tables: Table A_01.
4.4 Location where drugs last taken were obtained
Over half of adults (53%) who had taken drugs in the last year were in a domestic setting when they last obtained them, i.e. either at their own home (16%) or someone else’s home (36%) (see Figure 4.3), similar to the proportion in 2011 to 2012 (58%). The remaining half obtained drugs at other locations in roughly equal proportions, namely at a bar or pub (11%), at a club, party or rave (11%), on the street/in a park/outdoor area (14%) or somewhere else (12%).
Figure 4.3 Location where drugs were obtained the last time they were taken, 2012 to 2013 Crime Survey for England and Wales.
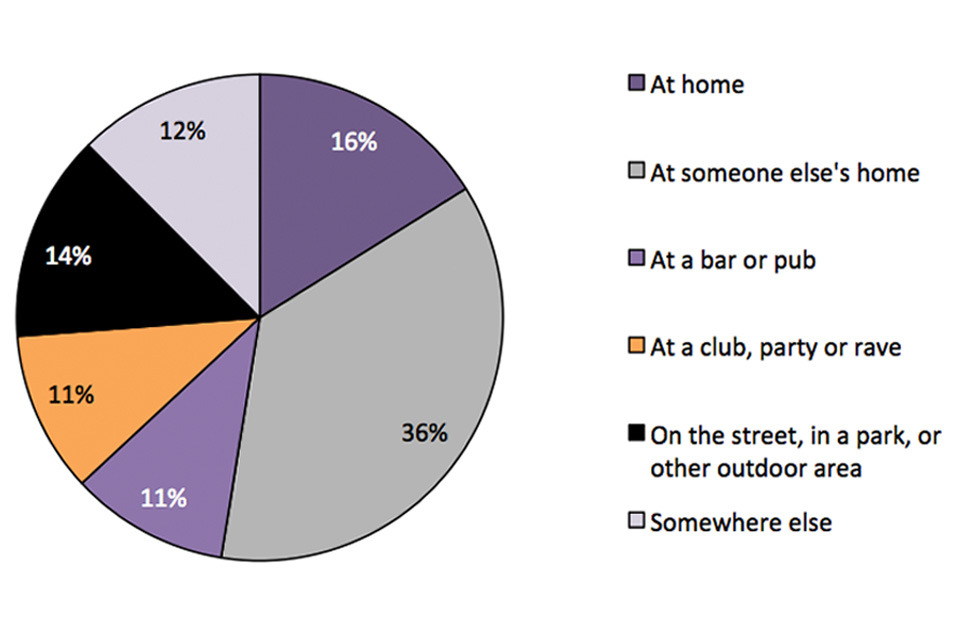
This pie chart shows the location where drugs were obtained the last time they were taken.
Chart notes
Source: Home Office, Accessibility of drugs tables: Table A_02. Percentages may not sum to 100% due to rounding.
4.5 Location where drugs were last taken
Almost two-thirds (62%) of adults who had taken drugs in the last year had been in a domestic setting (i.e. at their home or someone else’s home) the last time they took drugs (Figure 4.4). Around a fifth (21%) took the drugs at a pub, bar, club, party or rave (i.e. typically late night venues), while 7% took them in an outside location (e.g. the street, park or other outdoor area).
Figure 4.4 Location where drugs were last taken, 2012 to 2013 Crime Survey for England and Wales
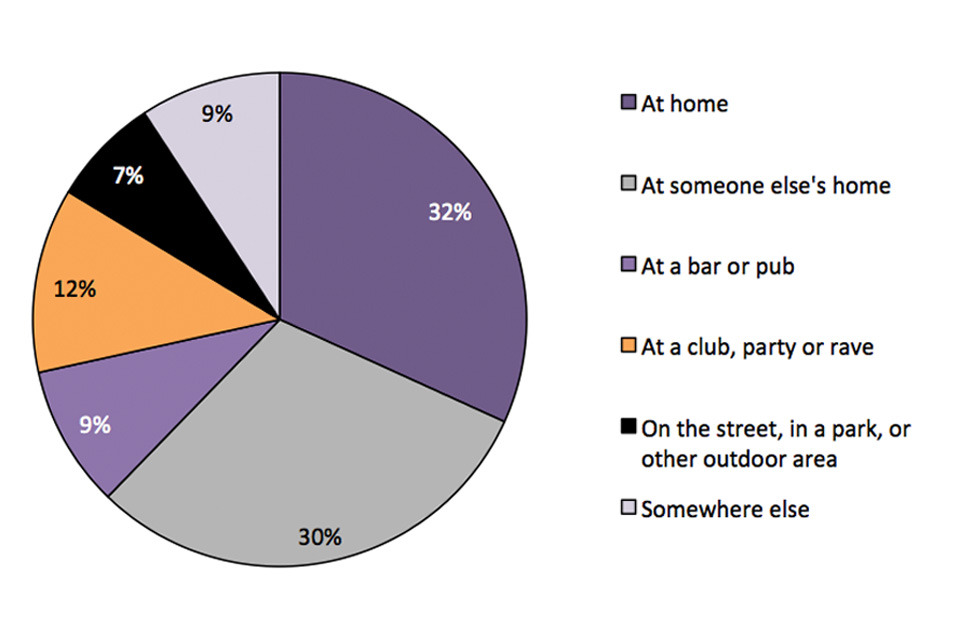
This pie chart shows the location where drugs were last taken.
Chart notes
Source: Home Office, Accessibility of drugs tables: Table A_03. Percentages may not sum to 100% due to rounding.
As shown in Figure 4.5, the proportions attributed to each location differed according to age. For example, the proportion taking drugs at their own home increased with age. Twenty per cent of adults in the youngest age group (i.e. those aged 16 to 24) who had taken drugs in the last 12 months had last taken them in their own home, increasing to 56% for those in the oldest age group (45 to 59). The most common location where drugs were last taken for the age group 16 to 24 was at someone else’s home (38%), contrasting with the oldest age groups (35 to 44 and 45 to 59) where the most common location was their own home.
Figure 4.5 Location where drugs were last taken by age, 2012 to 2013 Crime Survey for England and Wales
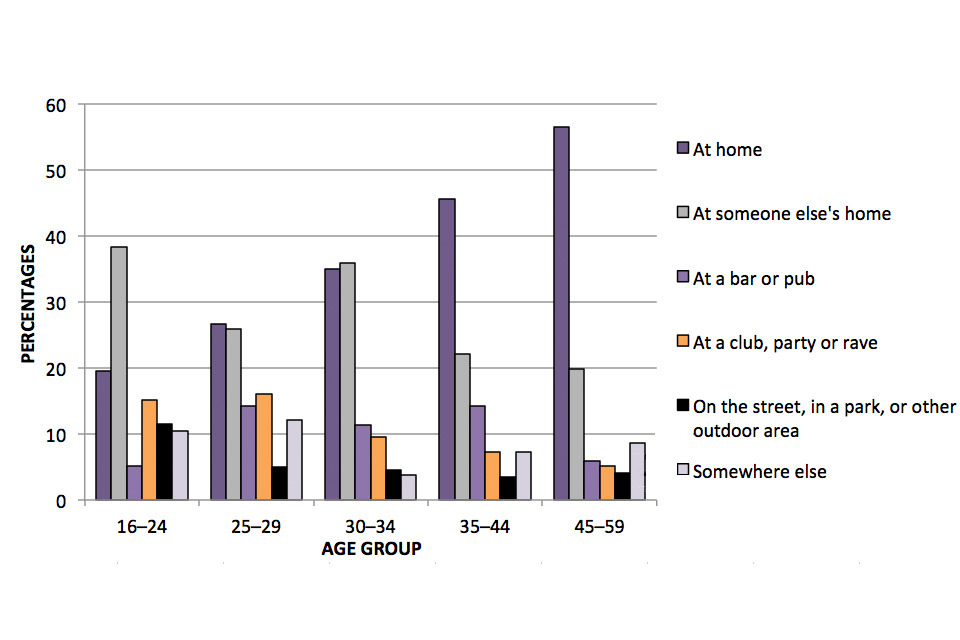
This bar chart shows the location where drugs were last time taken, by age group.
Chart notes
Source: Home Office, Accessibility of drugs tables: Table A_03.
Figure 4.6 shows that, for the most part, adults are more likely to take the drugs in the same location as they obtained them. For example, of those adults who obtained the drugs at home, 88% also took the drugs at home. This is true of most locations with the exception those who obtained their drugs in an outside location. Although 39% of these adults also took the drugs in an outside location, almost a third (32%) took them at home instead and a further 16% took them at someone else’s home.
Figure 4.6 Where drugs were taken by where they were obtained the last time they were taken, 2012 to 2013 Crime Survey for England and Wales
| Percentages | Where obtained | |||||
|---|---|---|---|---|---|---|
| At home | At someone else’s home | At a bar or pub | At a club, party or rave | On the street, in a park or other outdoor area | Somewhere else | |
| Where taken | ||||||
| At home | 88 | 18 | 15 | 0 | 32 | 24 |
| At someone else’s home | 3 | 73 | 8 | 5 | 16 | 6 |
| At a bar or pub | 2 | 2 | 65 | 3 | 4 | 4 |
| At a club, party or rave | 2 | 3 | 9 | 85 | 4 | 4 |
| On the street, in a park or other outdoor area | 3 | 2 | 2 | 3 | 39 | 4 |
| Somewhere else | 2 | 2 | 1 | 3 | 5 | 58 |
| Total | 100 | 100 | 100 | 100 | 100 | 100 |
| Unweighted base | 240 | 444 | 131 | 108 | 135 | 144 |
Table notes
Source: Home Office, Accessibility of drugs tables:Table A_04.
4.6 Data tables
Estimates from the 2012 to 2013 CSEW on the source and location of obtaining drugs and the location of where drugs were taken can be found in the Accessibility of drugs tables.
For information on data quality, how to interpret these figures and other data sources, please see Section 6 and the User Guide
5. Attitudes towards the acceptability and safety of drug-taking
5.1 Introduction
This section examines respondents’ perceptions about the acceptability and safety of using certain drugs and alcohol. Specifically, respondents to the 2012 to 2013 Crime Survey for England and Wales (CSEW, formerly the British Crime Survey) were asked whether they thought that it was acceptable for people of their own age to take cannabis, cocaine, heroin or ecstasy or to get drunk. These questions were previously asked in the 2010 to 2011 questionnaire, with the exception of the question on ecstasy, which was introduced in 2012 to 2013. New questions were also asked about how safe or unsafe the respondent thought that it was to take cannabis, cocaine, heroin or ecstasy or to get drunk.
Key facts
- Around three-quarters (74%) of respondents aged 16 to 59 thought that it was acceptable for people of their own age to get drunk occasionally; only 5% of adults believed that it was acceptable to get drunk frequently.
- Just under one-third (32%) of adults aged 16 to 59 thought that it was acceptable for people of their own age to take cannabis occasionally, while around two-thirds (66%) thought that it was never acceptable.
- Only 7% of adults thought that it was acceptable for people of their own age to take cocaine occasionally; the majority (93%) thought that it was never acceptable. The proportions for ecstasy were similar.
- Less than 0.5% of respondents thought that it was acceptable for people of their own age to frequently take ecstasy, cocaine or heroin.
- Three-quarters (75%) of respondents thought that it was ‘a bit’ or ‘very’ unsafe to get drunk.
- Although 3% of respondents thought that it was very safe to take cannabis, a higher proportion than for any of the other substances, around 8 in 10 respondents (79%) thought that taking cannabis was very (47%) or a bit (32%) unsafe.
- The vast majority of respondents thought that it was ‘a bit’ or ‘very’ unsafe to take heroin, cocaine or ecstasy (99%, 97% and 97% respectively). Almost all (98%) of respondents thought that taking heroin was very unsafe and 86% of respondents thought that taking cocaine or ecstasy was very unsafe.
5.2 Attitudes towards acceptability of drinking and drug-taking
The 2012 to 2013 CSEW asked respondents about their views on the acceptability of people of their own age taking drugs, specifically cannabis, cocaine, heroin and ecstasy, or getting drunk. While around three-quarters (74%) of respondents aged 16 to 59 thought that it was acceptable for people of their own age to get drunk occasionally, the same proportion as in 2010 to 2011, only 5% of adults believed that it was acceptable to get drunk frequently. Only a minority thought that it acceptable to take the drugs asked about either frequently or occasionally (Figure 5.1).
Figure 5.1 Acceptability of people of own age occasionally or frequently getting drunk, taking any cannabis, ecstasy, cocaine or heroin, adults aged 16 to 59, 2012 to 2013 CSEW
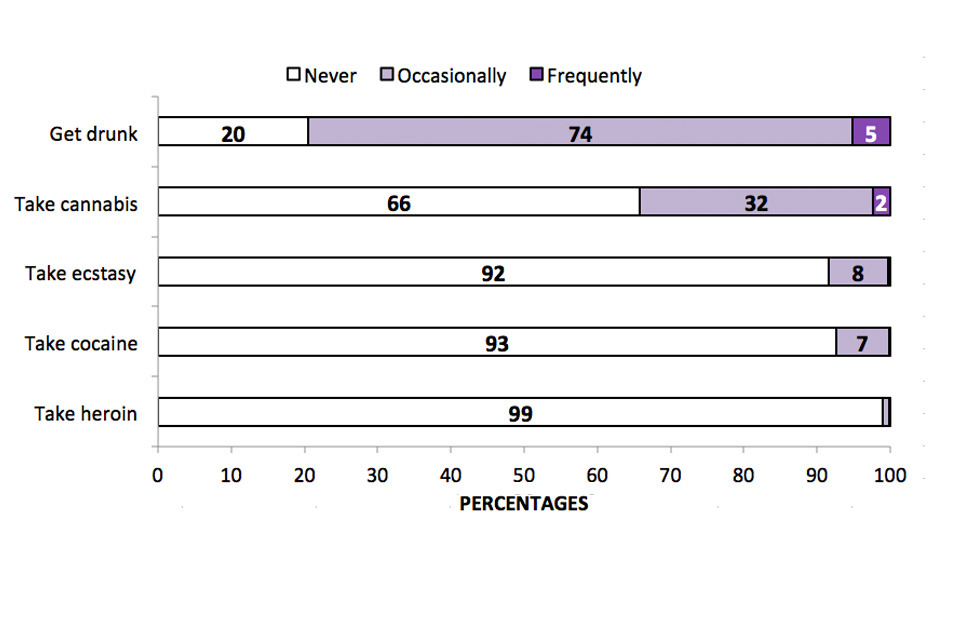
This horizontal bar chart shows the acceptability of people of own age occasionally or frequently getting drunk, taking any cannabis, ecstasy, cocaine or heroin, among adults aged 16 to 59
Chart notes
Source: Home Office, Attitudes towards drug-taking tables: Table Att_01
As expected, respondents had less acceptability towards people of their own age taking cocaine, ecstasy and heroin than cannabis. * Just under one-third (32%) of adults aged 16 to 59 thought that it was acceptable for people of their own age to take cannabis occasionally, while around two-thirds (66%) thought that it was never acceptable. Only 2% thought that it was acceptable to take cannabis frequently. * Around 8% of adults thought that it was acceptable to take ecstasy occasionally; the majority (92%) thought that it was never acceptable. * Around 7% of adults thought that it was acceptable to take cocaine occasionally; the majority (93%) thought that it was never acceptable. * Around 1 in 100 people (1%) thought that it was acceptable to take heroin occasionally, while the vast majority (99%) thought that it was never acceptable. * Less than 0.5% of respondents thought that it was acceptable to frequently take ecstasy, cocaine or heroin.
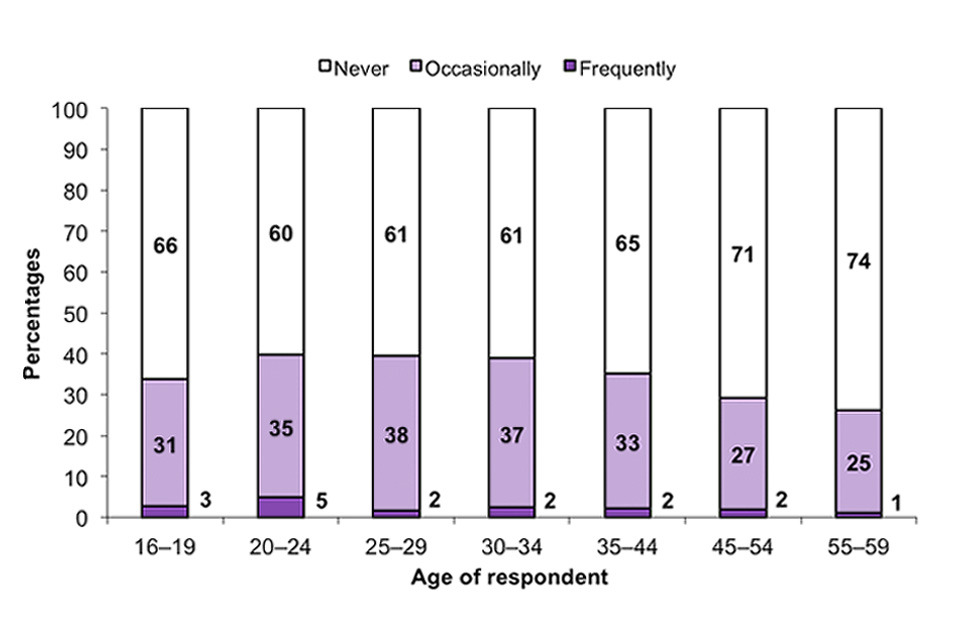
The perceived acceptability of getting drunk and of taking drugs varied by age. Tolerance of getting drunk tended to decrease with age, for example, 11% of those aged 16 to 24 thought that it was acceptable for people of their own age to get drunk frequently, whereas just 2% of those aged 55 to 59 thought that it was acceptable for their age. Conversely, 15% of 16 to 19 year-olds thought that it was never acceptable to get drunk, whereas almost twice this proportion (29%) of 55 to 59 year-olds thought that it was never acceptable.
Older respondents (aged 45 to 59) tended to be less tolerant of taking cannabis than those in younger age groups. For example, around 40% of those aged 20 to 34 thought that it was acceptable for people of their own age to take cannabis (either frequently or occasionally) compared with 26% of those aged 55 to 59. As was the case in 2010 to 2011, in no age group did a majority of people think that it was acceptable for people of their own age to take cannabis either frequently or occasionally (Figure 5.2).
Figure 5.2 Acceptability of people of own age taking any cannabis by age, adults aged 16 to 59, 2012 to 2013 CSEW
This stacked bar chart shows the acceptability of people of own age taking any cannabis, by age group, among adults aged 16 to 59.
Chart notes
Source: Home Office, Attitudes towards drug-taking tables: Table Att_01
The proportion of respondents who believed that it was acceptable to use heroin occasionally or frequently was uniformly low across the range of personal, area and household characteristics (between 0% and 4%). However, attitudes towards the use of cannabis, cocaine and ecstasy varied across different characteristics and factors. * Younger respondents (aged 16 to 19) and older respondents (aged 45 to 59) tended to be less tolerant in their acceptability of people of their own age taking ecstasy and cocaine than those in other age groups. * A greater proportion of men believed that it was acceptable to take cannabis (40%), ecstasy (11%) or cocaine (10%) compared with women (28%, 5% and 5% respectively). * A greater proportion of those who drank alcohol on three or more days a week in the last month believed that it was acceptable to take cannabis, cocaine or ecstasy compared with those who drank alcohol less frequently, or not at all.
A full breakdown of attitudes to the acceptability of cannabis, ecstasy and cocaine and getting drunk by personal, area and household characteristics, and lifestyle factors appears in Attitudes towards drug-taking tables:Tables Att_01 and Att_02.
Acceptability of drug-taking compared with use of these drugs
Comparison of levels of cannabis, ecstasy and cocaine use with perceived acceptability of the use of these drugs shows that more people thought that it was acceptable to take the drugs than had actually taken them in the last year. For example, while around one-third (34%) of adults aged 16 to 59 believed that it was acceptable for people of their own age to take cannabis, only 6% of this age group had done so in the last year. However, the proportion of 16 to 59 year olds who had ever taken cannabis was 30%, which is much closer to the acceptability level.
While around a third (34%) of 16 to 19 year olds thought that it was acceptable for people of their own age to take cannabis frequently or occasionally, a lower proportion (14%) of this age group had actually taken cannabis in the last year. The gap between behaviour and acceptability was widest in the 25 to 44 age groups, as cannabis use in the last year declined with age while perceived acceptability of taking the drug remained highest among the 16 to 44 age groups (Figure 5.3).
Figure 5.3 Acceptance of people of own age taking cannabis (occasionally or frequently) and proportion of respondents having taken cannabis in the last year, by age, 2012 to 2013 CSEW
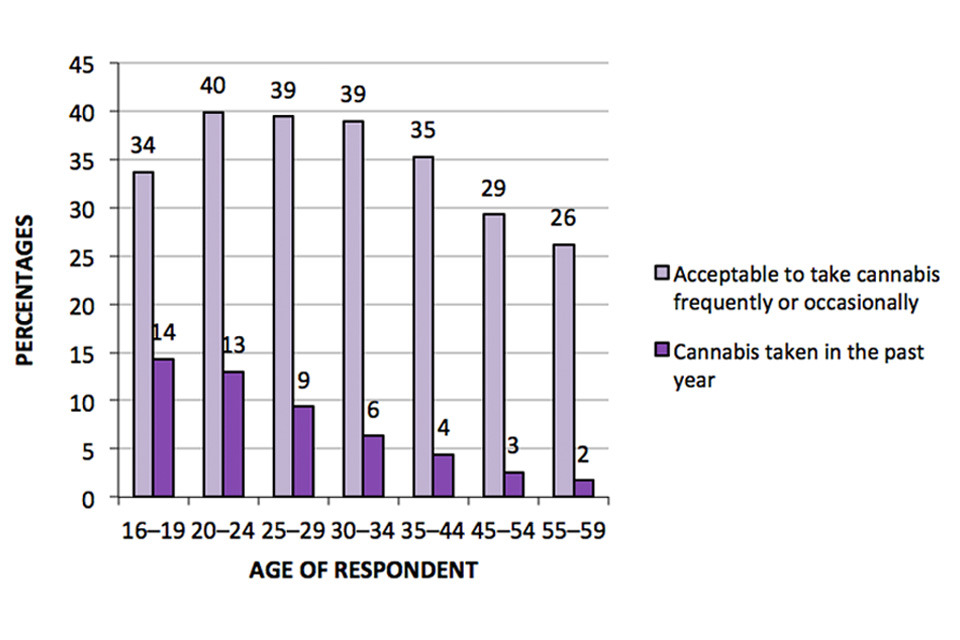
This bar chart shows the acceptability of people of own age occasionally or frequently taking cannabis and proportion of respondents having taken cannabis in last year, by age group.
Chart notes
Source: Home Office, Attitudes towards drug-taking tables: Table Att_01 and Illicit drug use by demographics tables: Table D_03.
The respondents who took cannabis in the last year are not necessarily within the proportion who thought that it was acceptable to take cannabis (Figure 5.4). However, of those respondents who thought that it was acceptable for people of their own age to take cannabis frequently, almost one-half (47%) had taken cannabis in the last year and a further 28% had taken cannabis within their lifetime but not in the past year. Of respondents who thought that it was acceptable for people of their own age to take cannabis occasionally, 15% had taken cannabis in the last year, whereas around one-half (47%) had ever taken cannabis but had not done so in the last year. Perhaps unsurprisingly, of those who thought that it was never acceptable for people of their own age to take cannabis, just 1% had done so in the last year and 11% had taken cannabis in their lifetime but not in the last year.
Overall, the majority of respondents (58%) had never taken cannabis and did not think that it was ever acceptable for people of their own age to take the drug (Figure 5.4)
Figure 5.4 Acceptability of people of own age taking any cannabis by whether taken cannabis, adults aged 16 to 59, 2012 to 2013 CSEW
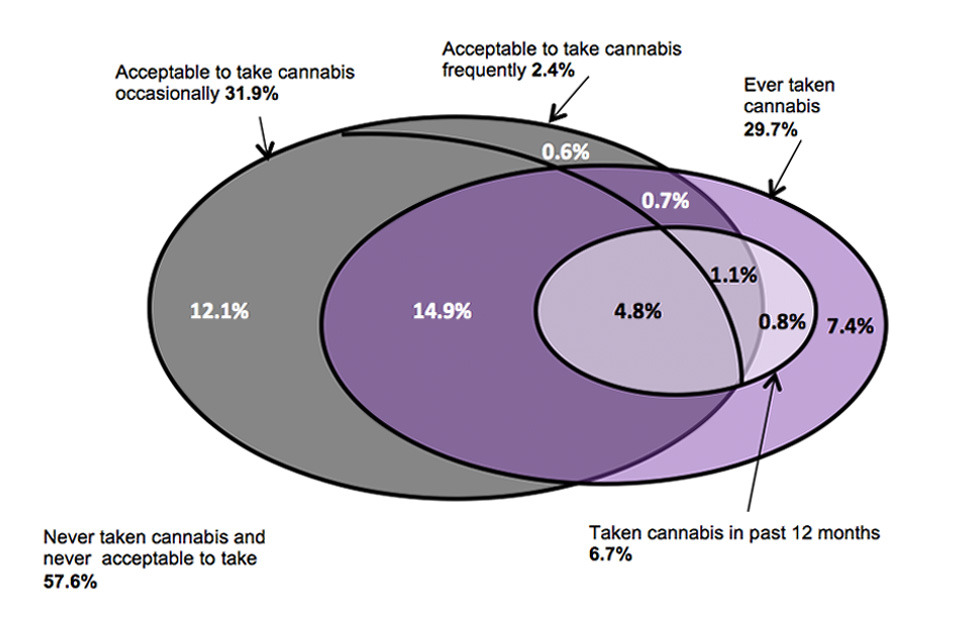
This venn diagram shows the acceptability of people of own age taking cannabis by whether taken cannabis for adults aged 16 to 59.
Chart notes
Base: All adults aged 16 to 59 Due to rounding, individual figures may not sum to totals. Note: Not to scale
There was less acceptability of taking cocaine and the prevalence of taking the drug was lower. However, unlike for cannabis the age distribution of respondents who had taken powder cocaine within the last 12 months was similar to the age distribution of respondents who believed that it was acceptable for people of their own age to take cocaine (Figure 5.5).
Figure 5.5 Acceptance of people of own age taking cocaine (occasionally or frequently) and proportion of respondents having taken powder cocaine in the last year, by age, 2012 to 2013 CSEW
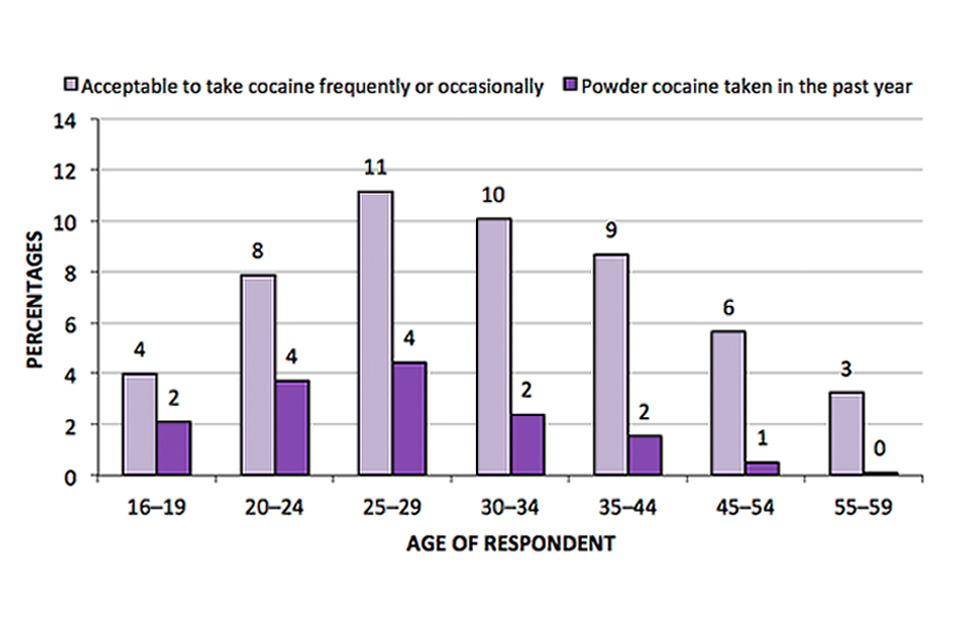
This bar chart shows the acceptability of people of own age occasionally or frequently taking cocaine and proportion of respondents having taken powder cocaine in last year, by age group
Chart notes
Source: Home Office, Attitudes towards drug-taking tables: Table Att_01 and Illicit drug use by demographics tables: Table D_03.
Most age groups had a similar level of acceptance of people of their own age taking cocaine to taking ecstasy. As for cannabis, for both ecstasy and cocaine the gap between drug-taking and perceived acceptability was widest in the 25 to 44 age groups. Levels of perceived acceptability for both ecstasy and cocaine were highest in the 20 to 44 age groups.
Interestingly, although a greater proportion of adults aged 16 to 59 thought that it was acceptable for people of their own age to take ecstasy (8%) than thought that it was acceptable to take cocaine (7%), more respondents had taken powder cocaine in the previous 12 months than had taken ecstasy (2% and 1% respectively).
Unsurprisingly, those respondents who had taken drugs in the last year thought that it was more acceptable for people of their own age to take drugs occasionally or frequently than the overall sample population.
- The majority (88%) of respondents who reported using cannabis in the last year thought that it was acceptable to take cannabis either occasionally (72%) or frequently (17%).
- Around three-quarters (74%) of respondents who had taken ecstasy in the last year thought that it was acceptable to take this drug occasionally (73%) or frequently (1%).
- Almost two-thirds (63%) of respondents who had taken any powder cocaine in the last year thought that it was acceptable to take cocaine occasionally. However less than 0.5% of these respondents thought that it was acceptable to take frequently.
Among respondents who had taken ecstasy or powder cocaine in their lifetime but not in the last year, over one-half thought that it was never acceptable for people of their own age to take these drugs (54% who had taken ecstasy thought that it was never acceptable to take ecstasy; 61% who had taken powder cocaine in their lifetime but not in the previous 12 months thought that it was never acceptable to take powder cocaine).
Among respondents who had taken ecstasy or powder cocaine in the last 12 months, the proportion who thought that it was acceptable for people of their own age to take these drugs frequently was much lower than the proportion that who thought that it was acceptable to take cannabis frequently (18% of ecstasy users and 13% of powder cocaine users thought that it was acceptable for people of their own age to take cannabis frequently).
A breakdown of perceived acceptability of taking cannabis, cocaine and ecstasy by drug-taking behaviour is available in Attitudes towards drug-taking tables Tables Att_05.
5.3 Attitudes towards safety of drinking and drug-taking
New questions were added to the 2012 to 2013 CSEW questionnaire asking respondents about their views on the safety of taking drugs, specifically cannabis, cocaine, ecstasy and heroin, and of getting drunk.
As shown in Figure 5.6, the majority of respondents thought that all of these types of behaviour were unsafe (either very or a bit unsafe). Three-quarters (75%) of respondents thought that it was unsafe to get drunk, although more than twice as many (53%) thought that it was a bit unsafe rather than very unsafe (22%).
While, overall, getting drunk was considered ‘safer’ (very or fairly safe) than drug-taking, 3% of respondents thought that it was very safe to take cannabis, a higher proportion than for any of the other substances including alcohol. Nevertheless, around 8 in 10 respondents (79%) thought that taking cannabis was unsafe. Just under one-half of respondents (47%) thought that taking cannabis was very unsafe, and around one-third (32%) thought that it was a bit unsafe. Around 1 in 5 respondents thought that taking cannabis was fairly safe (18%).
The other drugs were viewed as less safe than cannabis. The vast majority of respondents thought that it was unsafe to take heroin, cocaine or ecstasy (99%, 97% and 97% respectively). For ecstasy and cocaine, the proportions were very similar with 86% of respondents thinking that each of these drugs was very unsafe and 11% thinking that they were a bit unsafe. Almost all (98%) of respondents thought that taking heroin was very unsafe.
Figure 5.6 Perceived safety of getting drunk, taking any cannabis, ecstasy, cocaine or heroin, adults aged 16 to 59, 2012 to 2013 CSEW
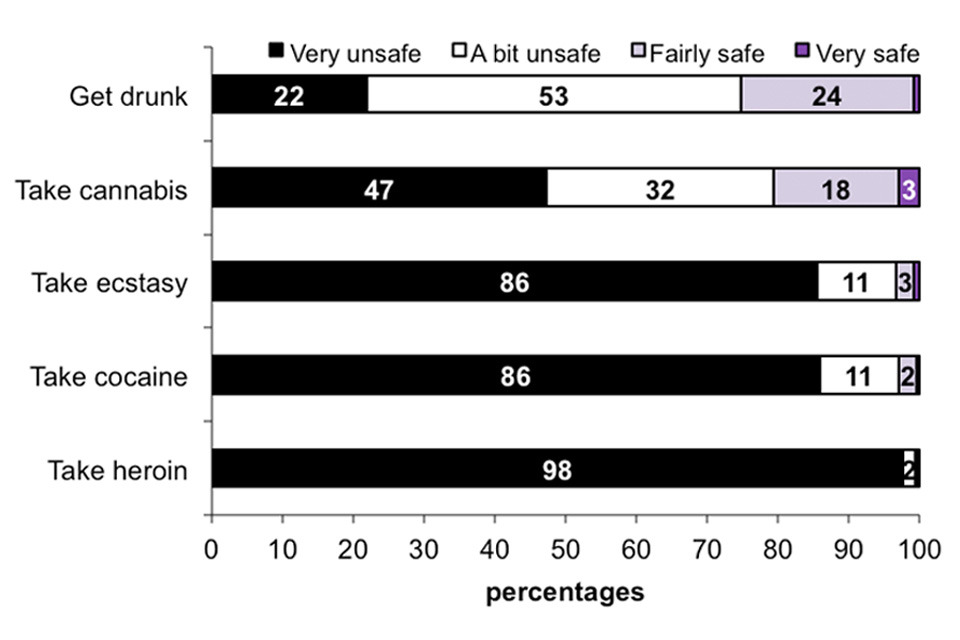
This horizontal bar chart shows the perceived safety of getting drunk, taking any cannabis, ecstasy, cocaine or heroin.
Chart notes
Source: Home Office, Attitudes towards drug-taking tables: Table Att_03.
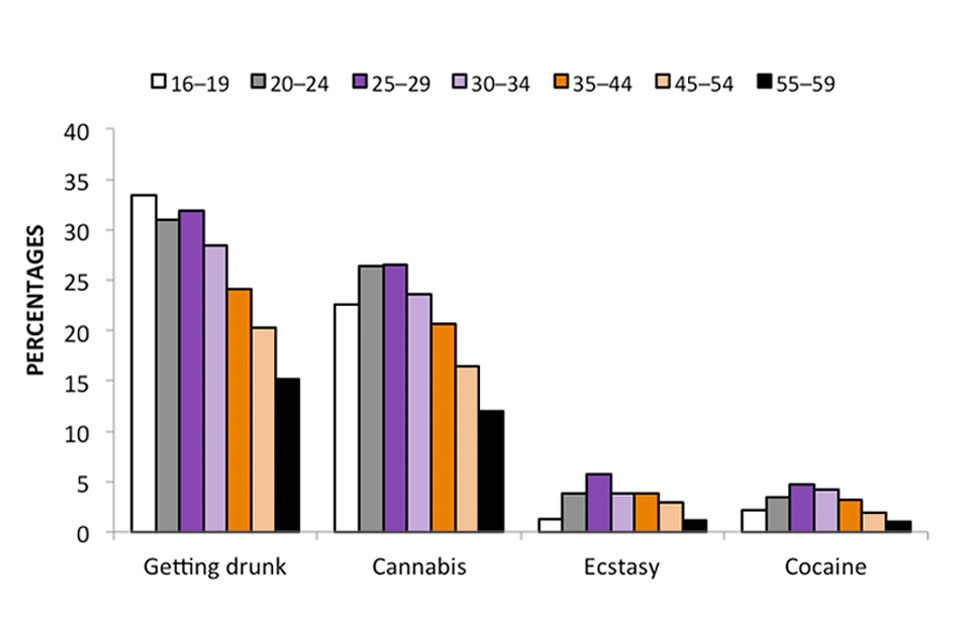
Similarly to the acceptability of getting drunk, the perceived level of safety of getting drunk tended to decrease with age (Figure 5.7). While 1% of each age group thought that getting drunk was very safe, the proportion of respondents aged 55 to 59 who thought that getting drunk was fairly safe (15%) was around half as large as in the 16 to 34 age groups (between 27% and 32%).
Figure 5.7 Proportion of age group perceiving getting drunk, taking cannabis, ecstasy or cocaine to be very or fairly safe, by age, adults aged 16 to 59, 2012 to 2013 CSEW
This bar chart shows the proportion of adults perceiving getting drunk, taking any cannabis, ecstasy, cocaine to be very or fairly safe, by age group
Chart notes
Source: Home Office, Attitudes towards drug-taking tables: Table Att_03.
Additionally, while around one-half of each age group (between 47% and 56%) thought that getting drunk was a bit unsafe, the proportion who thought that it was very unsafe to get drunk increased from 15% of 16 to 19 year-olds and 19% of 20 to 24 year-olds to 29% of 55 to 59 year-olds.
Similarly, the proportion of respondents perceiving taking cannabis to be very or fairly safe also tended to decrease with age, with the proportions being largest in the 16 to 34 age groups (between 23% and 26%) before decreasing to 12% in the 55 to 59 age group.
Younger respondents (aged 16 to 19) and older respondents (aged 55 to 59) tended to perceive taking ecstasy or cocaine as less safe than those in other age groups (Figure 5.7).
The proportion of respondents who believed that it was a bit or very unsafe to use heroin was uniformly high across the range of personal, area and household characteristics (in fact between 95% and 99% of each group believed that this drug was very unsafe). However, attitudes towards the safety of cannabis, cocaine and ecstasy varied across different characteristics and factors.
- Around one-quarter (27%) of men believed that it was very safe or fairly safe to take cannabis, compared with around half this proportion of women (15%). Additionally, more than half (55%) of women thought that it was very unsafe to take cannabis, compared with 40% of men.
- The gender gap was smaller for ecstasy and cocaine, with 95% of men and 99% of women believing that taking either of these drugs was a bit or very unsafe. Nine out of ten (91%) women thought that it was very unsafe to take ecstasy or cocaine whereas eight out of ten men thought these drugs were very unsafe, (80% for ecstasy, 81% for cocaine). A full breakdown of attitudes to the safety of cannabis, ecstasy, cocaine and heroin use and getting drunk by personal, area and household characteristics and lifestyle factors appears in Attitudes towards drug-taking tables Tables Att_03 & Att_04.
Safety of drug-taking compared with use of these drugs in the last year
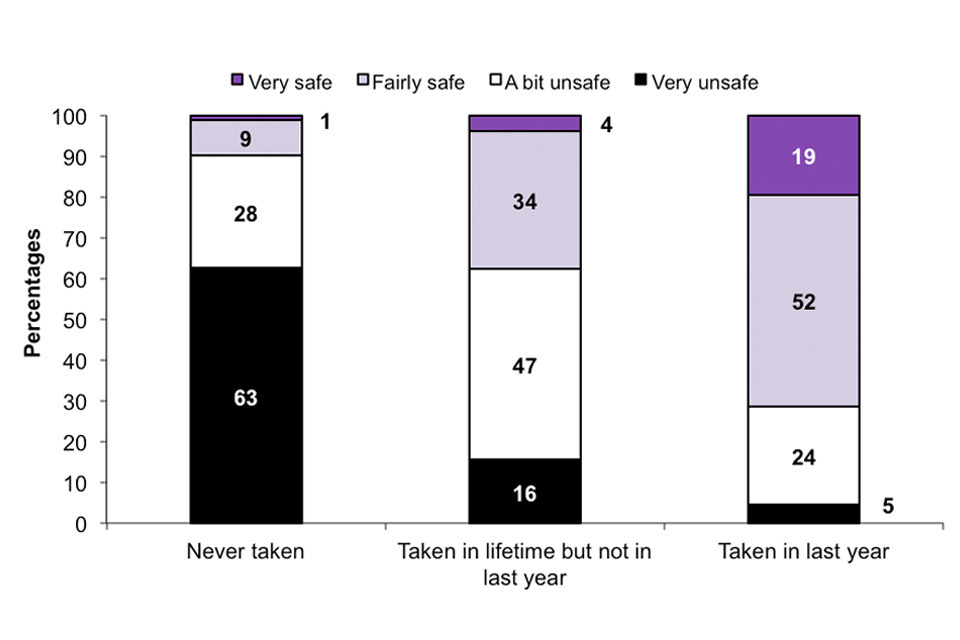
Unsurprisingly, those respondents who had taken drugs in the last year thought that it safer to take drugs than the overall sample population. Around 7 in 10 (71% of) respondents who reported using cannabis in the last year thought that it was very (19%) or fairly (52%) safe to take cannabis (Figure 5.8). However, of the respondents who had taken cannabis in their lifetime but not in the past year, around one-half of this proportion (37%) thought that it was very (4%) or fairly (34%) safe to take cannabis. The figures were much lower for respondents who had never taken cannabis; just 1 in 10 (10%) thought that taking cannabis was very (1%) or fairly (9%) safe. Around 6 in 10 (63% of) respondents who had never taken cannabis perceived this behaviour as very unsafe compared with just 5% of those who had taken cannabis in the last year.
Figure 5.8 Perceived safety of taking any cannabis by whether taken cannabis (ever or in last 12 months), adults aged 16 to 59, 2012 to 2013 CSEW
This stacked bar chart shows the perceived safety of taking any cannabis by whether taken cannabis (ever or in last 12 months)
Chart notes
Source: Home Office, Attitudes towards drug-taking tables: Table Att_06.
The following are findings regarding the use of ecstasy and cocaine.
- Around two-fifths (38%) of respondents who had taken ecstasy in the last year thought that ecstasy was very (12%) or fairly (25%) safe to take. Of respondents who had taken ecstasy in their lifetime but not in the last year, a much lower proportion (18%) thought that it was very (1%) or fairly (16%) safe. The corresponding figures for respondents who had never taken ecstasy were 1% (very safe) and 1% (fairly safe).
- Just under one-fifth (18%) of those who had used ecstasy in the last year thought that taking ecstasy was very unsafe, compared with 46% of those who had used ecstasy but not in the last year and 90% of those who had never taken ecstasy.
- Around one-third (32%) of respondents who had taken any powder cocaine in the last year thought that cocaine was very (4%) or fairly (29%) safe to take. For respondents who had taken powder cocaine but not in the last year, 13% thought that it was very (1%) or fairly (12%) safe to take. The corresponding figures for those who had never taken cocaine were less than 0.5% (very safe) and 1% (fairly safe).
- One-fifth (20%) of those who reported using powder cocaine in the last year thought that taking cocaine was very unsafe compared with 47% of those who had used powder cocaine but not in the last year, and 90% of those who had never taken cocaine.
5.4 Data tables
Estimates of respondents’ perceptions about the acceptability and safety of using certain drugs and alcohol from the 2012 to 2013 CSEW can be found in the Attitudes towards drug-taking tables
For information on data quality, how to interpret these figures and other data sources, please see Section 6 and the User Guide.
6. Data quality, interpreting the figures and other data sources
6.1 Data quality and interpreting the figures
The Crime Survey for England and Wales (CSEW) provides estimates of illicit drug use among adults aged 16 to 59 within the general household population of England and Wales. As such, the CSEW provides an effective measure of the more commonly used drugs for which the majority of users are contained within this population. As a household survey, the CSEW does not cover groups such as the homeless, or those living in institutions such as prisons, who have potentially high rates of drug use, and problematic drug users who are unable to take part in an interview.
Figures presented from the CSEW are only for adults aged between 16 and 59 as this is the age range of the self-completion module of the CSEW where necessarily these sensitive questions on illicit drug use are asked.
The 2012 to 2013 survey provides estimates of illicit drug use among adults over two time periods: ever in their lifetime and in the last year. Information on both measures is provided for the extent of drug use and is contained in the tables for this section. However, the discussion on trends is based on last year use, which is deemed the most reliable measure of recent drug use.
Only increases or decreases between years that are statistically significant at the 5% level (and are therefore likely to be real) are described as changes within the text; in the tables these changes are identified by asterisks (see the User Guide for more information).
Mephedrone
A question on mephedrone use in the last year was added to the 2010 to 2011 CSEW to gather information about the extent of its use in the general population. Legislation was passed on 16 April 2010 under the Misuse of Drugs Act 1971 to control mephedrone as a Class B substance.
From 2012 to 2013, mephedrone has been included in an overall ‘Any drug (inc. mephedrone)’ use measure, for the years 2010 to 2011 to 2012 to 2013. This measure has been presented alongside the existing ‘Any drug’ measure, to allow for comparability over a longer time period.
Frequent drug use
In the context of this release, frequent drug use is defined as using the same illicit drug more than once a month on average during the last year.
Questions on frequency of use in the last year have been asked of 16 to 24 year olds since the 2002 to 2003 CSEW and were first completed by all adults aged 16 to 59 in 2009 to 2010. These questions were rotated out of the 2010 to 2011 questionnaire and added in again to the 2012 to 2013 CSEW.
Personal, household and area characteristics
The CSEW collects a rich set of information on the personal, household and area characteristics as well as lifestyle factors of adults that are used to explore differences in illicit drug use. While these discrete relationships provide useful information, it should be noted that these factors often interact and caution should be taken when drawing conclusions; for example, marital status is strongly age-related and different ethnic groups have different age profiles (e.g. Mixed ethnic groups tend to have younger age profiles than White ethnic groups).
It is also worth noting that where sub-group sizes are small quite large apparent differences between groups may not be statistically significant.
Location and source of drugs
Since the 2010 to 2011 CSEW, adults who had used any illicit drug in the last year were then asked more detailed questions about the location and source of obtaining drugs the last time they had taken drugs. New questions were added in 2011 to 2012 to ask drug-taking adults how easy they found it to obtain illegal drugs and for non-drug-taking adults, how easy they thought it would be. These questions were removed in 2012 to 2013 and replaced with questions on where adults who had taken drugs in the last year were when they last took them.
6.2 Other data sources
National and regional estimates of the prevalence of opiate and/or crack cocaine use are published by the National Treatment Agency (now Public Health England).
Public Health England (PHE) publishes information annually on the age, sex and ethnicity of clients aged 18 years and over in drug treatment contact in England in its annual report Statistics from the National Drug Treatment Monitoring System (NDTMS)
Statistics on Drug Misuse: England, 2012 are published by the Health and Social Care Information Centre.
Due to small sample sizes, limited analysis by ethnicity is provided in section 3 and breakdowns by self-reported sexual orientation are not possible. More robust analysis of illicit drug use by ethnicity and sexual orientation using a combined three-year dataset can be found in Drug Misuse Declared: Findings from the 2009 to 2010 British Crime Survey
Multivariate analysis showing the likelihood of last year drug use according to different characteristics and lifestyle factors can be found in Drug Misuse Declared: Findings from the 2009 to 2010 British Crime Survey
6.3 Conventions used in figures and tables
Table abbreviations
‘0’ indicates no response in that particular category or less than 0.5 per cent (this does not apply when percentages are presented to one decimal point).
‘n/a’ indicates that the question was not applicable or not asked in that particular year.
‘-’ indicates that data are not reported because the unweighted base is fewer than 50.
‘**’ indicates that the change is statistically significant at the five per cent level. Where a change over time is not statistically significant this is noted in the text.
Unweighted base
All percentages and rates presented in the tables are based on data weighted to compensate for differential non response. Tables show the unweighted base which represents the number of people interviewed in the specified group.
Percentages
Row or column percentages may not add to 100 per cent due to rounding.
Most tables present cell percentages where the figures refer to the percentage of adults for which the attribute being discussed applies. The complementary percentage, to add to 100%, is not shown.
A percentage may be quoted in the text for a single category that is identifiable in the tables only by summing two or more component percentages. In order to avoid rounding errors, the percentage has been recalculated for the single category and therefore may differ by one percentage point from the sum of the percentages derived from the tables.
‘No answers’ (missing values)
All analysis excludes don’t know/refusals unless otherwise specified.