Diversity of the judiciary: Legal professions, new appointments and current post-holders - 2026 Statistics
Published 9 July 2026
Applies to England and Wales

© Crown copyright 2026
This publication is licensed under the terms of the Open Government Licence v3.0 except where otherwise stated. To view this licence, visit nationalarchives.gov.uk/doc/open-government-licence/version/3 or write to the Information Policy Team, The National Archives, Kew, London TW9 4DU, or email: psi@nationalarchives.gov.uk.
Where we have identified any third party copyright information you will need to obtain permission from the copyright holders concerned.
This publication is available at https://www.gov.uk/government/statistics/diversity-of-the-judiciary-2026-statistics/diversity-of-the-judiciary-legal-professions-new-appointments-and-current-post-holders-2026-statistics
1. Main Points
1.1 Sex
| The female population is generally well represented in the legal professions and judiciary. | 42% of barristers, 54% of solicitors, 78% of Chartered Legal Executives, and 45% of all judges were female. These maintain their steady upward trends. | |
| There was no disparity of outcomes between female and male candidates in their selection to judicial posts. | Female candidates represented 50% of the eligible pool and 55% of recommendations in legal judicial selection exercises in 2025-26. |
1.2 Ethnicity
| There has been a gradual increase in the representation of ethnic minorities in the legal professions and judiciary. | Since 2016, the ethnic minority proportion of barristers increased from 14% to 17%, of solicitors from 16% to 20%, of Chartered Legal Executives from 6% to 12%. For all judges the proportion increased from 6% to 13%. | |
| There was no disparity of outcomes between White and ethnic minority candidates in legal judicial selection exercises. | Across all legal exercises in 2025-26, ethnic minority candidates accounted for 16% of the eligible pool and 18% of recommendations. |
1.3 Professional background
| There was a disparity of outcomes for solicitors in legal judicial selection exercises compared to barristers. | For all legal exercises in 2025-26, solicitors (44%) made up more applicants than barristers (37%) - but constituted a smaller percentage of the recommendations (31% compared to 46%). | |
| Tribunal judges are twice as likely to have a non-barrister background than court judges | Overall, 30% of court judges and 60% of tribunal judges were from non-barrister backgrounds (mostly solicitors). |
1.4 Judges sitting in retirement
| In comparison to judges, a lower proportion of judges sitting in retirement are female or from an ethnic minority background, but a higher proportion have a non-barrister background. | A third (33%) of all judges sitting in retirement are female. Ethnic minorities made up about 8%. Non-barristers made up over half (53%) of judges sitting in retirement, compared to 40% for all current judges. |
1.5 Non-legal Members of Tribunals
| Compared with judges, a higher proportion of non-legal members are female, or from an ethnic minority background. | Of all non-legal tribunal members, over a half (59%) were female and those with an ethnic minority background constituted 18%, compared to 44% and 13% for all judges respectively. |
1.6 Magistrates
| The proportion of the magistracy who are female is higher than in the judiciary, whilst the proportions from an ethnic minority background are similar. | Over half (57%) of all magistrates were female. Ethnic minorities made up 14%. | |
| The proportion of ethnic minority individuals appointed to the magistracy was higher than the proportion who left. | Over 1,650 appointments were made to become a magistrate in 2025-26, of which 17% were from an ethnic minority background. In the same period, about 1,000 magistrates left, of which 9% were from an ethnic minority background |
2. Statistician’s Comment
Female representation remains positive and in line with the general population across the judicial career path from the legal professions who make up the eligible candidate pool, through the judicial appointments process, to the current judges in post.
The ethnic minority representation of the legal professions is increasing and is in line with the working age (25-74) population. Representation within the judiciary is also increasing, although there were comparatively smaller increases for certain groups such as those from a Black background. The overall judiciary proportion is lower than the 25-74 working age population but slightly higher than the 50-74 population, using data from the 2021 Census.
For both the latest year and over a three-year period, there is no evidence of disparity in the judicial appointments process from eligible pool to recommendation between the combined group of ethnic minorities and White candidates in legal exercises.
New information for this year shows that, of those who declared, eight percent of barristers, three percent of Chartered Legal Executives, and seven percent of judges were LGB+; and that 66% of those judges who had declared, had attended a UK state school.
Amongst magistrates in post a higher proportion are female compared to judges, but a similar proportion are from an ethnic minority background. There was a large increase in the number of applications and new appointments made to the magistracy in 2025/26 compared to the previous year. The proportion of those newly appointed who were from an ethnic minority was nearly double that for those who left the magistracy in the same year.
3. Things you need to know
This report brings together diversity data on the legal professions, judicial appointments, sitting judges, other post holders and magistrates in England and Wales.
The accompanying User guide contains extensive information about these statistics - on their background, sources and coverage. It also includes a detailed description and explanation of terms used in the analysis of the data from the judicial selection exercises - such as ‘recommendation rate’, ‘relative rate index (RRI)’, ‘practical significance’, ‘statistical significance’ and ‘eligible pool’. We therefore strongly suggest the user guide is read alongside this report, particularly by anyone who is new to these statistics.
In addition to the User Guide, downloadable tables have been published alongside this bulletin which contain more detailed information, and these are referenced as ‘Tables’ throughout this report.
For this edition covering 2025-26, data on religion and sexual orientation has been published for some data providers, where possible, for the first time.
The interactive Microsoft Power BI dashboard published alongside this report has now been expanded to include data on judicial appointments and judges sitting in retirement.
Two annexes have been published alongside this year’s report relating to magistrates recruitment. The first (Annex A) provides analysis of candidate drop-out rates during the magistrate appointment process, by diversity characteristic [footnote 1]. The second (Annex B) gives notice of a new quarterly report on the number of magistrate appointments, beginning with April-June 2026-27.
To provide general feedback on the tool and related content of this publication, please contact us at judicial.statistics@justice.gov.uk.
4. Overview of the legal professions, selection exercises and judiciary
4.1 Legal professions
The legal professions form the pool from which the candidates who wish to become judges can apply. Table 1.1 provides information about the sex, ethnicity and age of these professionals by experience and seniority. As at 1 April 2026, there were 18,287 barristers, 179,815 solicitors (including those who are exempt from holding a practising certificate by virtue of section 88 of the Solicitors Act 1974) and 9,053 Chartered Legal Executives[footnote 2].
The varying size of the professions should be kept in mind when interpreting the figures presented throughout this publication relating to the percentage of those in different professions with various characteristics (typically there will be more solicitors than barristers or Chartered Legal Executives).
4.2 Judicial Appointments: Applications and Selections
Table 2.1 contains a full list of the exercises completed by the JAC between 1 April 2025 and 31 March 2026, and a detailed breakdown of the number of applications and appointments for each type of exercise. During 2025-26 the Judicial Appointments Commission (JAC) completed 34 judicial selection exercises (excluding senior judicial appointments), 26 for legal posts and 8 non-legal tribunal exercises. There were a total of 5,802 applications[footnote 3], resulting in 803 recommendations for immediate appointment[footnote 4].
Where two or more applicants are assessed as being of equal merit, the JAC can select an applicant for the purpose of increasing judicial diversity using the Equal Merit Provision (EMP) introduced by the Crime and Courts Act 2013[footnote 5]. EMP can be applied at both the shortlisting and final decision-making stages. For exercises reporting in the 2025-26 period, as a result of applying EMP, 54 candidates were advanced to the next stage of the process at the shortlisting stage, and 14 candidates were recommended at the final decision-making stage[footnote 6].
Levels of experience among applicants
Judicial selection exercises have a minimum statutory level of post qualification experience (PQE). However, the actual levels of applicants’ PQE are often greater than these minimum requirements. For 2025-26, of all applicants for court and tribunal positions requiring at least 5 years’ post-qualification experience, applicants had around 19 years’ experience on average. Of those who applied for positions requiring at least 7 years’ experience, applicants had around 21 years’ experience on average. More specifically:
- Court positions requiring 5 years’ PQE: the average PQE of applicants was around 18 years
- Court positions requiring 7 years’ PQE: the average PQE of applicants was 21 years
- Tribunal positions requiring 5 years’ PQE: the average PQE of applicants was around 19 years
- Tribunal positions requiring 7 years’ PQE: the average PQE of applicants was 21 years
Therefore, where information on the eligible pool for the legal professions is presented in the following chapters, these actual averages are used to allow a more meaningful comparison.
Comparison with previous years
This publication presents data for selection exercises which concluded during 2025-26 and does not draw overall comparisons with previous years. Historical comparisons can be affected by the number and type of exercises run in any given year, which can vary according to recruitment needs, and by when exercises are formally closed (before or after the report’s cut-off date of 1 April each year). However, in certain exercises where data is consistently available across the years, summary statistics on recommendations for appointment have been presented in the accompanying interactive dashboard.
4.3 Judicial office holders
Table 3.1 shows that as at 1 April 2026, by primary appointment, there were 3,497 court judges and 1,840 tribunal judges, with an additional 3,139 non-legal members of tribunals.
Court and tribunal judge numbers fluctuate over time and there is little pattern in changes from one year to the next. Despite these fluctuations, compared to 2012 (the earliest year with data available on both courts and tribunals), the number of court judges (3,575 in 2012) and tribunal judges (2,060 in 2012) both show a slight decrease in 2026.
Turnover in the judiciary tends to be relatively low, with 263 judges beginning their first appointment in 2025-26 - 124 (47%) in courts and 139 (53%) in tribunals, with 234 leaving in the same period - 148 (63%) court and 86 (37%) tribunal judges.
As at 1 April 2026 there were 249 judges sitting in retirement in England and Wales.
4.4 Magistrates
There were 15,259 magistrates in post across England and Wales as at 1 April 2026, up 4% from the previous year (14,636).
Of the 8,899 applications to join the magistracy which concluded in 2025-26, 1,657 resulted in an appointment.
5. Sex
5.1 Legal Professions
Overall the female population is generally well represented in the legal professions, with each of the professions showing a gradual increase in female representation over the past decade.
Of the three professions, female barristers and solicitors are less likely to be at a senior level (having 15 or more years PQE) than their male colleagues, but male and female Chartered Legal Executives have a similar likelihood to be at a senior level.
Although the female population is generally well represented in the legal professions as a whole, as at 1 April 2026 the female proportion varied between the legal professions - from 42% of barristers, 54% of solicitors, to 78% of Chartered Legal Executives.
Table 1.2 shows that the female proportion in each of the three legal profession groups has gradually increased since 2016, with barristers increasing by six percentage points, solicitors increasing by five percentage points, and Chartered Legal Executives increasing by four percentage points over the last decade.
Post Qualification Experience and seniority[footnote 7]
There is no ideal measure of ‘seniority’ in the professions. Although PQE represents a measure of experience rather than indicating inherent seniority, as introduced in last year’s report, having 15 or more years PQE has been used as a proxy measure of being at a senior level in the legal professions. As barristers appointed to the senior judiciary are often Kings Counsel (KC) this is also still used as a proxy measure for seniority in this report.
Table 1.1 shows that as at 1 April 2026:
-
Nearly two-thirds (63%) of male barristers had 15+ years’ experience compared to half (49%) of their female colleagues; and also, they were more than twice as likely to be a King’s Counsel (16% compared to 7% respectively).
-
Over two thirds (70%) of male solicitors had 15+ PQE compared to over half (58%) for female solicitors[footnote 8].
-
For Chartered Legal Executives the proportion of those with 15+ years’ experience was more similar for male and female members, at 40% and 38% respectively.
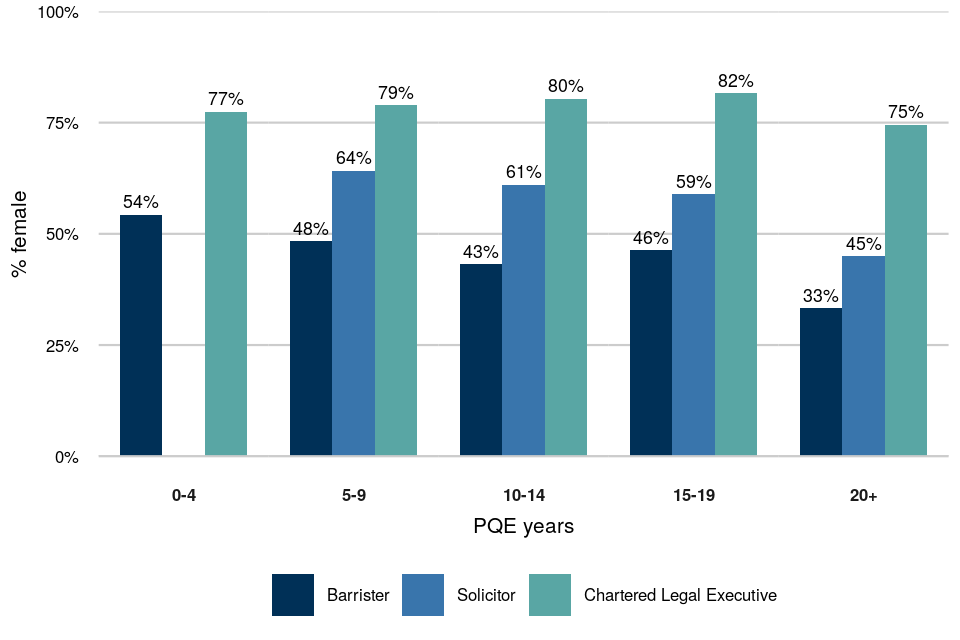
Figure 1: Proportion of female legal professionals by PQE band, April 2026[footnote 9] Across all legal professions, the proportion of female professionals is notably lower for those having 20+ years’ experience.
5.2 Judicial Appointments: Applications and Selections
Overall, there is no evidence of a disparity of outcomes in legal judicial selection in 2025-26 for female candidates relative to male candidates.
Overall View
Table 2.2 shows that across all legal JAC exercises in 2025-26, female candidates[footnote 10] accounted for 50% of the average eligible pool, 51% of the applications (2,600), 51% of those shortlisted (729) and 55% of the recommendations for appointment (316)[footnote 11].
These percentages suggest there was no disparity of outcomes between male and female candidates in these exercises. This is borne out by the estimated[footnote 12] RRI for the eligible pool to recommendation of 1.18, which shows that overall the likelihood of success is about 18% higher for female candidates from the eligible pool compared to male candidates. This difference is statistically but not practically significant[footnote 13]. Similarly there was no evidence of a disparity of outcomes between male and female applicants in these exercises from application to recommendation (RRI of 1.14, which was not statistically significant).[footnote 14]
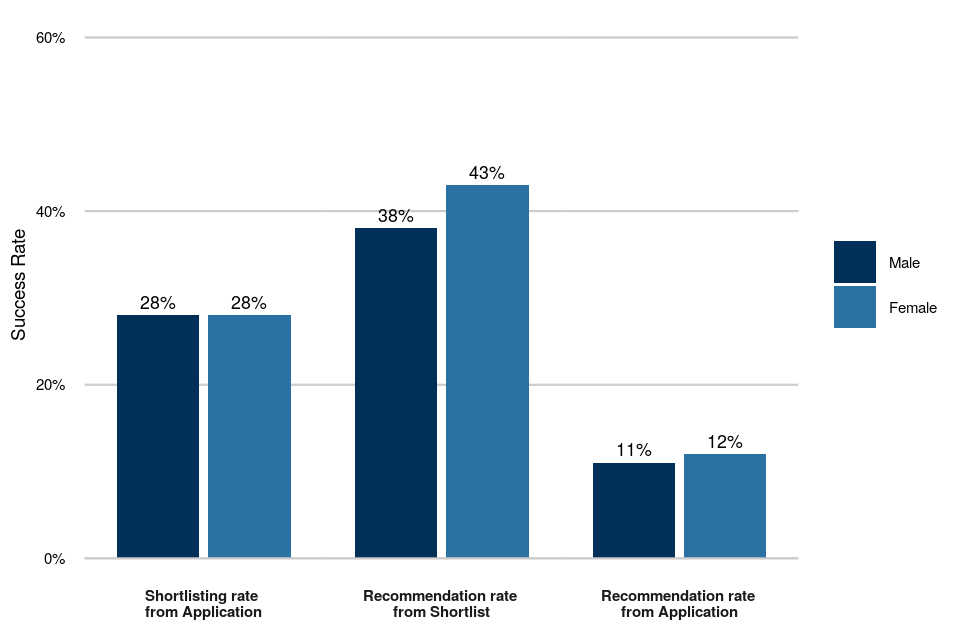
This lack of a practically significant difference between male and female candidates is also shown by their similar progression rates in Figure 2.
Figure 2: The proportion of each sex progressing through the exercise stages (all legal exercises completed in 2025-26).
Exercise-specific Analysis
In 2025-26, of the eight legal exercises where an RRI could be calculated[footnote 15], by sex, two exercises (Fee-paid Judge of the First-tier Tribunal, and Judge of the First-tier Tribunal) showed a disparity in outcomes in favour of female candidates that were both statistically and practically significant (Figure 3). This means that there is evidence of a disparity in the success rates between male and female candidates from eligible pool to recommendation for those two exercises.
Table 2.2 shows that when looking at the RRI values from application to recommendation for all eight exercises, none showed a disparity in outcomes by sex that was both statistically and practically significant, indicating no evidence of a disparity between male and female candidates from application to recommendation.
Figure 3: RRI for female compared to male candidates, from eligible pool to recommendation (all legal exercises completed in 2025-26).
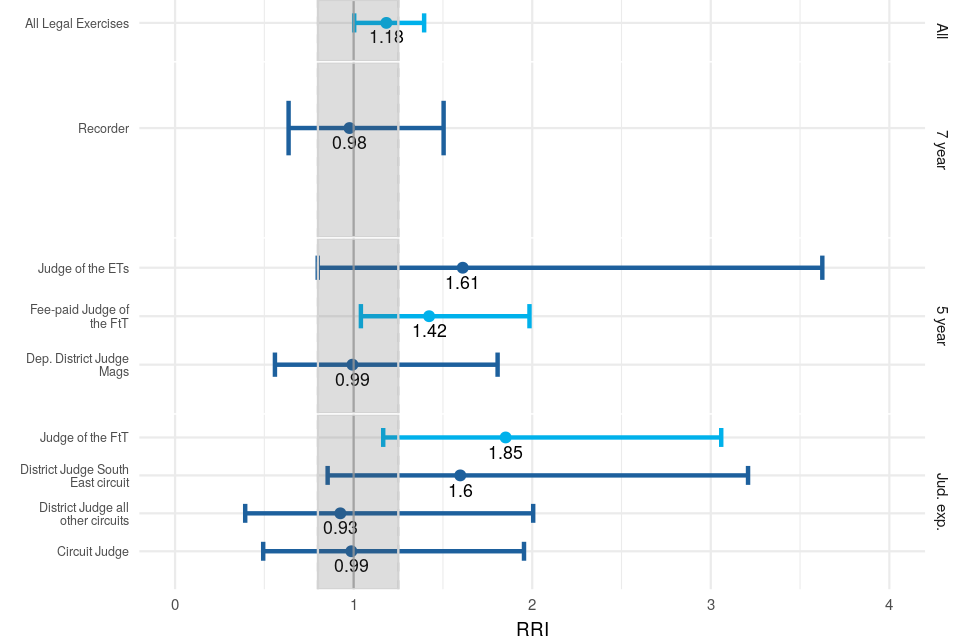
For Figure 3 above, note that the tolerance zone is shaded grey (0.8 to 1.25); results falling within this zone are considered to represent a disparity of outcomes which is not large enough to be considered practically important. Where the confidence interval (represented by the arms extending from each dot) overlaps the parity line (1 on the x-axis), results are deemed as not statistically significant[footnote 13].
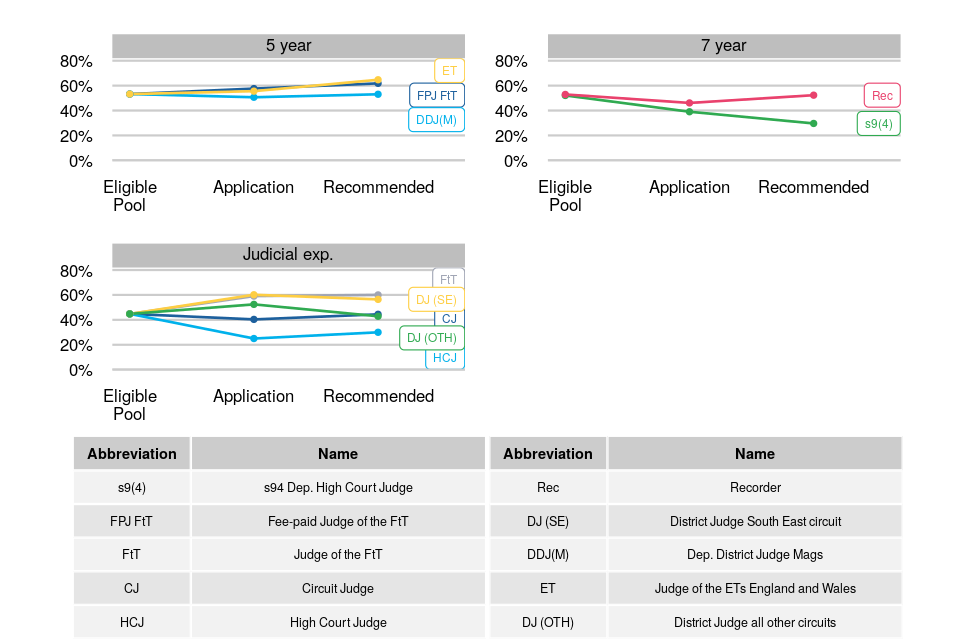
Representation percentages (Figure 4) help to show the progress of female candidates at different stages of the selection process. In comparison to the eligible pool, female representation was higher at the recommendation for appointment stage for four of the ten large legal exercises.
Figure 4: The female proportion of the candidate pool at different stages of the appointments process, split by eligible pool type (5 years’ PQE, 7 years’ PQE, and Previous Judicial Experience (PJE)) and exercise, for large legal exercises completed in 2025-26.
5.3 Judicial Office Holders
Female representation among judges in post has been increasing steadily over recent years, for both courts and tribunals judges.
Judges in post
Table 3.4 shows that as at 1 April 2026, female representation among all court judges (40%) was 12 percentage points higher than in 2016, and that for all tribunal judges (at 54%) it was 10 percentage points[footnote 16] higher than in 2016 (Figure 5).
Figure 5: Proportion of female court and tribunal judges as at 1 April, from 2016.
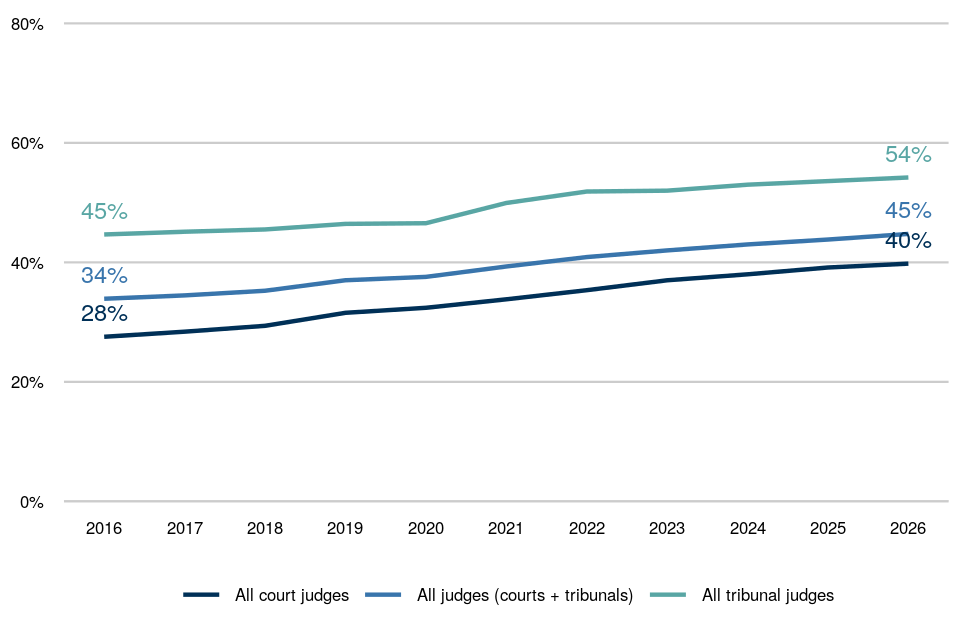
For context, just over half of the general population aged 25-74 and just under half of the economically active population of England and Wales are female[footnote 17]. As judicial roles require substantial legal experience, a direct comparison with the general population does not provide as much insight on the progression of female representation in the judiciary as considering the makeup of the legal professions (as presented at the beginning of this chapter).
New entrants, promotions and leavers
Table 3.1 shows that:
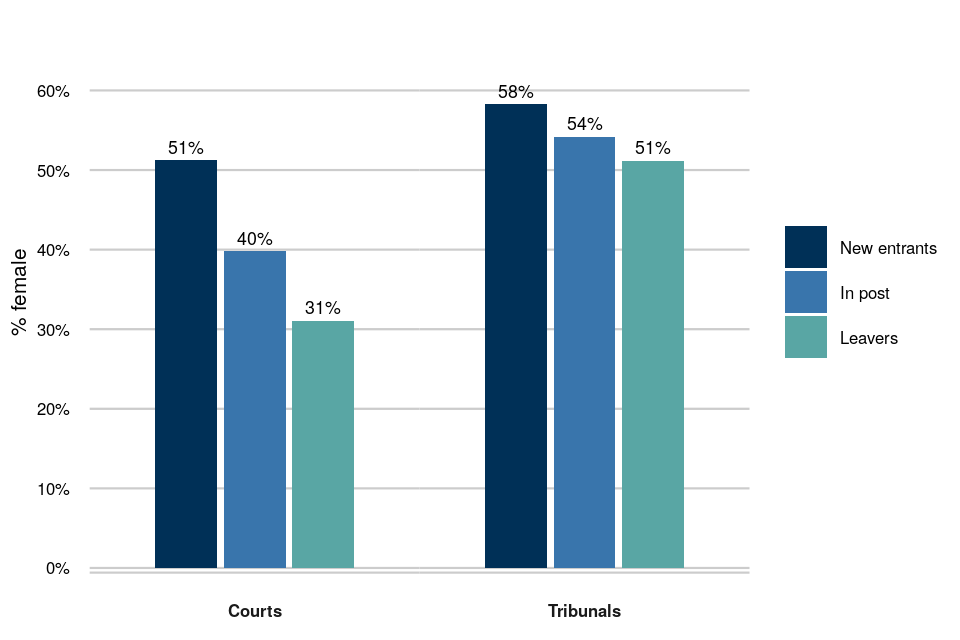
Of the new entrants to the judiciary – those not previously holding a judicial appointment – during 2025-26, 55% were female (51% in courts and 58% in tribunals).
Of those members of the judiciary who were promoted during 2025-26, 46% were female, with 40% in the courts and 54% in tribunals.
Of those who left the judiciary during 2025-26, 38% were female (31% in courts and 51% in tribunals - Figure 6).
Figure 6: Representation of female court and tribunal judges leaving and joining the judiciary, 1 April 2025 – 31 March 2026.
Patterns by type of appointment
Female representation across the judiciary varies by appointment type and seniority (Figure 7).
As at 1 April 2026, in the courts, female judges held 30% of the more senior posts (High Court and above). The highest level of female representation was among the Deputy District Judges (County Court) at 49%.
Table 3.1 also shows that, in tribunals, female judges accounted for over half (62%) of the most senior roles (Presidents)[footnote 18].
Figure 7: Female representation of court and tribunal judges by appointment[footnote 19], 1 April 2026.

Patterns by region
The proportion of female judges across the court judiciary also varies by region, from 32% in Wales, to 43% in the Midlands (with England and Wales at 40%). Variations may reflect the nature of the appointments in the different regions, as well as the underlying regional make-up of both the general population and the eligible pool. Further information is available in Table 3.2.
6. Ethnicity
6.1 Legal Professions
There has been a gradual increase in the representation of ethnic minorities in all three legal professions over the last decade.
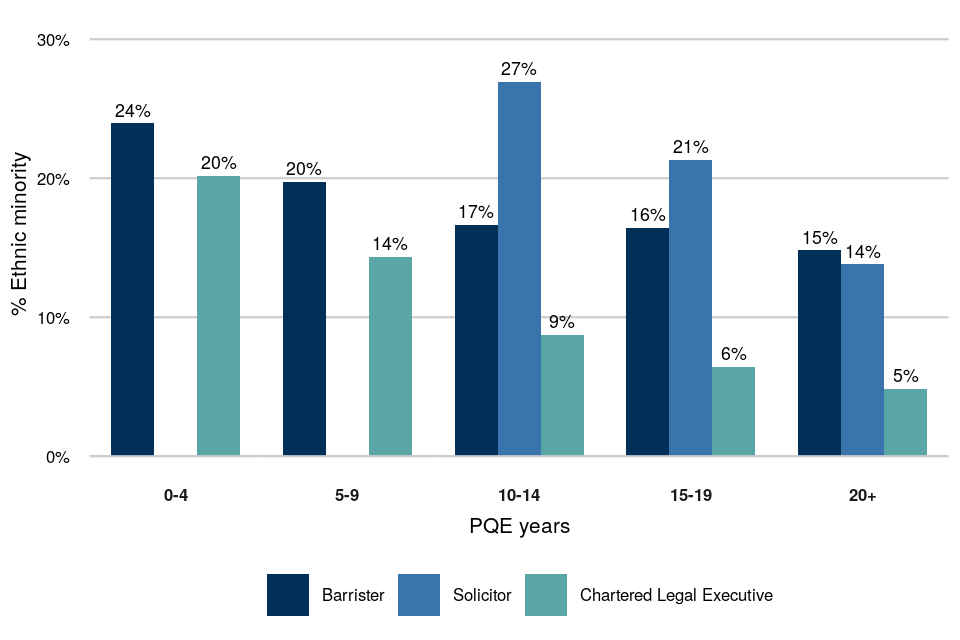
Representation of individuals from ethnic minority backgrounds is lower at the senior level for each of the legal professions.
Overall Picture in Each Profession
Since 2016 there has been a gradual increase in the representation of ethnic minorities amongst the three legal professions. For barristers and solicitors, the ethnic minority proportion increased four percentage points to 17% and 20% respectively, and for Chartered Legal Executives it increased six percentage points to 12%[footnote 16].
At 1st April 2026, for all three professions the proportion of individuals from an ethnic minority background was broadly in line with those of the 25-74 working population in England and Wales from the 2021 Census, and slightly higher than the older 50-74 working population.[footnote 20]
Looking at the groups making up the ethnic minority population, the main variation was in the representation of Asian ethnicity among solicitors (13%) being higher than the 25-74 working population (9%) and the older 50-74 working population (6%). Representation of Black individuals was similar for all three professions (3% to 4%), and was comparable to the 25-74 (4%) and 50-74 (3%) working age populations.
Within the Asian group, the representation of Bangladeshi individuals was the same for each of the three professions, but for all other sub-groups (Chinese, Indian, Pakistani, and Other) representation was higher for solicitors compared to barristers and Chartered Legal Executives. The proportion of Black Caribbean individuals was higher than Black African individuals amongst Chartered Legal Executives, but the other way round for barristers and solicitors.
Post Qualification Experience and seniority[footnote 23]
As mentioned previously, although PQE is a measure of experience rather than seniority, a PQE of 15 years or more is being used as a proxy measure of seniority for the purpose of this report.
In practice, most applicants for judicial roles have more than the minimum experience. For court and tribunal posts requiring at least 5 years’ experience, applicants have on average around 19 years’ experience, and for court and tribunal posts requiring 7 or more years of experience, applicants have on average around 21 years’ experience[footnote 21]. Table 1.1 shows that as at 1 April 2026:
- Amongst barristers from an ethnic minority background 22% were newly qualified (0-4 years PQE) and 48% were at a senior (15+ years PQE) level, compared to 15% and 57% respectively for White barristers. Of ethnic minority barristers 8% were King’s Counsel, compared to 13% of White barristers.
- Of those solicitors from an ethnic minority background 57% had 15 years or more PQE compared to 74% of White solicitors[footnote 8].
- Amongst Chartered Legal Executives from an ethnic minority background, 51% were newly qualified and 18% were at a senior level, compared to 27% and 41% respectively for White Chartered Legal Executives.
Figure 8: The proportion of each PQE band by ethnic minority group and legal profession group, April 2026[footnote 22]
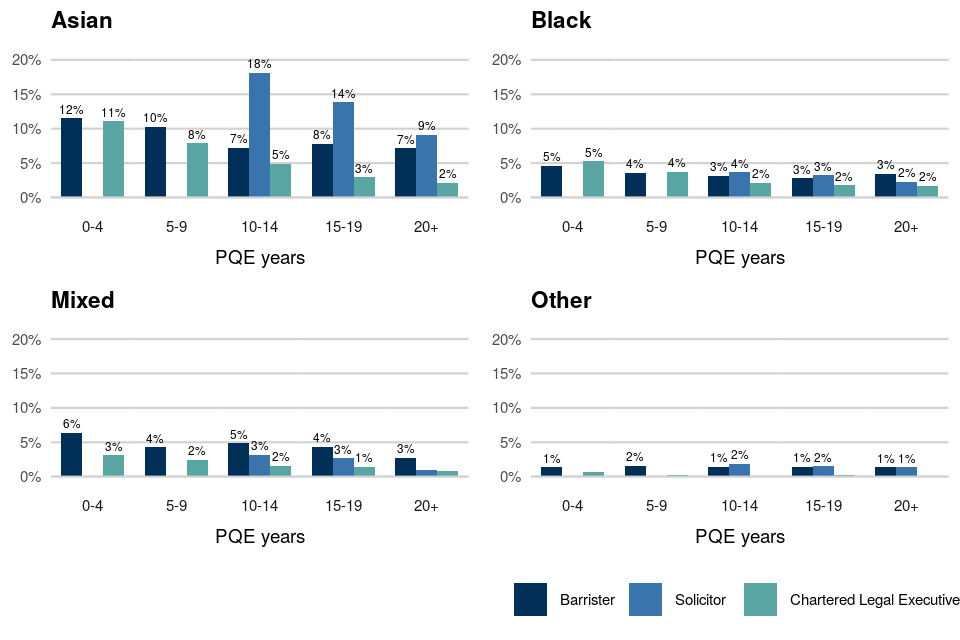
Figure 9: The ethnic minority proportion of each PQE band by legal profession group, April 2026[footnote 22]
6.2 Judicial Appointments: Applications and Selections
Single-year Analysis: 2025-26
Ethnic minority candidates were recommended for legal exercises in line with their representation in the eligible pool, suggesting no disparity of outcomes in judicial appointments relative to White candidates when comparing recommendation rates from the eligible pool.
However, ethnic minority candidates made up a much higher percentage of applications than their representation in the eligible pool, and their representation decreased between each exercise stage in legal exercises, from application to shortlisting to recommendation for appointment.
For selection exercises that closed in the 2025-26 financial year, candidate numbers at the application, shortlisting and recommendation for appointment stages were not high enough to produce and publish statistics for a more granular ethnic minority group breakdown at the exercise level as the numbers would be too low to draw robust inferences and there would be a risk of individuals being identified from their personal data. Therefore, for individual exercises in this most recent year of data, we consider candidates from ethnic minority backgrounds together as one group and compare their progression outcomes to White candidates.
Later in this section we have grouped together exercises from the latest 3-year period (2023-24 to 2025-26) to generate a sufficient sample of candidates from which we can look at ethnic minority backgrounds on a more granular level in exercises for particular roles.
Overall View
Across all legal exercises in 2025-26:
- Ethnic minority individuals comprised 16% of the overall eligible pool, and when comparing eligible pool to recommendation rates, the rate for ethnic minority candidates was found to be similar to that for White candidates (shown by the estimated[footnote 24] RRI of 1.12. Table 2.2)[footnote 13]. This indicates that there was no disparity of outcomes between ethnic minority and White candidates when comparing recommendation rates from the eligible pool.
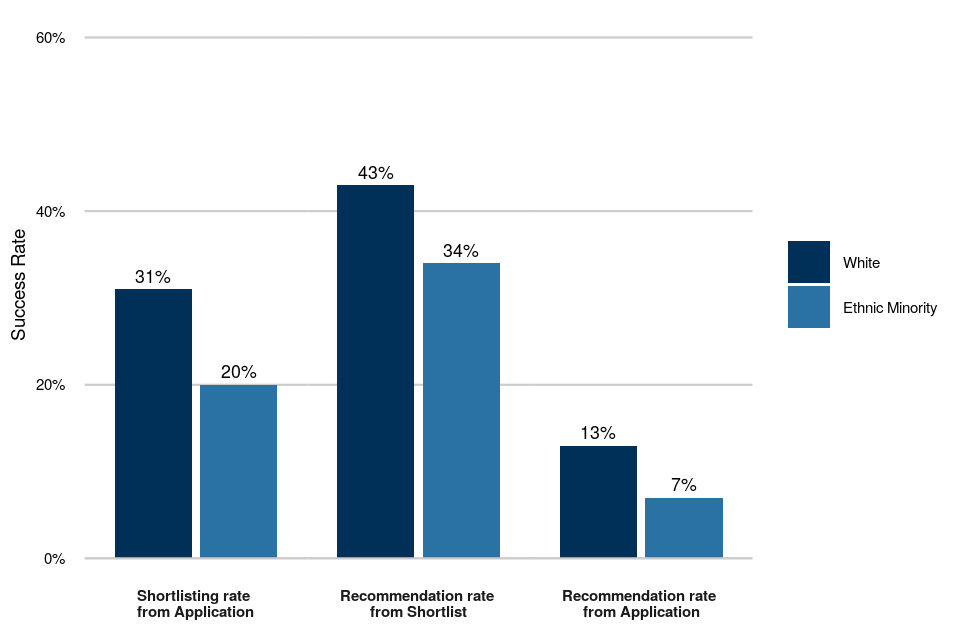
- Ethnic minority candidates made up a much higher percentage of applications (30%) than their representation in the eligible pool. They accounted for 18% of those recommended for appointment[footnote 25], and this drop-off is reflected in the progress rates from application which were lower for ethnic minority candidates compared to those for White candidates (Figure 10).
Figure 10: Progression of applicants through the exercise stages by ethnicity (all legal exercises completed in 2025-26).
Asian or Asian British
- Asian representation among applicants was significantly higher than it was in the eligible pool, but subsequently dropped at the shortlisting and recommendation for appointment stages (Figure 11).
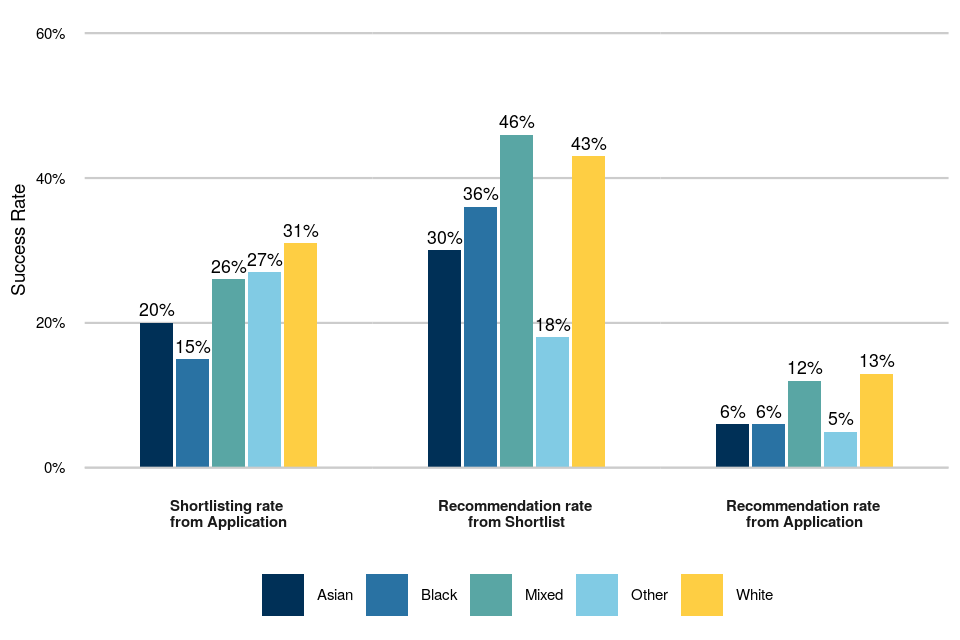
- This is reflected in the progression rates in Figure 12 which show lower rates for Asian candidates compared to White candidates for all stages.
- There was no difference in the likelihood of success from eligible pool to recommendation between Asian candidates and White candidates, shown by the estimated RRI of 1.00 (Table 2.2).
Black or Black British
- Similar to Asian candidates, Black representation among applicants was higher than it was in the eligible pool, but dropped subsequently at the shortlisting and recommendation for appointment stages (Figure 11).
- The progression rates in Figure 12 show lower rates for Black candidates compared to White candidates for all stages.
- The likelihood of success from eligible pool to recommendation was higher for Black candidates than for White candidates, indicated by the estimated RRI of 1.27. However, this estimated difference is practically but not statistically significant, indicating no evidence of a disparity in the progression rate for Black candidates compared with White candidates.
Mixed Ethnicity
- The representation of Mixed ethnicity candidates among applicants was slightly higher than it was in the eligible pool but, unlike for Asian and Black candidates, it increased slightly at the shortlisting and recommendation for appointment stages (Figure 11).
- Accordingly, the progression rates for candidates of Mixed ethnicity are comparable to those of White candidates (Figure 12).
- The likelihood of success from eligible pool to recommendation was nearly twice as likely for Mixed ethnicity candidates than it was for White candidates, shown by the estimated RRI of 1.83 (Table 2.2). This estimated difference is both practically and statistically significant, meaning that we can be confident that there is a disparity in the progression from eligible pool to recommendation in favour of Mixed candidates compared to White candidates.
Other Ethnicities
- Candidates with an ethnicity other than White, Asian, Black, or Mixed ethnicity represented 1% of all candidates at every stage from eligible pool to recommendation (Figure 11).
- Progression rates for these candidates were slightly lower than for White candidates at shortlisting, but considerably lower than for White candidates at the recommendation stage (Figure 12).
- There were not enough total recommended candidates from other ethnic groups for an RRI covering the eligible pool to recommendation stage to be reliably calculated.
Figure 11: Representation of more granular groupings of ethnic minority candidates at different exercise stages (all legal exercises completed in 2025-26)
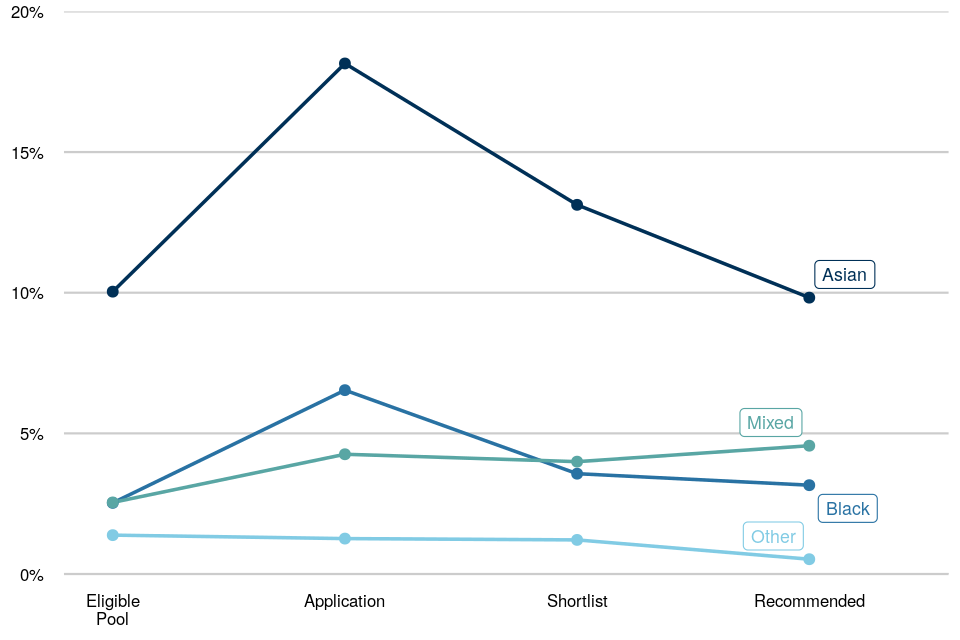
Figure 12: Progression rates of applicants through judicial appointment exercise stages by ethnicity (all legal exercises completed in 2025-26)
Exercise-specific Analysis
When considering ethnic minority candidates relative to White candidates (Figure 13):
- Of the four exercises for which an RRI could be calculated, one (Judge of the First-tier Tribunal) had a practically and statistically significant result from the eligible pool to recommendation, indicating evidence of a disparity of outcomes in favour of ethnic minority candidates.
- When looking at the RRI values for application to recommendation, two of the four exercises (Recorder and Fee-paid Judge of the First-tier Tribunal) had practically and statistically significant RRI values (0.60 and 0.44 respectively), suggesting that there was evidence of disparity of outcomes in favour of White candidates when looking at applicants rather than the eligible pool. These two contrasting measures reflect that applicants from an ethnic minority background make up a much higher proportion of applicants than the ethnic minority eligible pool representation, such that although they dropped off significantly through the process, the proportion of recommended candidates from an ethnic minority background was similar to the proportion of the eligible pool (Figure 14).
Figure 13: RRI for ethnic minority compared to White candidates from eligible pool to recommendation (large legal exercises completed 2025-26).
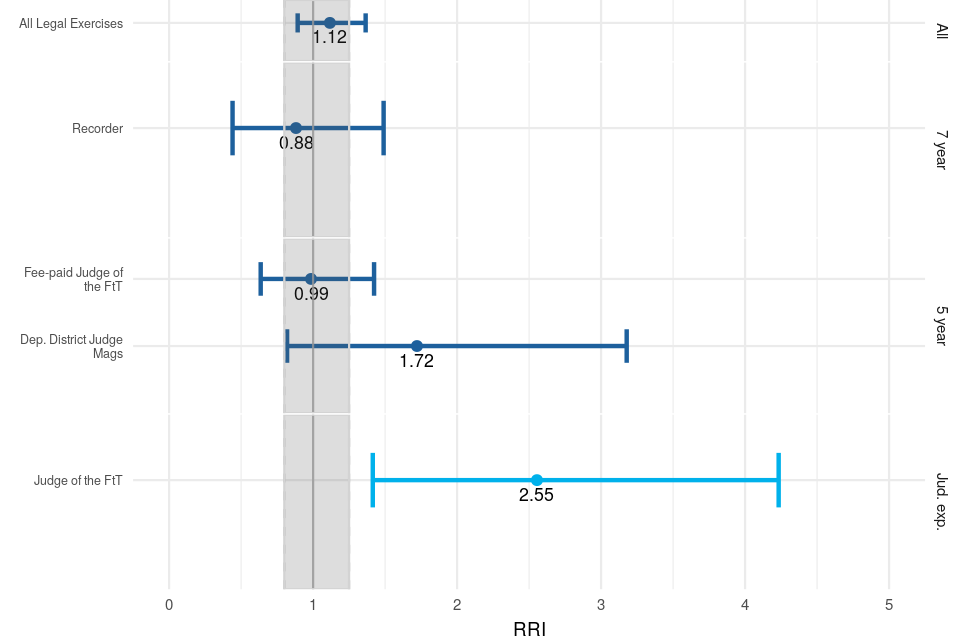
For Figure 13 above, note that the tolerance zone is shaded grey (0.8 to 1.25); results falling within this zone are considered to represent a disparity of outcomes which is not large enough to be considered practically important. Where the confidence interval (represented by the arms extending from each dot) overlaps the parity line (1 on the x-axis), results are deemed as not statistically significant[footnote 13].
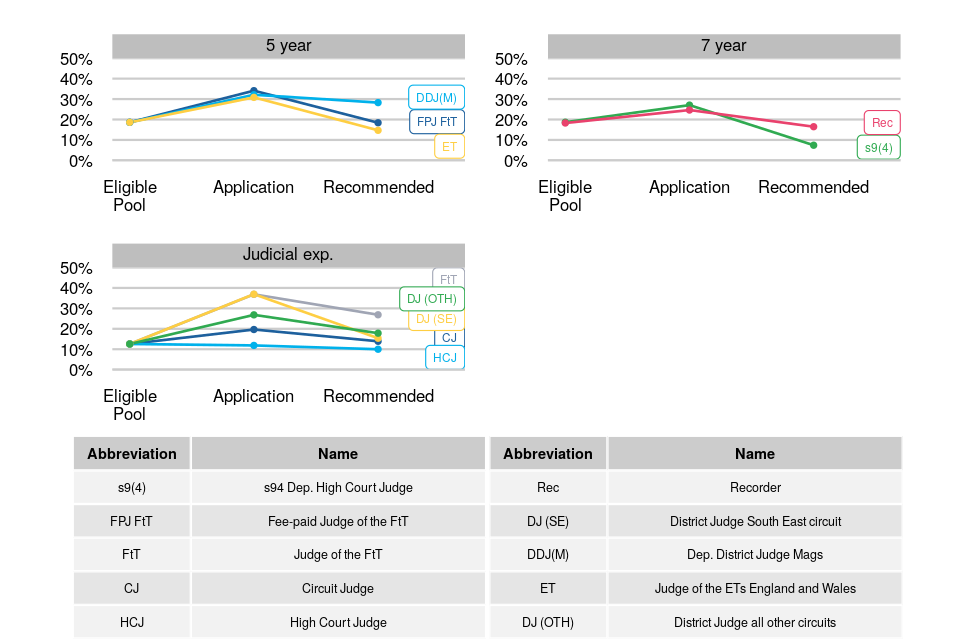
For all but one (High Court Judge) of the large legal exercises in 2025-26, ethnic minority representation was higher at the application stage than in the eligible pool (Figure 14). Of those ten exercises, half (Judge of the First-tier Tribunal, Circuit Judge, District Judge (South East), District Judge (Other circuits) and Deputy District Judge) had higher ethnic minority representation in recommendations compared to the corresponding eligible pool.
Figure 14: Proportion of ethnic minority candidates for each large legal exercise completed in 2025-26 at selected stages, by eligible pool type.
6.3 Judicial Appointments: Applications and Selections
Three-year Analysis: 2023-24 to 2025-26
For one of the legal exercises over the past three years, there is evidence to suggest disparity in the recommendation rate from eligible pool in favour of White candidates compared to Asian candidates.
For three legal exercises there is evidence to suggest disparity in the recommendation rate from eligible pool in favour of Mixed ethnicity candidates compared to White candidates.
To enable robust comparisons and avoid personal data disclosure risks on the progression of candidates from Asian, Black, Mixed and other ethnic backgrounds, we have aggregated data at an exercise level from the three most recent years of judicial appointments. The statistics presented below are produced from data on selection exercises that closed between 1 April 2023 and 31 March 2026. Summary findings, using ethnicity data at the most granular level that is collected (corresponding to the 19 ethnicity categories in the 2021 Census of England and Wales), have again been included in this report, based on the same three-year period.
Across all legal exercises that closed between 1 April 2023 and 31 March 2026:
When looking at a more granular level at those candidates who declared themselves from a White background, the White Irish sub-group had a slightly lower application to shortlist rate (23%) than the other two main White sub-groups, English, Welsh, Scottish, Northern Ireland, British (27%) and ‘Other White’ (26%). However, all three sub-groups had similar application to recommendation rates of either 11% or 12%.
Asian or Asian British
For one of the five individual exercises for which an RRI could be calculated (Deputy District Judge), Asian candidates had lower eligible pool to recommendation rates relative to White candidates, with an RRI value of 0.62 (Figure 15). This was both practically and statistically significant, indicating that there was indeed evidence of a real difference between Asian and White candidates in this exercise. The latest single year RRI of 1.00 for Asian candidates for all legal exercises noted above, compared with an RRI of 0.93 over the 3-year period, indicates that the disparity of outcomes has decreased in more recent selection exercises.
At a more granular level, of the larger Asian sub-groups, the Pakistani group had slightly lower progression rates from application to shortlist (14%) and application to recommendation (4%), compared to the Indian and Other Asian groups, which had shortlisting rates of 17% and 18%, and recommendation rates of 6% and 6% respectively.
Black or Black British
There was one individual exercise type (Deputy District Judge) which had a high enough number of Black recommended candidates for an RRI covering all stages to be reliably calculated. The RRI value of 1.11 for eligible pool to recommendation indicated no evidence of any disparity in the rates for Black and White candidates for these exercises over the three-year period.
At a more granular level, the Black Caribbean sub-group had progression rates (application to shortlist, and application to recommendation) which were slightly higher (14% and 5%) than the Black African sub-group (12% and 4%).
Mixed Ethnicity
For all three individual exercises for which an RRI could be calculated (Recorder, Deputy District Judge and Fee-paid Judge of the First-tier Tribunal and Fee-paid Judge of the Employment Tribunals), candidates of Mixed ethnicity had higher eligible pool to recommendation rates compared to White candidates (RRIs of 3.77, 2.31 and 1.91 respectively). All three of these were found to be both practically and statistically significant, indicating that there was indeed evidence of a higher likelihood of success for Mixed ethnicity candidates compared to White candidates in those exercises. The 2025-26 single year RRI of 1.83 for Mixed ethnicity candidates overall noted above indicates a similar outcome for the latest year.
At a more granular level, of the two largest sub-groups, those who declared themselves from any other Mixed ethnic background had a similar application to shortlist rate (25%) to those who were White and Asian, but a slightly higher recommendation rate (12% compared to 10%). Of the two other Mixed sub-groups, those who declared themselves as White and Black African had a higher application to shortlist rate (32%) compared to those who were White and Black Caribbean (26%), but a slightly lower recommendation rate (14% compared to 16% respectively).
Other Ethnicities
There were no individual exercise types which had high enough numbers of candidates from other ethnic groups for an RRI covering all stages to be reliably calculated.
Figure 15: RRIs for ethnic minorities compared to White candidates from eligible pool to recommendation, in legal selection exercises between April 2023 and March 2026.[footnote 26]
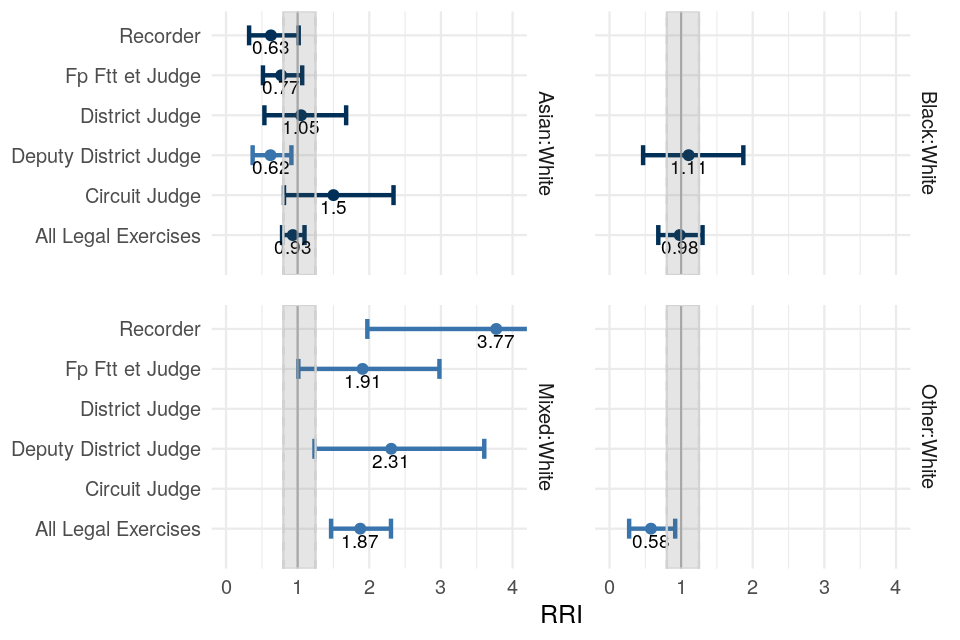
For the above figure note that statistically significant results[footnote 27] are light blue. The tolerance zone is shaded grey (0.8 to 1.25); results falling within this zone are considered to represent a disparity which is not large enough to be considered practically important (and tend not to be statistically significant)[footnote 13].
6.4 Judicial Office Holders
The proportion of Asian and Mixed ethnicity individuals in the judiciary has slowly increased since 2016, while the proportion of Black and other ethnic minority individuals has stayed the same in that time.
Judges in post
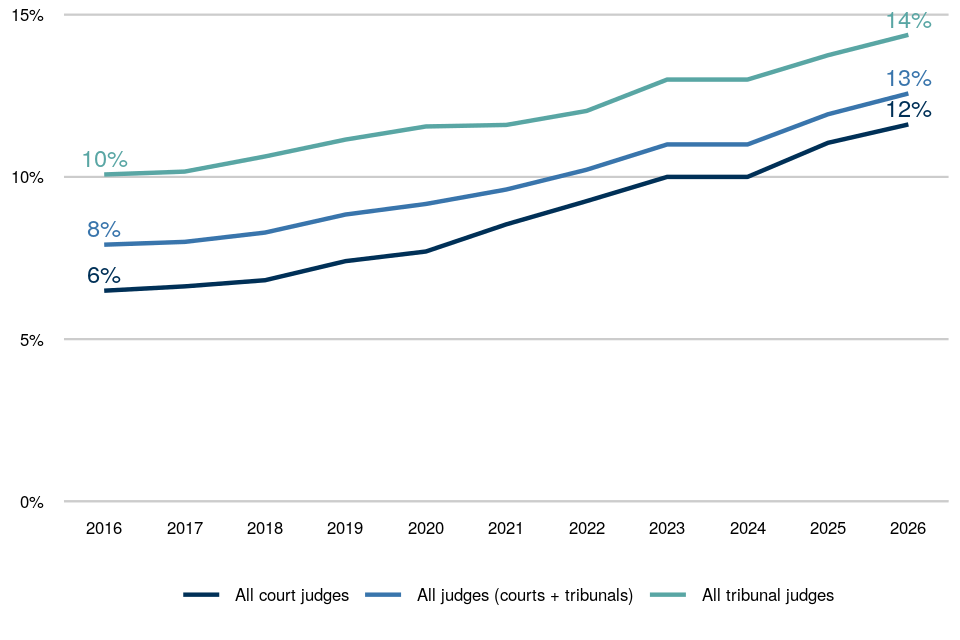
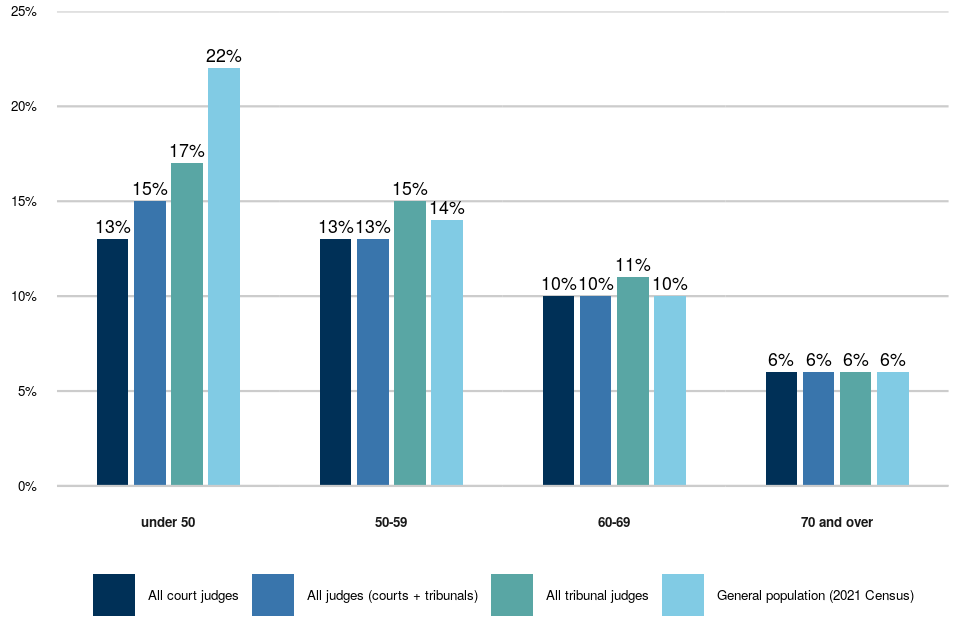
Figure 16 shows that, as at 1 April 2026, ethnic minority representation increased by 5 percentage points compared to 2016 for all judges. For court judges the increase was 5 percentage points[footnote 16] and for tribunal judges it was 4. The overall proportion of 13% is lower than that for the 25-74 working age population (17%) but slightly higher than the older 50-74 working age population (11%)[footnote 28].
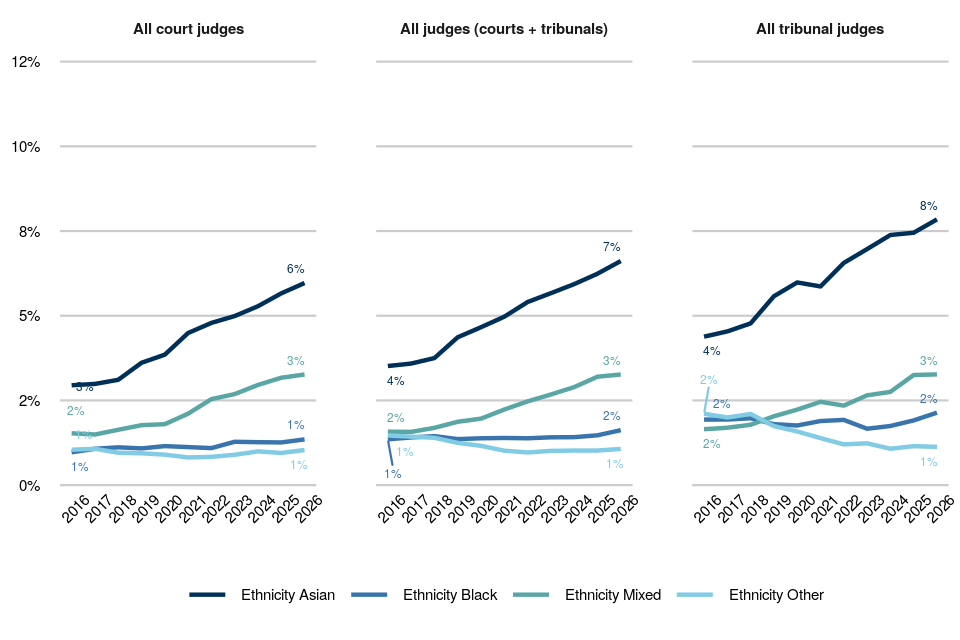
At a more granular level, over the same ten-year period, for all judges there was a three percentage-point rise in the proportion of Asian individuals (from 3.5% to 6.6%), and a two percentage point increase for those of Mixed ethnicity (from 1.6% to 3.3%). In contrast, for the Black ethnic group (from 1.4% to 1.6%) there was a comparatively smaller increase, and for those of ethnicity other than Asian, Black, Mixed or White (from 1.5% to 1.1%), there was a small drop in representation between 2016 and 2026.
At an even more granular level, as at 1 April 2026, of the overall proportion of Asian judges more than half had an Indian background. The proportion of judges who declared themselves from a Black Caribbean background was the same as for those from a Black African background.
Figure 16: Representation of ethnic minority individuals among court and tribunal judges, 2016 to 2026.
Broad comparisons can be made between the ethnic minority representation among judges with that of the general working age (25-74) population of England and Wales, by age group, as determined by the 2021 Census[footnote 28] (Figure 17). However, given this may not be an entirely suitable comparator as judges tend to be drawn from the upper end of the age distribution, it may be more appropriate to compare against the older working age (50-74) population.
Despite limitations in making comparisons, the age of judges should be kept in mind when considering variations in the proportions from an ethnic minority background, for example by appointment type.
Figure 17: Representation of ethnic minority individuals by age group - court and tribunal judges (2026) compared to general population (2021 Census)[footnote 29]
New entrants, promotions and leavers
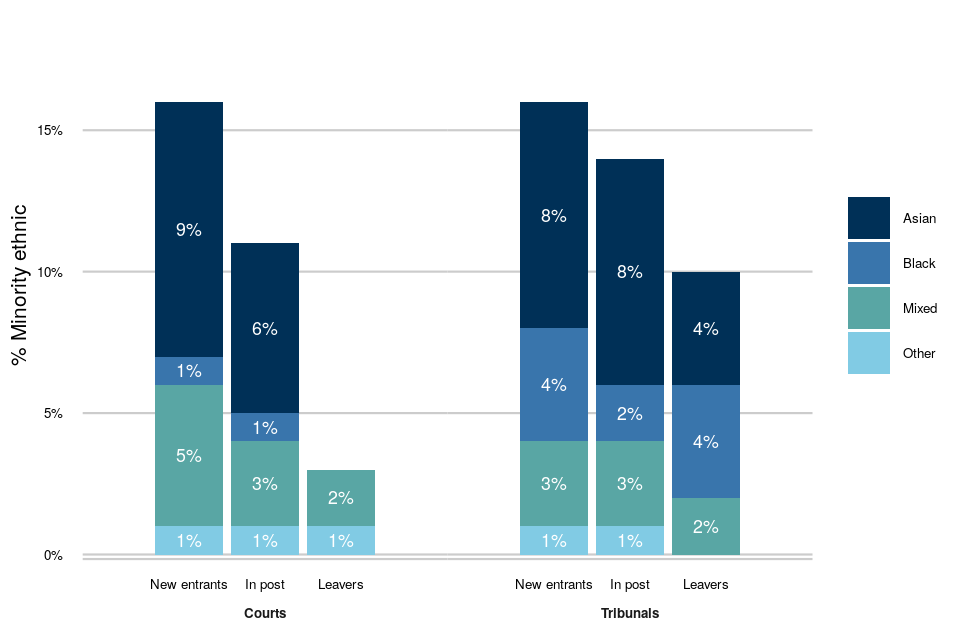
During 2025-26, the proportion of ethnic minority individuals entering the judiciary for both court (16%) and tribunal (16%) judges was higher than the proportion leaving in the same year, at 2% and 9% respectively (Figure 18). However, as with sex, these figures are likely to fluctuate depending on which and how many roles were appointed during the year.
Table 3.1 shows that of those members of the judiciary who were promoted during 2025-26, 15% were from an ethnic minority background (13% in courts and 17% in tribunals).
Figure 18: Proportion of judges joining, in post and leaving the judiciary by each ethnic minority group and court type, 1 April 2025 – 31 March 2026
Patterns by type of appointment
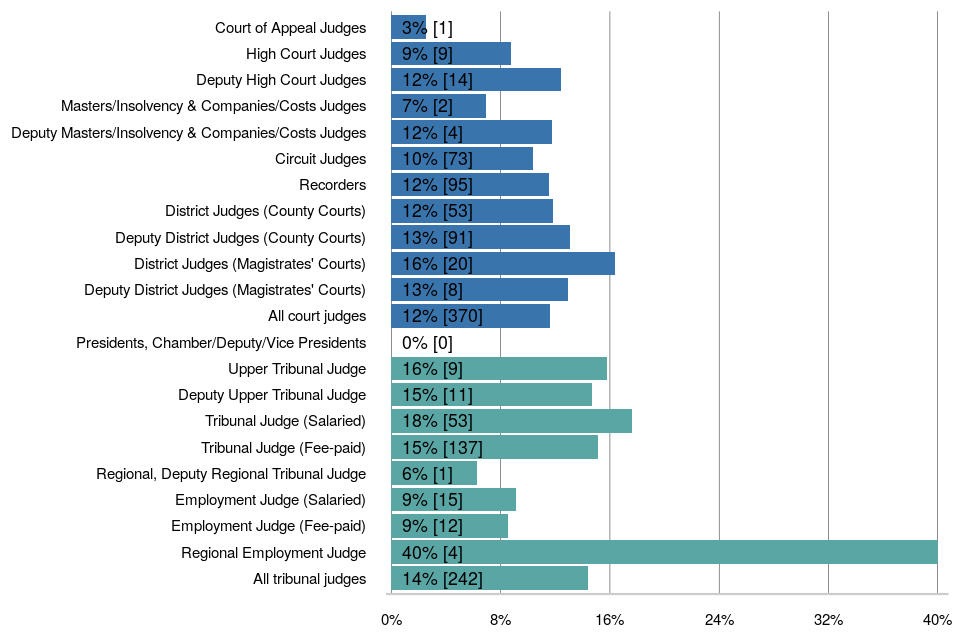
Due to small numbers at more granular categorisation of ethnic groups, we only consider the broader category overall. The representation of ethnic minority individuals varied with appointment-type, but there was no clear pattern with regards to seniority.
In the courts, the proportion of judges from ethnic minority backgrounds was highest for District Judges in magistrates’ courts (16%), with generally lower proportions for the more senior appointments (Figure 19).
For those tribunal roles with a larger total number (more than 10), ethnic minority representation varied between 9% and 18%, though there were no ethnic minority judges whose primary appointment was in the most senior tribunal positions (Presidents).
Figure 19: Representation of ethnic minority individuals among court and tribunal judges by appointment[footnote 19], 1 April 2026.
Patterns by region
Over half (51%) of all court judges who declared themselves as from an ethnic minority background were based in London, compared to only 1% in Wales and 4% in the South West.
The proportion of ethnic minority court judges also varied by region, from 14% and 16% in London and the Midlands, to 4% and 5% in Wales and the South West.
This is likely to reflect, to some extent, variations in the geographic distribution of ethnic minority groups in the general population by region, which is considerably higher in London than other areas.
7. Professional Background
7.1 Judicial Appointments: Applications and Selections
There is evidence of disparity of outcomes for solicitors compared to barristers in the recommendation rate from application for the legal selection exercises completed during 2025-26.
The professional background of applicants for judicial appointment is analysed using two separate methods:
-
“current legal role” compares applicants who have declared their current legal role as solicitor with those declaring their current legal role as barrister.
-
“ever legal role”[footnote 30] compares those who have ever been a solicitor to those who have ever been a barrister. This includes those who currently hold a legal role of barrister or solicitor and those who have declared holding the role of barrister or solicitor at any stage in their career[footnote 31].
Around 20% more applicants were identified as solicitors using the wider definition of ever legal role, though the same broad patterns are shown for both measures and as a result the focus below is on the “ever legal role”[footnote 32].
Overall, 101 applicants in legal exercises declared ever holding the role of Chartered Legal Executives at application in 2025-26. Fourteen of those were shortlisted and five were recommended for immediate appointment. Note that Chartered Legal Executives are not eligible to apply for all selection exercises. Application numbers are not high enough for inclusion in this year’s full analysis[footnote 33].
Overall View
Across all legal exercises in 2025-26:
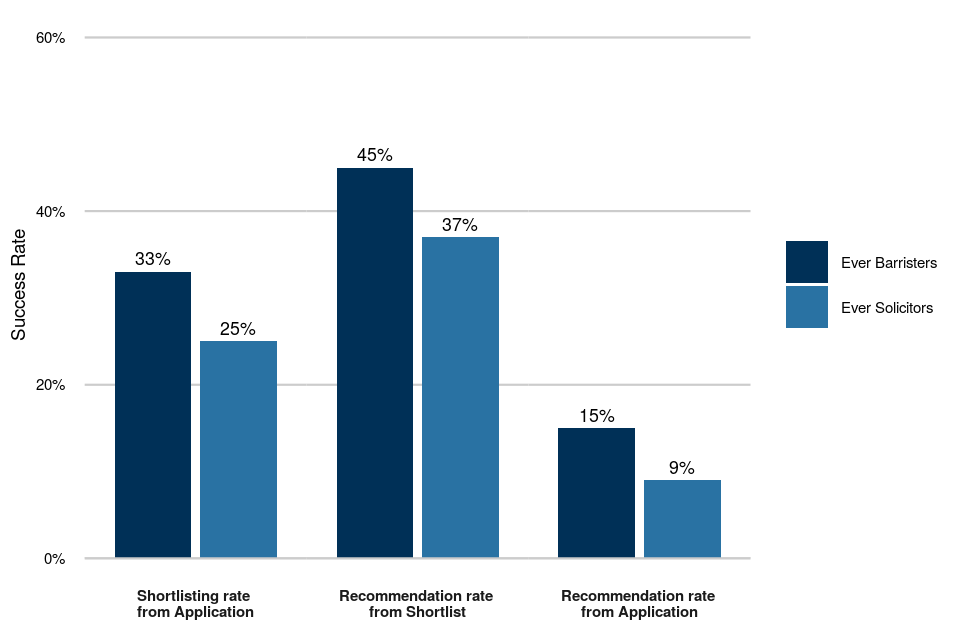
- From application[footnote 34] to recommendation, we can be confident that a disparity of outcomes of practical significance exists between solicitors and barristers. “Ever” solicitors were 38% less likely to be successful than “ever” barristers (shown by the statistically significant RRI of 0.62; for current solicitors relative to current barristers, the equivalent RRI is 0.58).
- “Ever” solicitors made up 44% of the recommendations for appointment (compared to 56% for “ever” barristers). For current solicitors, the equivalent figure was 31% (compared to 46% for barristers and 22% for salaried judicial office holders and other roles).
- This disparity is also shown by the lower progression rates from application to shortlisting and shortlisting to recommendation for “ever” solicitors compared to those for “ever” barristers (Figure 20). A similar pattern exists for the current legal role measure.
Figure 20: Progression of applicants through the exercise stages by “ever legal role” (all legal exercises completed in 2025-26)[footnote 35].
Exercise-specific Analysis
Considering the results for individual exercises:
- For five of the seven legal selection exercises large enough to reliably calculate an RRI, there was evidence of a disparity in success rates from application to recommendation for “ever” solicitors compared to “ever” barristers, which were both practically and statistically significant (Figure 21).
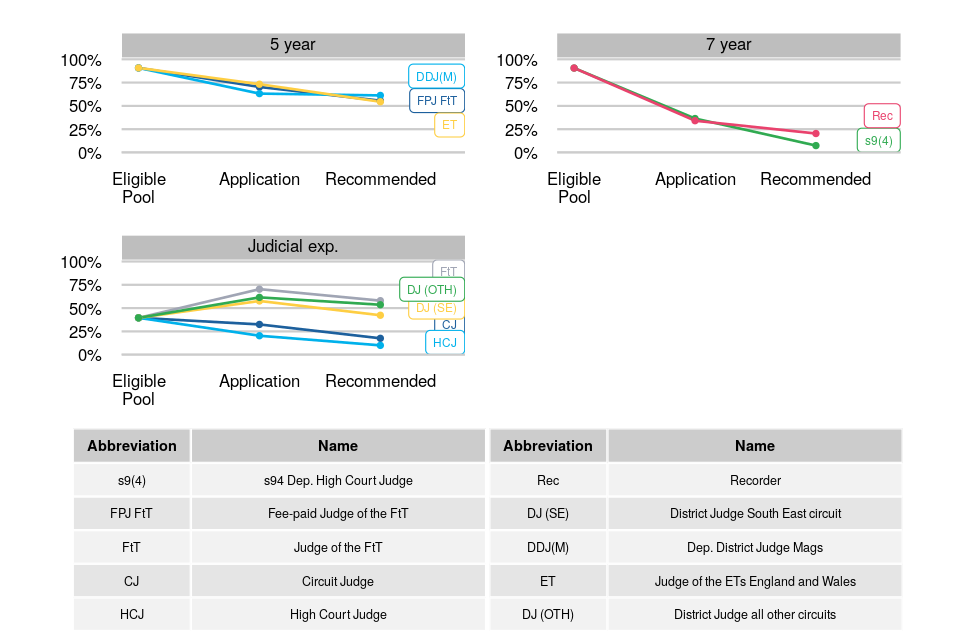
- Figure 22 shows that for three of the 10 large legal exercises completed in 2025-26 - Judge of the First-tier Tribunal, District Judge (South East) and District Judge (Other circuits) - there was a higher representation of “ever” solicitors at the recommendation for appointment stage compared to the eligible pool. These exercises required previous judicial experience, hence the much smaller solicitor representation in the eligible pool.
Figure 21: RRI for “ever” solicitors compared to “ever” barristers, from application to recommendation (large legal exercises completed in 2025-26).
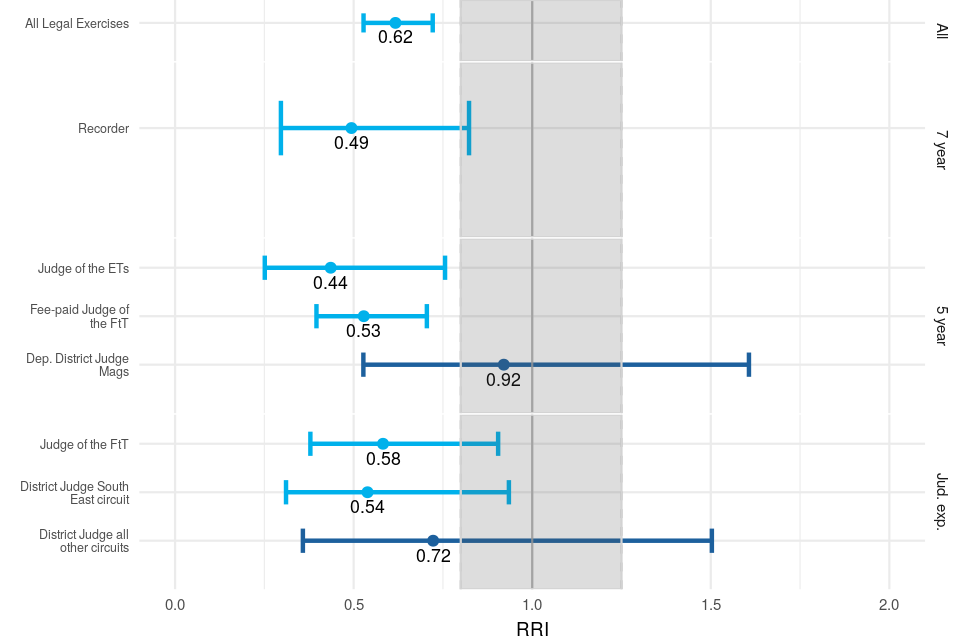
For the above figure note that statistically significant results are light blue[footnote 27]. The tolerance zone is shaded grey (0.8 to 1.25); results falling within this zone are considered to represent a disparity of outcomes which is not large enough to be considered practically important (and tend not to be statistically significant)[footnote 13].
Figure 22: Proportion of “ever” solicitors for each large legal exercise completed in 2025-26, at different exercise stages, by eligible pool type.
7.2 Judicial Office Holders
Tribunal judges are twice as likely to have a non-barrister background than court judges.
Judges in post
As at 1 April 2026:
- most judges from a non-barrister background were former solicitors (97%) with only 59 judges coming from neither a barrister nor a solicitor background.[footnote 36]
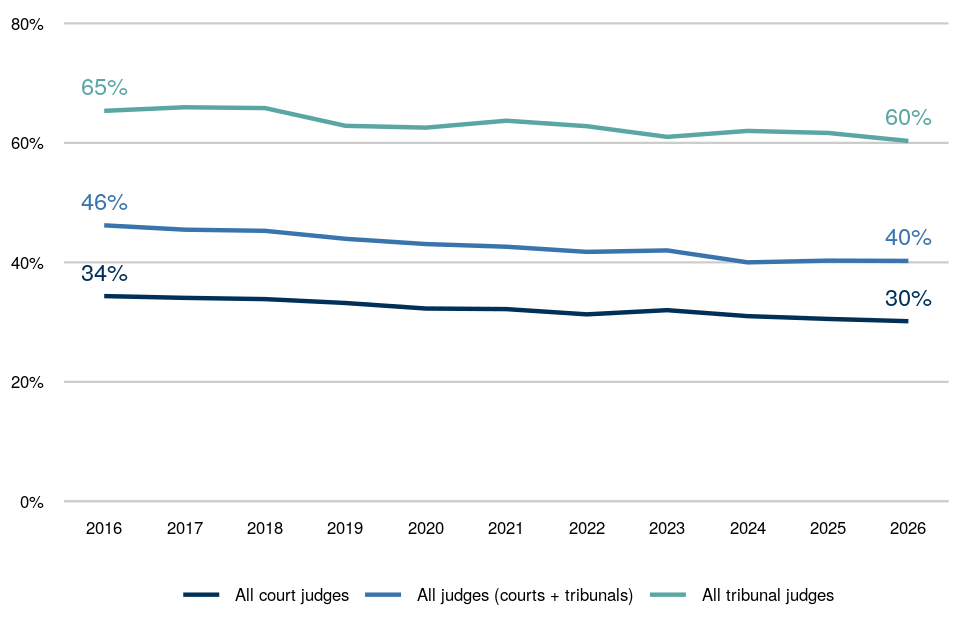
- non-barristers remain better represented among tribunal judges (60%) than court judges (30%). Compared to 2016, this is a 4 percentage-point decrease among court judges, and a 5 percentage-point decrease among tribunal judges[footnote 17] (Figure 23).
Figure 23: Representation of non-barristers among court and tribunal judges, 2016 to 2026.
New entrants, leavers and promotions
During 2025-26, the overall proportion of new entrant judges (47%) who were non-barristers (40% in courts and 53% in tribunals) was slightly lower than the overall proportion of non-barristers who left the judiciary (49%) during the same period (34% in courts and 74% in tribunals) - Figure 24.
Table 3.1 shows that of those members of the judiciary who were promoted during 2025-26, 31% were non-barristers (19% in courts and 50% in tribunals).
Figure 24: Proportion of judges joining, in post and leaving the judiciary who were non-barristers, by court type, 1 April 2025 – 31 March 2026.

Patterns by type of appointment
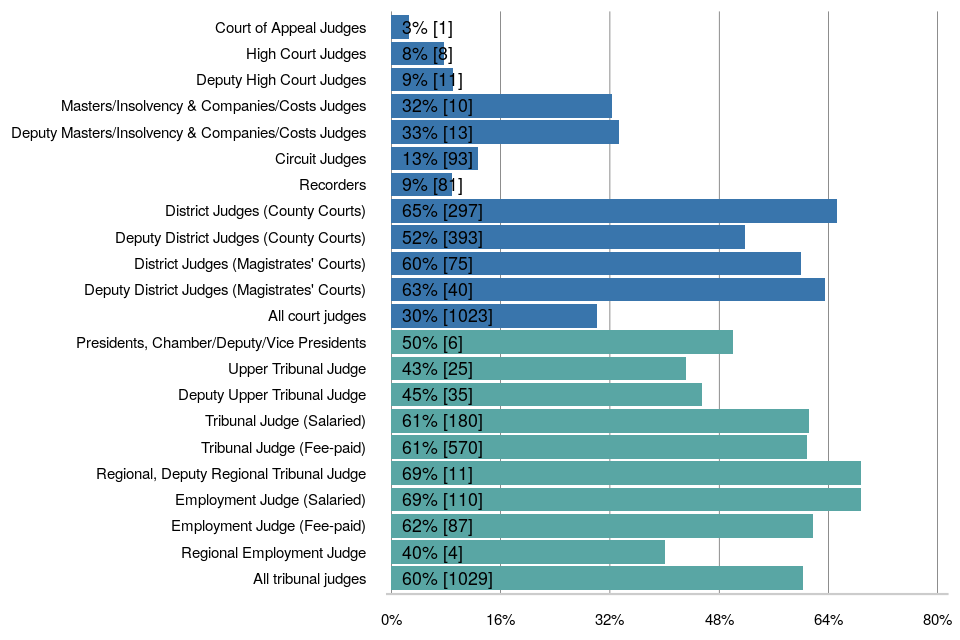
Figure 25 shows that, in the courts, non-barrister judges held 6% (9 of 148) of the more senior posts (High Court and above). Conversely, the non-barrister proportion among District Judges and Deputy District Judges ranged from 52% to 65%.
Within the tribunals, representation of non-barristers was generally higher, ranging between 40% and 69% across the different appointments.
Figure 25: Representation of non-barristers among court and tribunal judges, by appointment[footnote 19], 1 April 2026.
8. Intersectionality
Intersectionality explores the relationship between diversity characteristics. It captures how the combination of multiple characteristics can ‘intersect’ to produce heightened effects of advantage or disadvantage. Analysis was conducted to explore the role of intersectionality in the legal professions, on judicial appointments, and for judicial office holders.
8.1 Legal Professions
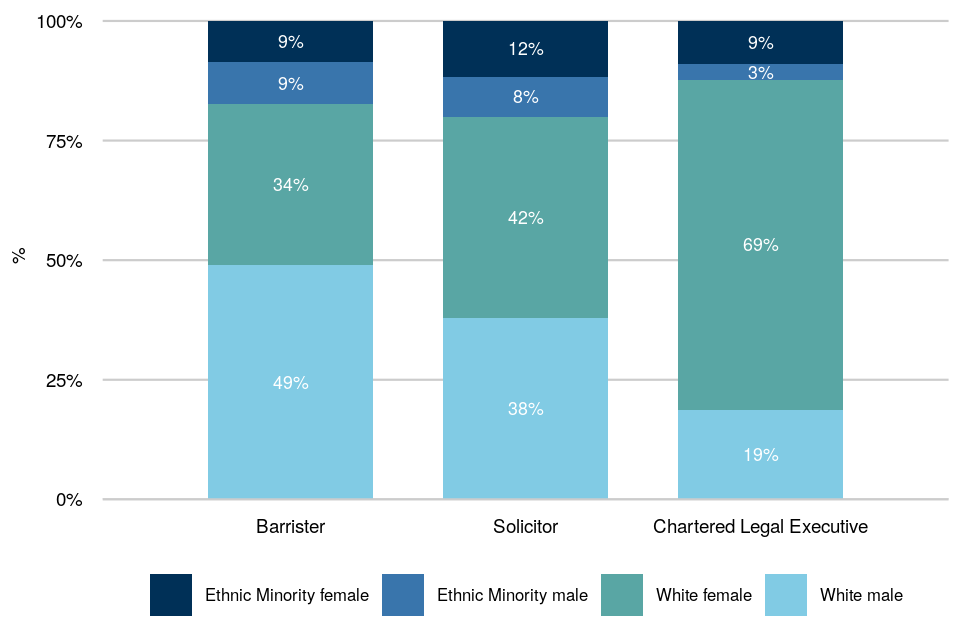
Sex and ethnic group representation varies across the legal professions. For barristers, White male representation is higher, but among solicitors and Chartered Legal Executives White female representation is higher.
Across each profession overall, Figure 26 shows that as at 1 April 2026, for the four sex-ethnicity intersection groups (White male, White female, ethnic minority male, ethnic minority female):
- Half of all barristers (49%) were White and male.
- The proportion of female practitioners is slightly larger for White solicitors (42%) and ethnic minority solicitors (12%) than their male colleagues (38% for White solicitors and 8% for ethnic minority solicitors).
- Over two-thirds (69%) of Chartered Legal Executives were White and female.
Figure 26: Representation of sex-ethnicity intersection groups by profession as at 1 April 2026.
Seniority
For each profession, of the four intersectional groups, the White male group had the highest proportion at the senior (15+ years PQE) level - 64% for barristers, 80% for solicitors[footnote 8] and 44% for Chartered Legal Executives.
Of the remaining intersectional groups, the ethnic minority female group had the lowest proportion at the senior level for barristers (45%) and solicitors (55%), but for Chartered Legal Executives it was the ethnic minority male group with only 12% of those at a senior level.
8.2 Judicial Appointments: Applications and Selections
Overall, there is no evidence of intersectional disparity of outcomes in judicial selection from application to recommendation over the 3-year period 2023-24 to 2025-26.
Method
The role of intersectionality in judicial appointments was analysed using data from the past three years, 2023-24 to 2025-26. The analysis explored the degree to which candidates with multiple under-represented characteristics faced barriers to recommendation from application over and above those faced for each individual characteristic on its own. Outcomes for four intersectional groups were considered: female ethnic minority candidates; ethnic minority solicitors; female solicitors; and female ethnic minority solicitors. Each of these groups were compared to White male barristers.
Findings: Main effects
Figure 27 and Table 2.10 show the estimated effect of each main characteristic and intersectional grouping on recommendation from the application stage. The independent characteristics of being female, an ethnic minority, and a solicitor had statistically significant effects on recommendation. In comparison to a White male barrister, being female was associated with a 28% increase in the odds of being recommended and being an ethnic minority or a solicitor was associated with a 53% decrease in the odds of being recommended. Unlike when RRIs are calculated directly for each characteristic in previous chapters, this analysis isolates the impact of each characteristic once having accounted for the other characteristics. The impacts of ethnicity and professional background remain largely in line with those produced by RRIs, but the impact of sex increases. In other words, once the negative impacts of being an ethnic minority or a solicitor have been accounted for, being female is associated with a 28% increase in the odds of appointment.
Findings: Intersectional effects
Having accounted for main effects, any additional barriers posed by intersectionality were isolated. Being a female ethnic minority solicitor was associated with a decrease in the odds of being recommended, over and above the main impacts of being female, an ethnic minority, or a solicitor. Contrastingly, being a female solicitor, female ethnic minority, or an ethnic minority solicitor was associated with a small increase in the odds of being recommended. However, none of these effects were statistically significant, meaning that there was no significant evidence of intersectional effects. Put differently, this analysis implies that there is no additional advantage or disadvantage in judicial appointment for having combined characteristics.
Figure 27: Independent impact of main and intersectional characteristics on recommendation (legal exercises completed between 2023-24 and 2025-26).
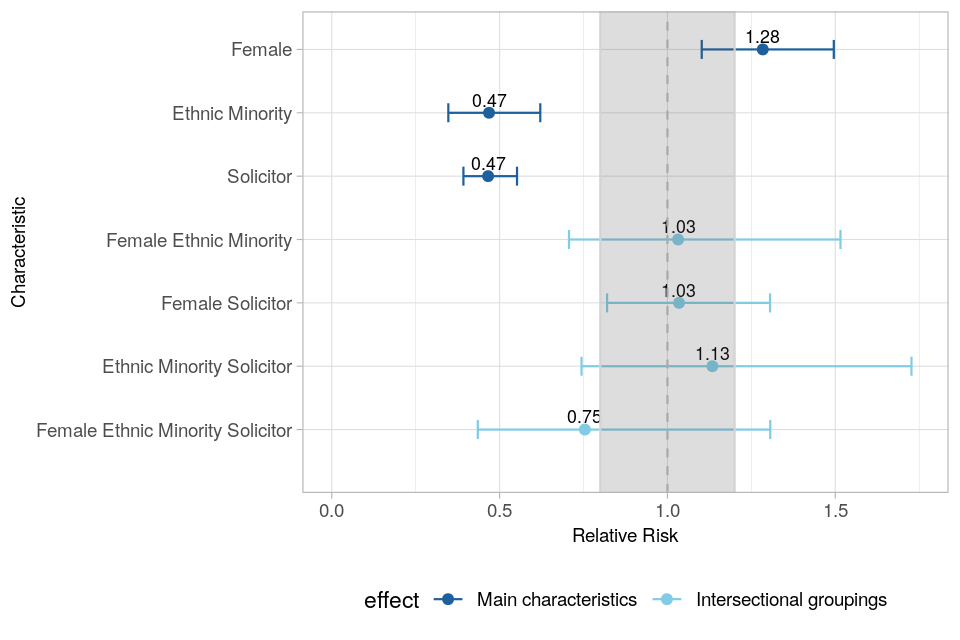
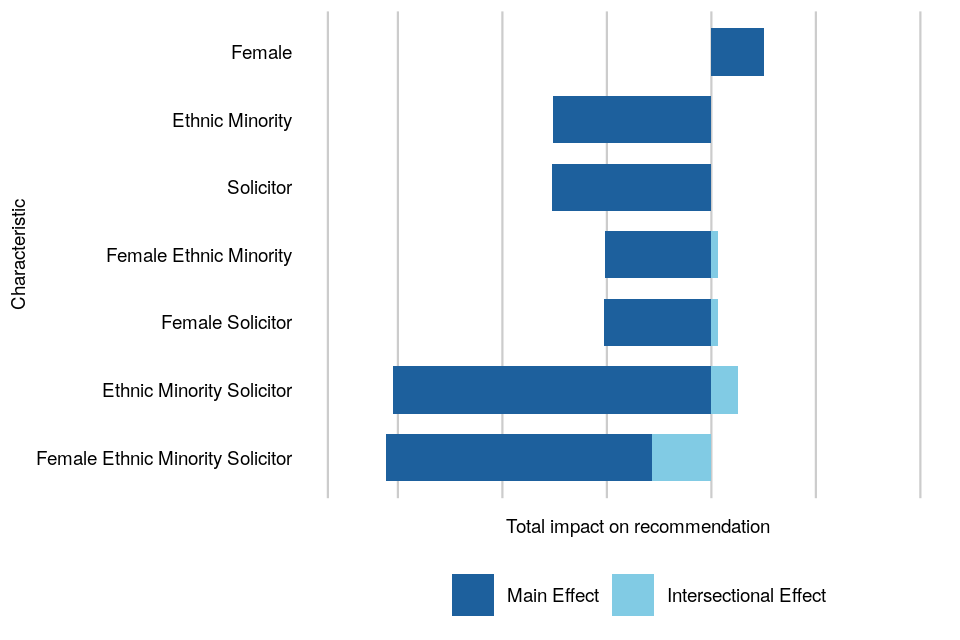
Figure 28 further illustrates this finding by combining main and intersectional effects. The scale used to combine the effects is different from relative risk and does not have a straightforward or intuitive interpretation, and therefore Figure 28 is presented without an x-axis. For each group, the graph captures how much of the total impact on recommendation from application is driven by main characteristics, and how much is driven by intersectionality. It shows how for candidates with multiple underrepresented attributes, recommendation is largely explained by the effects of each main characteristic, rather than their intersectional effect.
Figure 28: Combined impact of main and intersectional characteristics on recommendation (legal exercises completed between 2023-24 and 2025-26).
Significance explanation
Why do we say that there is no significant evidence of intersectionality, despite reporting small associations?
When measuring intersectionality, we calculate the associated effect of each grouping on the likelihood of recommendation, in comparison to White male barristers:
- Female ethnic minorities: 3% increase in the odds of recommendation.
- Female solicitors: 3% increase in the odds of recommendation.
- Ethnic minority solicitors: 13% increase in the odds of recommendation.
- Female ethnic minority solicitors: 25% decrease in the odds of recommendation.
We then calculate a confidence interval around each effect to reflect the fact that, if the same exercises were run again, outcomes might vary. The confidence interval gives us a range where we would expect to find the effect of each characteristic, or combination thereof, the next time their impact is assessed.
- Female ethnic minorities: Effect ranges from 29% decrease to 52% increase in the odds of recommendation.
- Female solicitors: Effect ranges from 18% decrease to 31% increase in the odds of recommendation.
- Ethnic minority solicitors: Effect ranges from 26% decrease to 73% increase in the odds of recommendation.
- Female ethnic minority solicitors: Effect ranges from 56% decrease to 31% increase in the odds of recommendation.
In Figure 27, for all four groups, the confidence interval crosses the 1.0 line, meaning that 0% is included in the range of possible effects on recommendation, but the ranges for the main effects do not. Given this, we cannot conclude that there is a statistically significant difference in recommendation rates between intersectional and non-intersectional candidates. For this reason, we conclude that there is no additional advantage or disadvantage in judicial appointment for having combined characteristics.
8.3 Judicial Office Holders
Half of the judiciary are White and male, and over a third are White and female. The remainder are equally ethnic minority male or ethnic minority female.
White male barristers are the largest sex-ethnicity-profession group in the judiciary and occupy most of the senior court posts.
Sex and Ethnicity
Judges in post
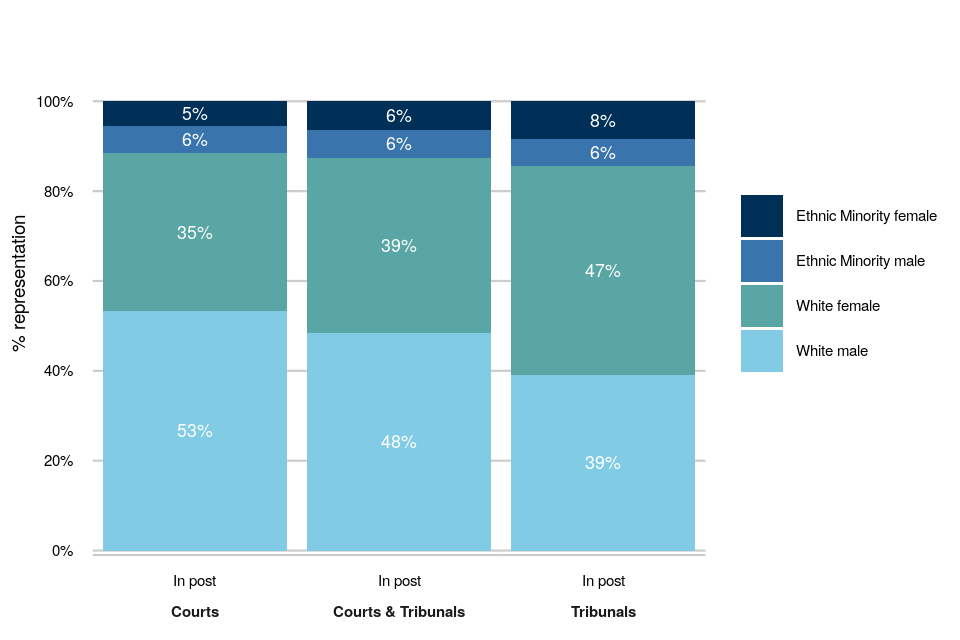
As at 1 April 2026, almost half (48%) of all court and tribunal judges were White and male (Figure 29).
A higher proportion of female tribunal judges were White (47%) or from an ethnic minority background (8%) compared to female court judges (35% and 5% respectively).
Figure 29: Representation of different sex-ethnicity groups in judges in post, April 2026
Patterns by type of appointment
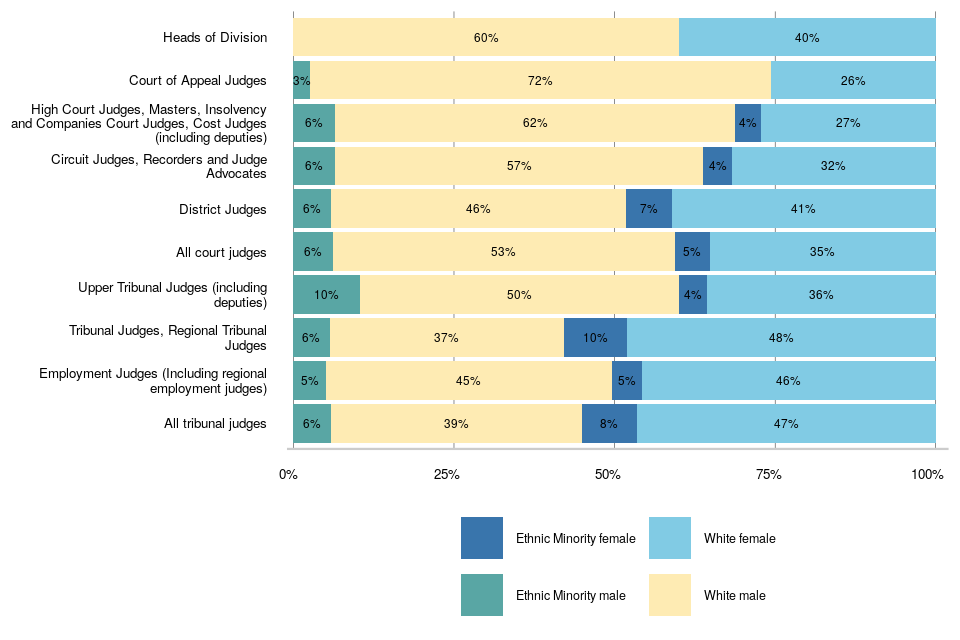
A majority (63%) of the more senior court judicial posts (High Court and above, including deputies) are held by White male judges (Table 3.3). Tribunal posts tend to be held by higher proportions of White female and ethnic minority female judges than court posts, except for the Upper Tribunal Judges including deputies (Figure 30).
Figure 30: Representation of sex-ethnicity groups by primary appointment, April 2026
Sex and Professional Background
Judges in post
As at 1 April 2026, male judges with a barrister professional background constituted 36% of all judges, 44% of court judges and 20% of tribunal judges[footnote 37] (Figure 31).
Considerably more tribunal judges were female with a solicitor professional background (34%) compared to court judges (14%).
Figure 31: Representation of different sex-profession groups for judges in post, April 2026

Figure 31 and table 3.3 show that the sex split amongst former barristers is more apparent among court judges (44% male:25% female) compared to tribunal judges (20%:19%). However, the sex split amongst former solicitors is greater in tribunal judges (24% male:34% female) compared to court judges (16%:14%).
Patterns by type of appointment
A substantial majority of the more senior court judicial posts (High Court and above, including deputies) are held by male judges with a barrister background (Figure 32). Tribunal posts tend to be held by higher proportions of male and female former solicitors than court posts.
Figure 32: Representation of sex-profession groups by primary appointment, April 2026

Ethnicity and Professional Background
Judges in post
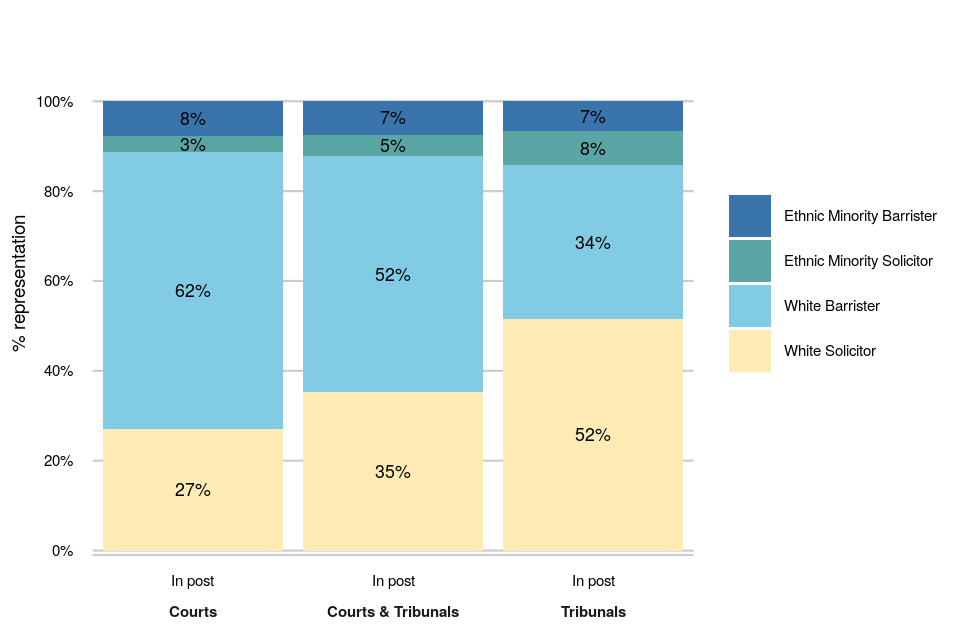
As at 1 April 2026 White individuals with barrister professional backgrounds made up over half (52%) of all judges (Figure 33).
Ethnic minority and White individuals with solicitor professional backgrounds constituted proportionally twice as many tribunal judges (7% and 50%) as they did court judges (3% and 27% respectively).
Figure 33: Representation of different ethnicity-profession groups in judges in post, April 2026
Patterns by type of appointment
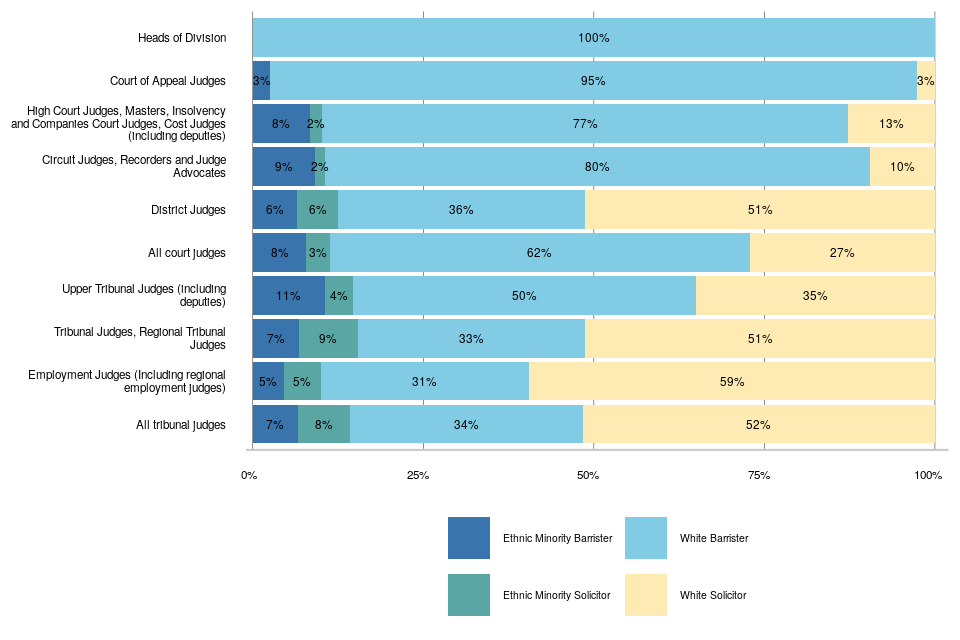
The majority (80%) of the more senior court judicial posts (High Court and above, including deputies) are held by White former barristers (Table 3.3). White barristers represented 61% of all court judges but only 33% of all tribunal judges.
Figure 34: Representation of ethnicity-profession groups by primary appointment, April 2026
Sex, Ethnicity and Professional Background
Judges in post
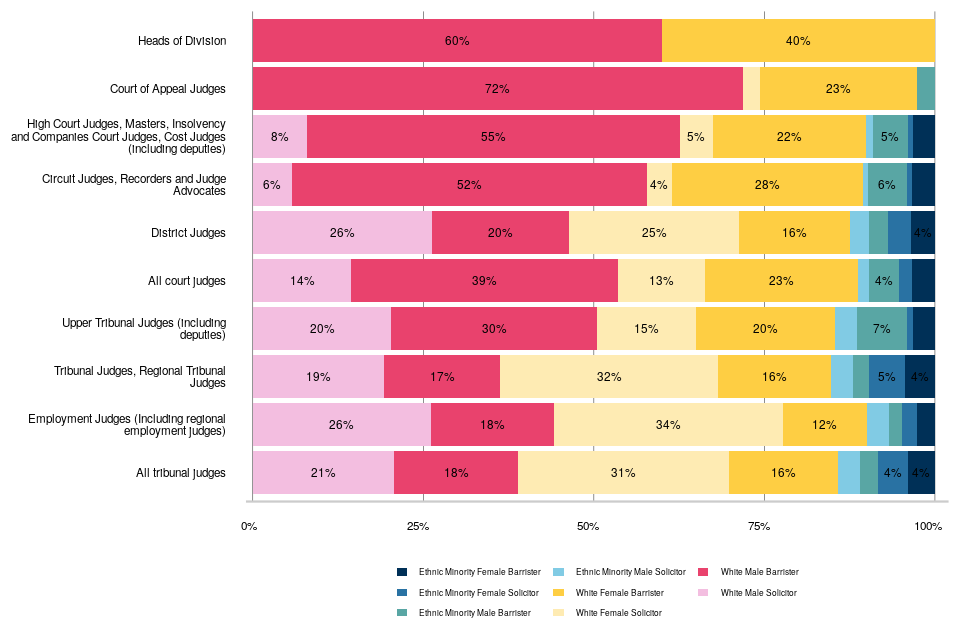
As at 1 April 2026 White male judges with a barrister professional background constituted a third (32%) of all judges overall (Figure 35).
Most of the remainder constituted White male former solicitors (16%) and White female former barristers or solicitors, who each made up around a fifth of all judges.
Figure 35: Representation of different sex-ethnicity-profession groups amongst judges in post, April 2026

Figure 36: Representation of sex-ethnicity-profession groups by primary appointment, April 2026
9. Age
9.1 Legal Professions
As at 1 April 2026, 41% of barristers, 31% of solicitors and 40% of Chartered Legal Executives were aged 50 or over.
Post Qualification Experience and seniority
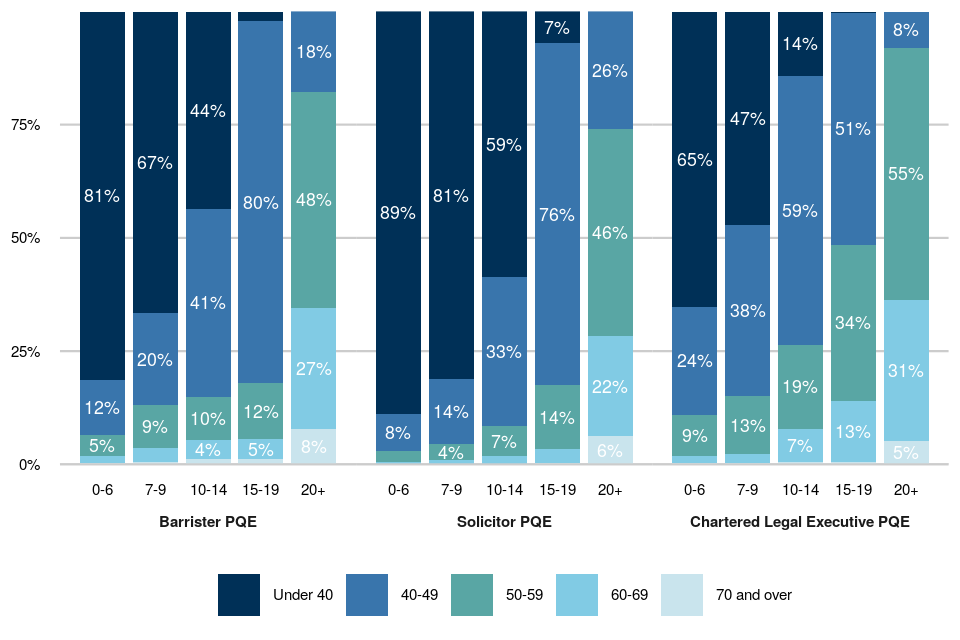
Predictably, post qualification experience in legal professionals is strongly associated with age (Figure 37). As at 1 April 2026, of those at a senior level with 15 or more years’ experience, 68% of barristers, 57% of solicitors and 75% of Chartered Legal Executives were aged 50 and over (Table 1.1).
Figure 37: Age group for different levels of post-qualification experience in the legal professions, April 2026.
9.2 Judicial Appointments: Applications and Selections
Older applicants have lower recommendation rates than younger applicants, with 71% of those recommended aged under 50.
Age is strongly correlated with experience and, as a result, it is less insightful to make comparisons between recommendation rates based on age than for other characteristics. Although figures are broken down by age group, we do not conduct relative comparisons of rates of recommendation.
Overall View
Overall, the representation of candidates aged over 50 in legal exercises completed in 2025-26 at application was 42%. This decreased between application and shortlisting to 39%, and then from shortlisting to recommendation for appointment to 29% and meant that 71% of those recommended were aged under 50.
Exercise-specific Analysis
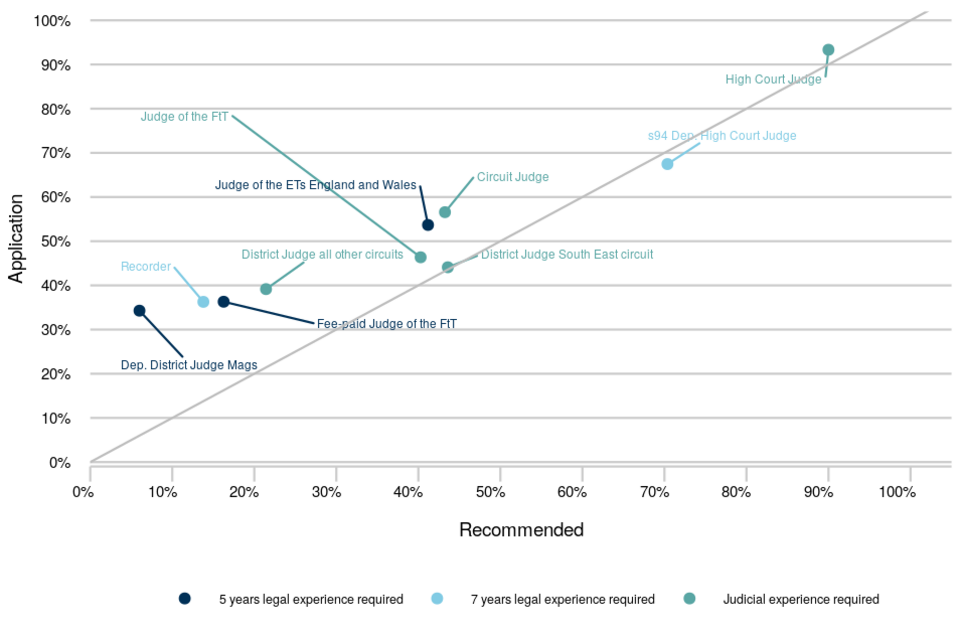
More senior roles typically require greater experience, and therefore the proportion of applications and recommendations who are aged 50 and over broadly increases with seniority of post (Figure 38).
Exercises in which representation of those aged 50 and over decreased from application to recommendation are those shown above and to the left of the diagonal line in Figure 38. The proportion of individuals aged 50 and over tends to decrease between the application and recommendation for appointment stages - for example, for Circuit Judges, it dropped from 57% to 44% respectively.
Figure 38: Proportion of applications and recommendations aged 50 and over for each large legal exercise in 2025-26, color coded by years of experience required per exercise.
9.3 Judicial Office Holders
Most court and tribunal judges were aged 50 and over, with 6% aged 70 and over.
Judges in post
As at 1 April 2026, two-thirds (67%) of judges were aged 50 and over - with similar proportions in the courts (69%) and tribunals (63%). In courts and tribunals 6% and 5% respectively of judges were aged 70 and over[footnote 38].
New entrants and Leavers
Not unexpectedly, for judges in both courts and tribunals over three-quarters (78%) of new entrants to the judiciary in 2025-26 were aged under 50, whilst the majority (94%) of those leaving the judiciary were aged 50 and over.
Patterns by type of appointment
Predictably for courts and tribunals, the proportion of those in the older age groups was generally higher among more senior posts (Figure 39).
Figure 39: Representation of ages 50 and over among court and tribunal judges by appointment, 1 April 2026.

10. Other Characteristics
Disability: For legal exercises overall, candidates with a disability had the same recommendation rate from application as candidates without a disability. Of judges in post who had declared their disability status, one in ten reported themselves as disabled.
Socio-economic background: A third of barristers had attended a UK independent or fee-paying school, whilst 9 of every 10 Chartered Legal Executives had attended a UK state school.
Sexual orientation: Across all legal exercises, candidates who declared themselves as lesbian, gay, bisexual or other sexual orientation had a slightly higher recommendation rate from application compared to those who declared themselves heterosexual.
This section presents statistics where available for other diversity characteristics – disability, socio-economic background, sexual orientation and religion. As of this year’s report, figures on sexual orientation and religion have been included for judges in post, barristers and Chartered Legal Executives. Additionally, data on schooling has also been included for judges in post. As equivalent data for solicitors is not yet available[footnote 39], it is not possible to produce analyses of recommendation rates compared to the eligible pools for judicial selection exercises, as produced for other characteristics.
Disability
As at 1 April 2026, 10% of barristers and 7% of Chartered Legal Executives who had declared their disability status (declaration rates of 66% and 96% respectively) said they were disabled.
Across all legal exercises in 2025-26, candidates with a disability represented 13% of applications and 13% of recommendations made, leading to the same recommendation rate from application as candidates without a disability (11%)[footnote 40].
As at 1 April 2026, 11% of all judges (8% in courts and 15% in tribunals) who had declared their disability status (declaration rate of 70%) reported that they were disabled, compared to 10% overall for the previous year. Of the judges who newly entered or were promoted during the year, 9% of each were disabled.
Socio-economic background
As at 1 April 2026, 59% of barristers and 90% of Chartered Legal Executives who had declared (declaration rates of 62% and 89% respectively) said they had attended a UK state school. In comparison, 33% of barristers and 7% of Chartered Legal Executives had attended a UK independent or fee-paying school.
For all legal exercises in 2025-26, individuals who attended a UK state school had a slightly lower recommendation rate from application (11%) compared to those who attended a UK independent or fee-paying school (13%). Table 2.2 shows that 72% of applications and 71% of those recommended attended a UK state school, compared to 21% and 24% respectively for those who attended a UK independent or fee-paying school.
Applicants who reported that neither of their parents had attended university to gain a degree had a lower recommendation rate from application (10%) compared to those who reported that one or both of their parents had attended university (14%). This is also shown by the drop in representation from 61% of applications to 54% of recommendations for those who reported that neither of their parents had attended university.
For all legal exercises completed in 2025-26, applicants from a lower socio-economic background (based on the occupation of the main household earner when the candidate was aged 14) had a lower recommendation rate (8%), compared to those applicants with a professional or intermediate socio-economic background who had rates of 14% and 10% respectively. This is also shown by the drop in representation from 28% of applications to 20% of recommendations for those from a lower socio-economic background.
As at 1 April 2026, two-thirds (66%) of all judges who had declared, said that they had attended a UK state school (selective or non-selective)[footnote 41]. For court judges this figure was 64% and for tribunal judges it was 71%.
Sexual Orientation
As at 1 April 2026, 8% of barristers and 3% of Chartered Legal Executives had declared themselves to be lesbian, gay, bisexual or other sexual orientation (declaration rates of 60% and 92% respectively).
Across all legal exercises in 2025-26, candidates who declared themselves to be lesbian, gay, bisexual or other sexual orientation represented 7% of applications and 9% of recommendations made. This meant that lesbian, gay, bisexual or other candidates had a slightly higher recommendation rate from application (14%) compared to those who declared themselves to be heterosexual (11%).
As at 1 April 2026, 7% of all judges (6% in courts and 9% in tribunals) who had declared their sexual orientation (declaration rate of 69%) reported that they were lesbian, gay, bisexual or other sexual orientation.
Religion or belief
As at 1 April 2026, half (50%) of those Chartered Legal Executives who had declared their religion said they were Christian, with 42% declaring no religion or belief.
For all legal exercises in 2025-26, the religion or belief with the largest representation among applications was Christian (43%) followed by individuals who declared no religion or as atheist (37%). These positions were reversed when looking at recommendations, with those candidates who declared no religion/atheist representing the largest proportion (46%) followed by those who were Christian (42%).
For those groups with 10 or more recommendations, the recommendation rates from application ranged from 5% for Sikh candidates and 6% for Muslim candidates, to 14% for no religion/atheist candidates, with Christian candidates at 11%.
As at 1 April 2026, half (49%) of all judges who had declared their religion (declaration rate of 69%) said they were Christian, with 40% declaring no religion or belief, and 4%, 3%, 2% and 1% declaring themselves Jewish, Muslim, Sikh and Hindu respectively.
11. Judges sitting in retirement
In comparison to judges, a lower proportion of court judges and tribunal judges sitting in retirement are female or from an ethnic minority background, but a higher proportion have a non-barrister background.
Sitting in retirement is the policy which permits certain judges to retire, draw their pension, and continue to sit as a fee-paid judge, if there is a business need to do so, up to the mandatory retirement age of 75.[footnote 42]
There were in total 249 judges sitting in retirement (158 in courts and 91 in tribunals) in England and Wales as at 1 April 2026, with an additional four non-legal tribunal members sitting in retirement (Table 3.5).
11.1 Sex
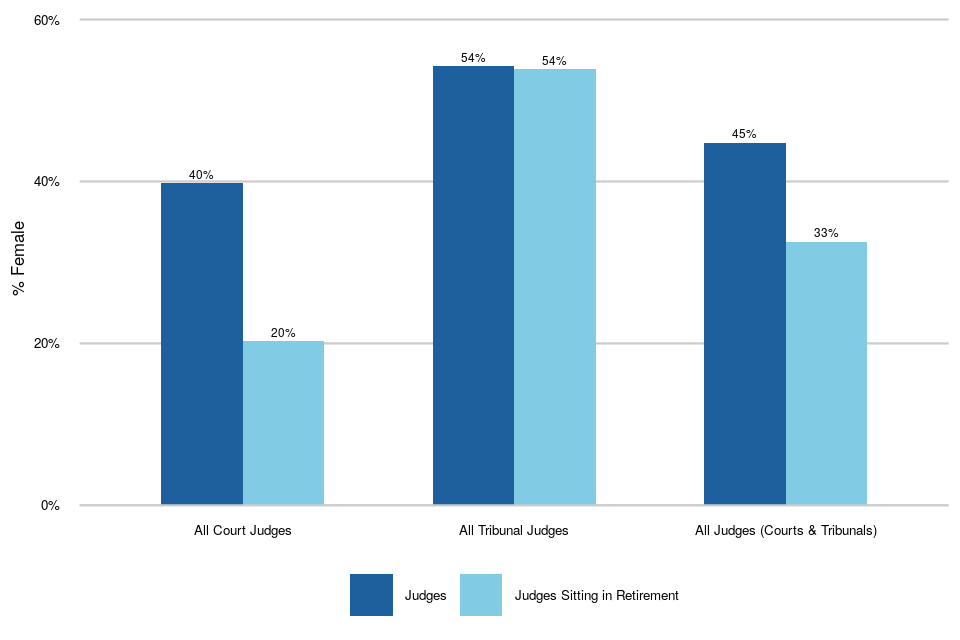
As at 1 April 2026, a fifth (20%) of all court judges sitting in retirement were female, and for tribunal judges sitting in retirement it was over half (54%) (Figure 40).
Figure 40: Representation of female court and tribunal judges sitting in retirement, 1 April 2026.
11.2 Ethnicity
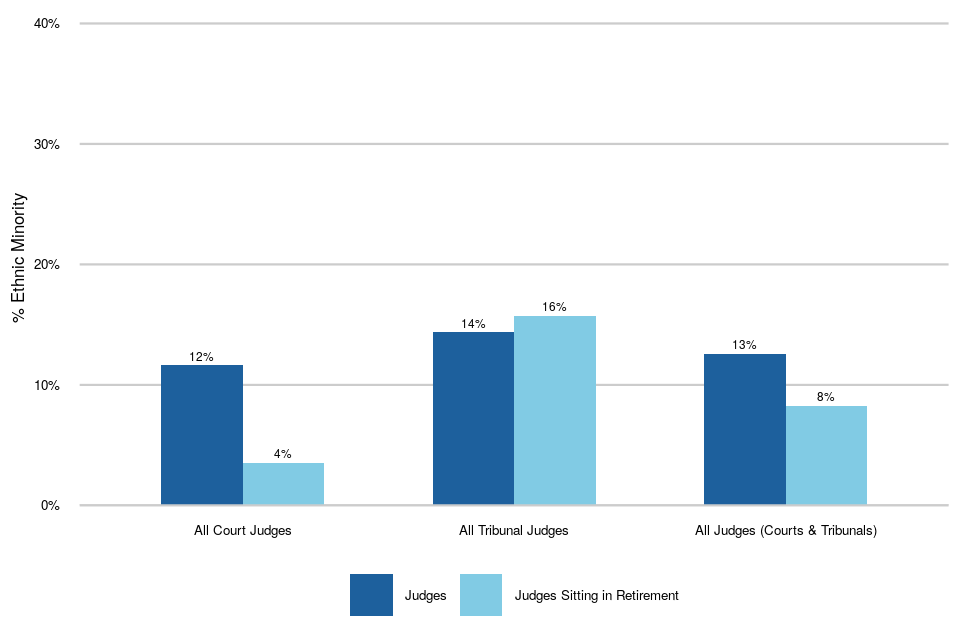
Ethnic minority individuals constituted 4% of all court judges sitting in retirement, and 16% of all tribunal judges sitting in retirement (Figure 41).
Figure 41: Representation of ethnic minorities among court and tribunal judges sitting in retirement, 1 April 2026.
11.3 Professional Background
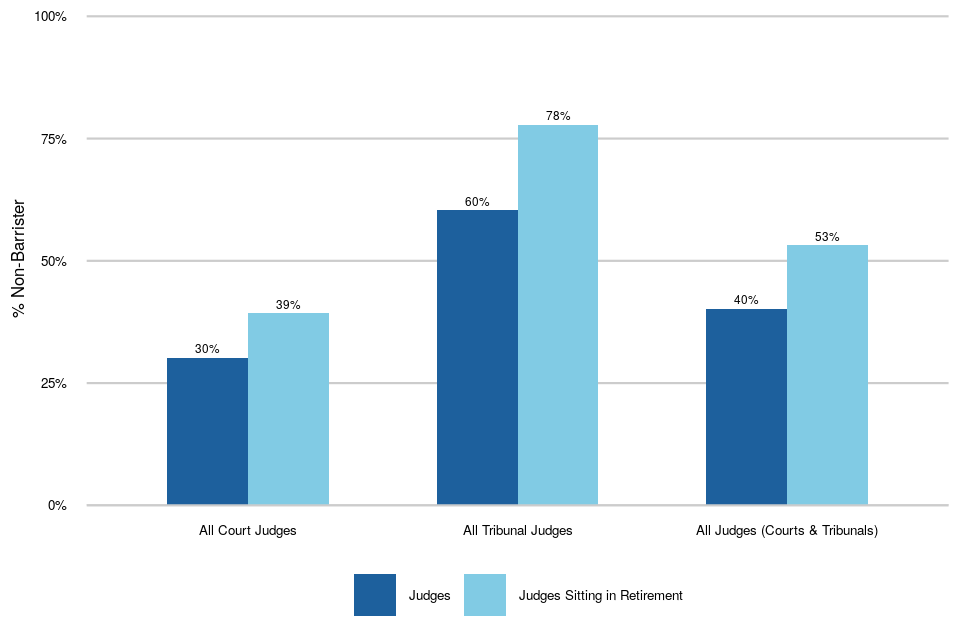
As at 1 April 2026, non-barristers constituted under half (39%) of all court judges sitting in retirement, and over three-quarters (78%) of all tribunal judges sitting in retirement (Figure 42).
Figure 42: Representation of non-barristers among court and tribunal judges sitting in retirement, 1 April 2026.
11.4 Age
Overall, just over half (51%) of all the judges sitting in retirement as at 1 April 2026 were aged 70 or over. The proportion was higher in the courts (62%) than it was for those in tribunals (33%).
11.5 Other characteristics
The declaration rates for disability, school attended, sexual orientation and religion for judges sitting in retirement were not at the 60% level required for statistical confidence in presenting analysis in this report.
12. Non-legal tribunal members
Compared with judges, a higher proportion of non-legal members are female, or from an ethnic minority background.
There was no evidence of a disparity of outcomes between female and male candidates, nor between White and ethnic minority candidates in non-legal selection exercises completed in 2025-26.
Sections 12 to 14 cover roles which do not require a legal background, that is magistrates and non-legal members in tribunals. This compares with preceding sections which focus on legal professions, selections for judicial posts requiring legal experience and judges in post. While non-legal posts have eligibility criteria (for example, membership of an appropriate professional body), it is currently too complex and difficult to produce estimates of the eligible pool.
12.1 Appointments for Non-Legal Tribunal Members
Sex
Across all non-legal exercises in 2025-26 female candidates represented over half of applications (59%) and recommendations (61%), resulting in an estimated RRI value of 1.09, indicating a small difference which was neither practically nor statistically significant. This suggests that there was no evidence of a disparity in recommendation rates from application between female and male candidates for this year.
Ethnicity
Ethnic minority individuals constituted 40% of applications and 35% of the recommendations for all non-legal exercises completed in 2025-26. For context, ethnic minorities make up 17% of the working age (25 to 74) population as of the 2021 census. The likelihood of recommendation from application for ethnic minorities was 19% lower than White candidates, a difference which was neither practically nor statistically significant, suggesting no evidence of any disparity in recommendation rates from application.
Of the ethnic minority sub-groups for which an RRI could be produced, the likelihood of recommendation from application was an estimated 22% and 21% lower for Asian and Black compared to White candidates respectively. However, these differences were not statistically significant suggesting no evidence of a disparity of outcome.
Age
Across all non-legal exercises overall in 2025-26 those aged 50 or over accounted for 44% of the applications. This dropped to 36% of those recommended for appointment.
Disability
Candidates who declared themselves to have a disability constituted 17% of the applications and 17% of recommendations for all non-legal exercises completed in 2025-26. This produced an estimated RRI value of 0.97, suggesting no evidence of a disparity of outcomes between disabled and non-disabled candidates when comparing recommendation rates from application.
Socio-economic background
Across all non-legal exercises in 2025-26, candidates who attended a UK state school had a slightly lower recommendation rate from application (32%) compared to those who attended a UK independent or fee-paying school (36%).
Candidates who reported that neither of their parents had attended university to gain a degree had a lower recommendation rate from application (29%) compared to those who reported that one or both of their parents had attended university (39%).
For all non-legal exercises completed in 2025-26, applicants from a working class or lower socio-economic background had a recommendation rate of 28%, compared to those applicants with a professional or intermediate socio-economic background who had rates of 35% and 31% respectively.
12.2 Non-Legal Tribunal Members in post
Sex
Over a half (59%) of all non-legal members of tribunals as at 1 April 2026 were female, compared with 45% for all judges. As with the judges, the proportion has been increasing since 2015 (see Table 3.4).
This is partly reflected in the higher proportion of new entrant tribunal members during 2025-26 who were female (68%).
Ethnicity
As at 1 April 2026 ethnic minority individuals represented a higher proportion (18%) of non-legal tribunal members, compared to that for all judges (13%). Like the statistics concerning the sex of non-legal tribunal members in post, these have been gradually increasing over the last decade.
Those of an ethnic minority background were nearly twice as likely to be a medical tribunal member compared to White colleagues (54% compared to 29%), but half as likely to be a disability tribunal member (10% compared to 17%).
Intersection of Sex and Ethnicity
A third (31%) of all non-legal tribunal members as at 1 April 2026 were White and male, compared to nearly half (48%) of all judges, whilst half (51%) of all non-legal members were White and female.
Male and female ethnic minority groups also represented a higher proportion of non-legal members (9%) than they did of all judges (6%) - see table 3.3.
Age
Non-legal members tended to be older than judges on average, with 82% of those in post being 50 and over, compared to the 67% for all judges.
During 2025-26, for non-legal tribunal posts, over half (63%) of new entrants were aged 50 and over, but for those leaving it was much higher, at 93%.
Disability
As at 1 April 2026, 25% of non-legal tribunal members who had declared their disability status (declaration rate of 60%) said they were disabled, compared to 11% for all judges. More than half (58%) of those non-legal members in the Disability tribunal had declared themselves disabled.
Socio-economic background
As at 1 April 2026, nearly three-quarters (73%) all non-legal members who had declared, said that they had attended a UK state school (selective or non-selective)[footnote 41], compared to 66% for all judges.
Other characteristics
The declaration rates for sexual orientation and religion for non-legal members were not at the 60% level required for statistical confidence in presenting analysis in this report.
13. Magistrates in Post
In comparison to judges, a higher proportion of magistrates are female, but the proportion from an ethnic minority background is more similar.
Sex
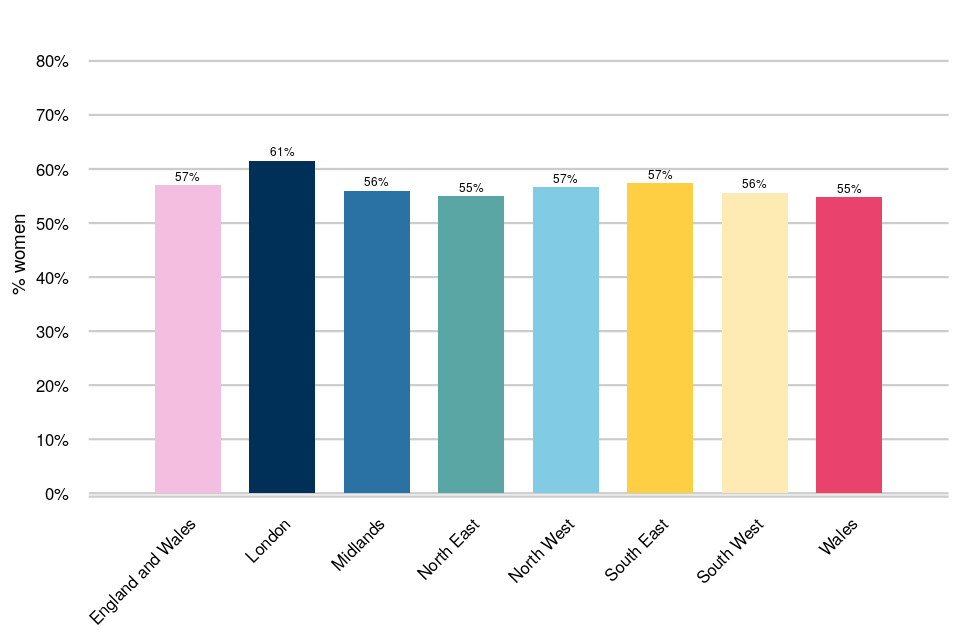
Of the 15,259 magistrates in post across England and Wales as at 1 April 2026, 57% were female (four percentage points higher than in 2016). There was no strong variation amongst the regions, ranging from 55% to 62% (Figure 43).
Figure 43: Proportion of female magistrates by region, 1 April 2026
Ethnicity
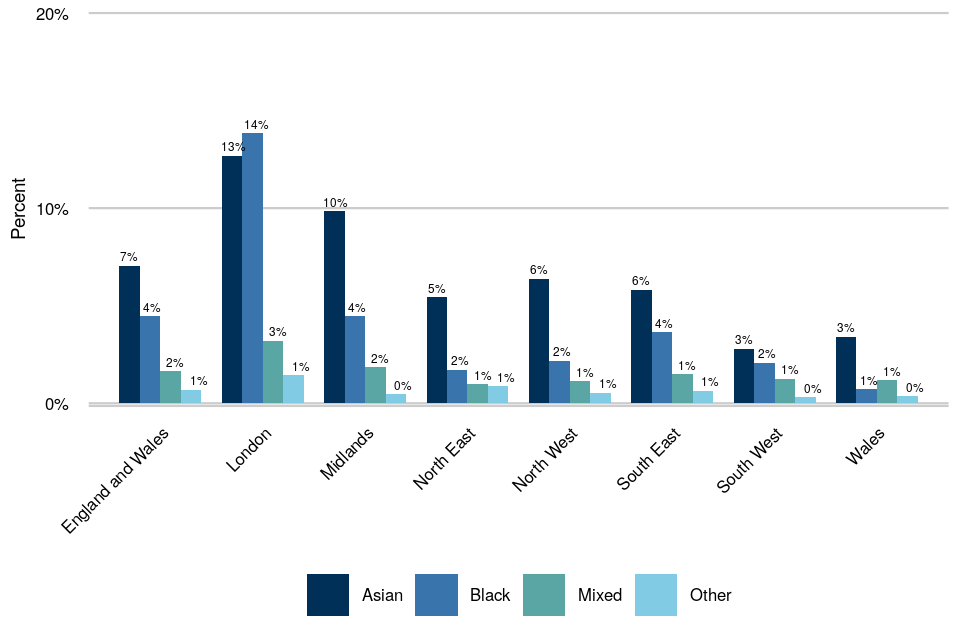
As at 1 April 2026, ethnic minority individuals together constituted 14% of all magistrates (a three percentage-point increase from 2016 when 11% declared themselves as from an ethnic minority). More specifically for each ethnic minority group[footnote 43]:
- Asian individuals constituted 7% of magistrates.
- Black individuals constituted 5% of magistrates.
- Mixed ethnicity individuals constituted 2% of magistrates.
- Individuals from other ethnicities constituted 1% of magistrates.
These proportions showed some variation at a regional level, where London had the highest proportion for each ethnic minority group, and specifically for Black individuals it had at least treble the proportion compared to all other regions (Figure 44).
Figure 44: Proportion of magistrates from each ethnic minority group by region, 1 April 2026
Intersection of Sex and Ethnicity
Table 3.7 shows that just under half (48%) of all magistrates as at 1 April 2026 were White and female. This was followed by the White male group with 38%, and then the ethnic minority female and ethnic minority male groups (9% and 6% respectively).
Age
Magistrates tended to be older than judges on average, with 81% of those in post being 50 and over (67% for all judges).
13.1 Magistrates - leavers and new entrants
The proportion of magistrates that left during 2025-26 who were female (53%) was slightly lower than the equivalent proportion of new entrants during the same period, at 55%.
Of those magistrates who left during 2025-26 the proportion who were from an ethnic minority background (9%) was lower than the equivalent proportion of new entrants during the same period, at 17%.
14. Magistrates Recruitment
On 17 January 2022, an updated magistrates’ recruitment process was launched. This update introduced a new applicant tracking system (ATS) which collects information on magistrate recruitment across England and Wales and includes more diversity data on applicants and those appointed to the magistracy.
This is the fourth year for which ATS magistrates’ recruitment data is being published. Please note that figures for both the number of applications started, as well as the number of applications concluded in the year are presented in the tables. The latter is made up of those not shortlisted, not appointed and appointed during the year, and therefore will be in contrast to and not comparable with the number of applications started in the year[footnote 44].
Please note that two annexes have been published alongside this year’s report relating to magistrates recruitment. The first (Annex A) provides analysis of candidate drop-out rates during the magistrate appointment process, by diversity characteristic. The second (Annex B) gives notice of a new quarterly report on the number of magistrate appointments, beginning with April-June 2026-27.
The proportions of female individuals and ethnic minority individuals appointed to the magistracy are comparable to those already in post.
14.1 Applications
Table 3.8b shows that during the year 2025-26, there were 10,390 applications made to become a magistrate[footnote 45]. This is more than double the number of applications made in the previous year (4,717)[footnote 46]
Sex
Just under half (49%) of all magistrate applications submitted in 2025-26 were from female individuals, comparable to the 57% of magistrates already in post. There was some variation by region where the proportion of female candidates ranged from 45% for the Midlands to 52% for London (Figure 45).
Figure 45: Proportion of female magistrate applications submitted in 2025-26, by region
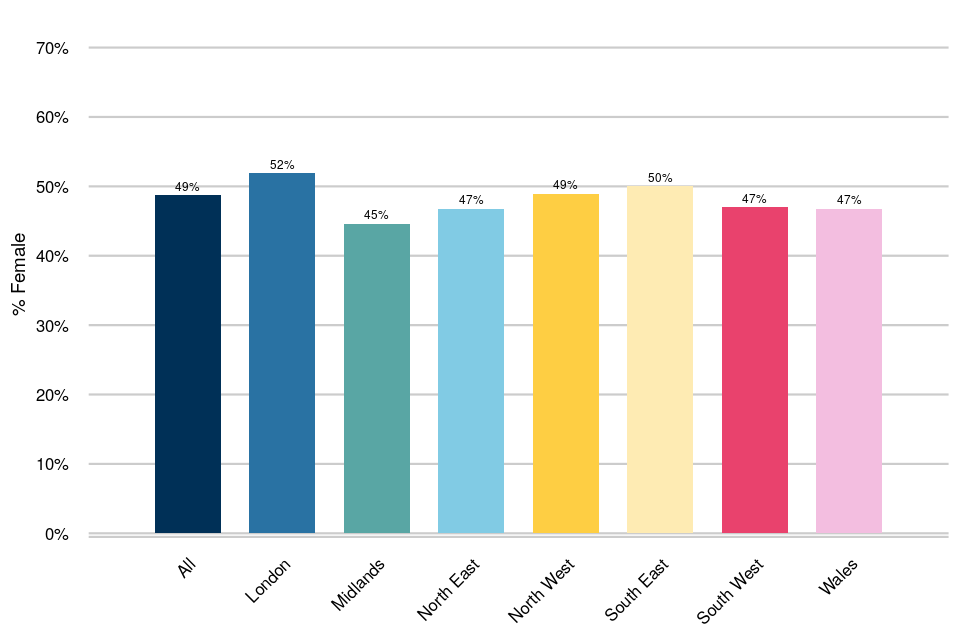
Ethnicity
In total, ethnic minority individuals constituted about 26% of all magistrate applications submitted in 2025-26, almost twice as high as the 14% of magistrates in post. Table 3.9b shows a wide variation in the proportion of ethnic minority applicants at the regional level, from 10% in the South West to 43% in London.
More specifically, Figure 46 shows for England and Wales that[footnote 47]:
- Asian individuals constituted 13% of applications.
- Black individuals constituted 8% of applications.
- Mixed ethnicity individuals constituted 3% of applications.
- Individuals from other ethnicity backgrounds constituted 1% of applications.
Figure 46: Representation of ethnic minorities among magistrate applications submitted in 2025-26, by region
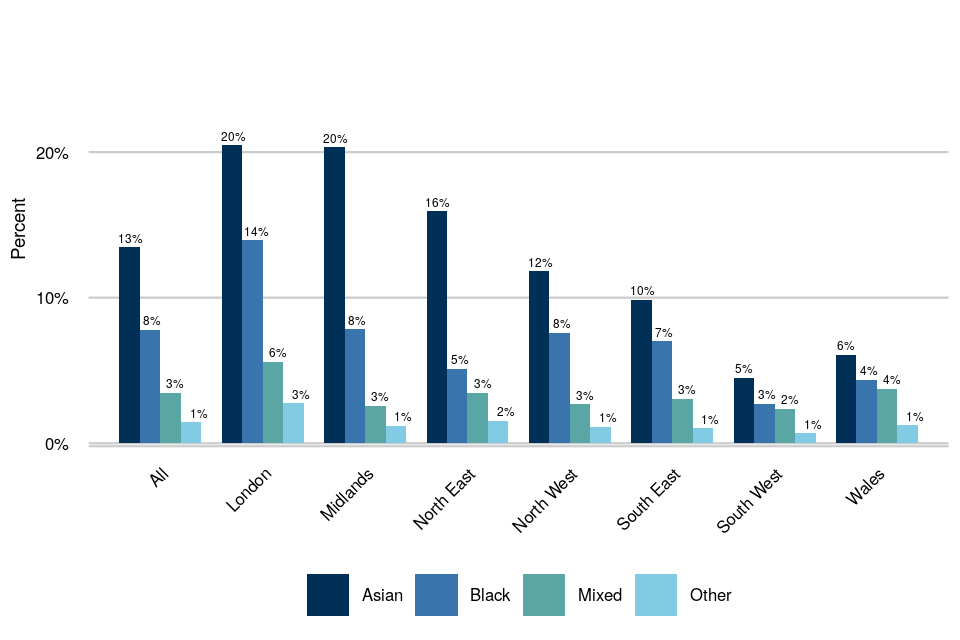
Age
On average, those who applied to the magistracy in 2025-26 were younger than magistrates currently in post. Over half (60%) of magistrate applications were from candidates aged 50 or over, compared to 81% of magistrates in post.
14.2 Appointments
Table 3.8 shows that during 2025-26, 1,657 appointments to the magistracy were made in England and Wales[footnote 48], compared to 894 appointments made during 2024-25.
Sex
Female individuals represented 55% of all magistrate appointments made in 2025-26, compared to 58% in the previous year. The female proportion of appointments by region ranged from 49% in the North West to 62% in the Midlands (Figure 47).
Figure 47: Proportion of female magistrate appointments made in 2025-26, by region
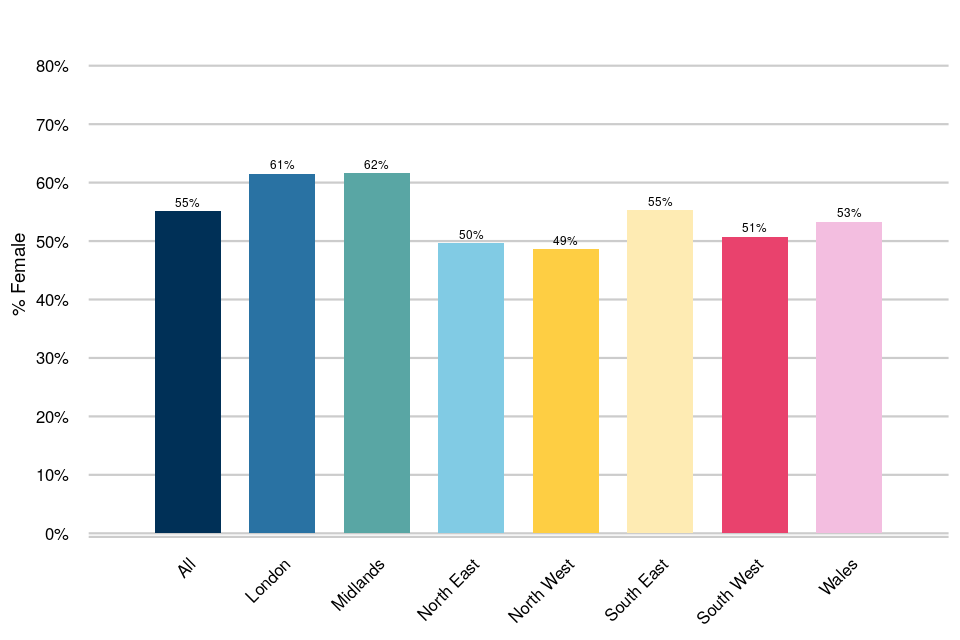
Ethnicity
In total, ethnic minority individuals constituted 17% of all magistrate appointments made in 2025-26, compared to 23% in the previous year. More specifically for 2025-26[footnote 49]:
- Asian individuals constituted 8% of appointments.
- Black individuals constituted 5% of appointments.
- Mixed ethnicity individuals constituted 4% of appointments.
- Individuals from other ethnicity backgrounds constituted 1% of appointments.
By region, the proportion of those appointed who were from an ethnic minority background ranged from 8% for the North West, South West and Wales to 32% for London (Figure 48).
Figure 48: Representation of ethnic minorities among magistrate appointments made in 2025-26, by region
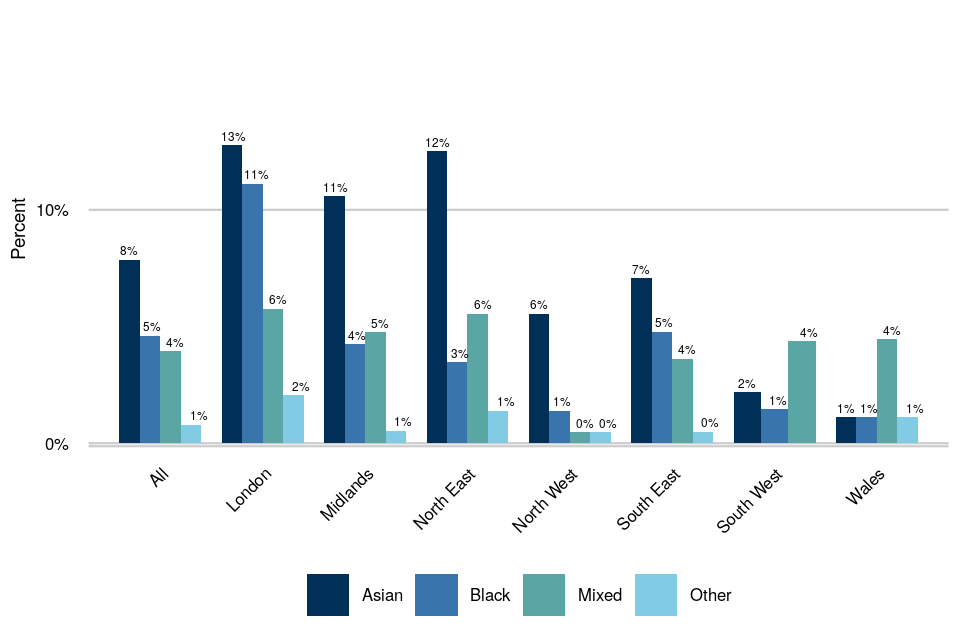
Age
Of all the magistrates appointed in 2025-26, 64% of them were aged 50 or over.
15. Further Information
15.1 Accompanying Files
As well as this publication, the following products are published as part of this release:
- A supporting guide providing further information on how the data is collected and processed, and including information about the quality of the statistics in relation to their use.
- A set of data tables, providing more detailed statistics on the legal professions, judicial appointments, judicial office holders, magistrates and magistrate appointments.
- An interactive dashboard, providing time series data on the legal professions, judicial appointments, judicial office holders and magistrates.
15.2 Official Statistics Status
Our statistical practice is regulated by the Office for Statistics Regulation (OSR).
OSR sets the standards of trustworthiness, quality and value in the Code of Practice for Statistics that all producers of official statistics should adhere to.
You are welcome to contact us directly with any comments about how we meet these standards.
Alternatively, you can contact OSR by emailing email regulation@statistics.gov.uk or via the OSR website.
15.3 Future Publications
Our statisticians regularly review the content of publications. As part of our continual review and prioritisation, we welcome user feedback on existing outputs including content, breadth, frequency, and methodology. Please send any comments you have on this publication including suggestions for further developments or reductions in content.
Next update: scheduled for July 2027
15.4 Contact
Enquiries and feedback on these statistics should be directed to the Analysis Directorate at the Ministry of Justice:
Wincen Lowe - email judicial.statistics@justice.gov.uk
Media or other queries on the wider policy implications of these statistics should be directed to the relevant contact:
Judicial appointments: Reece Pope - email diversity@judicialappointments.gov.uk or communications@judicialappointments.gov.uk
Judiciary: Katy Durrans - email Katy.Durrans@judiciary.uk or press.enquiries@judiciary.uk
-
With accompanying tables for detailed figures. ↩
-
7,767 are in the current practising grade of CILEX membership. The remainder are in a non-practising grade or grade where they are dual qualified as a solicitor or a licensed conveyancer. ↩
-
For the purposes of the diversity statistics, the application comprising the one additional recommendation made in exercise JAC00181A Fee-paid Disability Qualified Tribunal Member has been counted twice (once in the original exercise, and once when recorded for additional recommendations). Therefore, other sources may show 5,801 total applications for 2025-26. ↩
-
Candidates are selected for current vacancies under Section 87 of the Constitutional Reform Act and for vacancies that may arise in the foreseeable future under Section 94. There were 113 recommendations to a list for future potential appointment under Section 94 in 2025-26. ↩
-
Details of the Crime and Courts Act can be found here: https://www.legislation.gov.uk/ukpga/2013/22/schedule/13/enacted ↩
-
EMP was applied at the shortlisting stage 7 times within 5 exercises, with EMP being applied twice in two exercises. EMP was applied at the final decision making stage on 4 occasions in 4 exercises. ↩
-
Note that holding a senior position in the legal profession is not necessarily a good predictor of whether someone is more likely to be appointed to a judicial role. ↩
-
Actual percentages will be lower. This is because the calculations do not include the majority of recently qualified (0-6 years PQE) solicitors who have not as yet declared. ↩ ↩2 ↩3
-
The declaration rate for sex for solicitors in PQE band 0-4 is below the required level for analysis, and so the representation percentage has been excluded from this publication. ↩
-
Currently sex is only reported in a binary way (i.e. with categories “male” and “female”). Those who left the question unanswered and those who chose ‘prefer not to say’ are grouped as “unknown”. The category “Other” was introduced within the JAC sex data in 2020, but there are insufficient numbers to publish these counts separately without risking disclosure of sensitive information. The few candidates who did choose the “Other” sex option have therefore been grouped in unknown, though this reporting may change in future years if there are sufficient numbers. ↩
-
Those who do not disclose their sex or declare “Other” are excluded when calculating proportions. ↩
-
To produce an estimate combined across all legal exercises with differently sized eligible pools, a weighting was made by the number of recommendations for each exercise. ↩
-
Please see the accompanying User Guide for more details and explanation about RRIs, and statistical and practical significance. ↩ ↩2 ↩3 ↩4 ↩5 ↩6
-
The RRI figures in this chapter provide an estimate of the overall effect of the characteristic, rather than isolating its specific effects independent of any other factors. Analyses separating out the different effects of multiple characteristics for recommendation rates from application can be found in Chapter 8 on Intersectionality. ↩
-
RRIs cannot be calculated when the number of recommendations is less than 10. ↩
-
Figures are calculated exactly and then rounded to the nearest whole number for presentation in the report. ↩ ↩2 ↩3
-
Based on the 2021 Census, 51% of the England and Wales population was female and aged 25-74. This age group is used as it covers the range from the minimum age at which judges are likely to be appointed to the maximum retirement age (75). Estimates based on data from the 2020 Annual Population Survey provide a statement of the economically active population (aged 16 and over who are either employed or looking for work) in England and Wales, which show a comparative figure of 47% of the economically active population (EAP) in England and Wales being female. ↩ ↩2
-
Including deputy and vice presidents. This percentage only includes primary appointments and therefore does not consider Upper Tier Tribunal Presidents and the Employment Appeal Tribunal President as these are not primary appointments. ↩
-
Figures for ‘Heads of Division’, ‘Judge Advocates, Deputy Judge Advocates’ and ‘Regional Employment Judge’ are not shown as total numbers are small (under 10) and so percentages based on them are volatile and potentially misleading. ↩ ↩2 ↩3
-
The 2021 Census data suggests that 17% of the working age (25 to 74) population and 11% of the older 50-74 working age population in England and Wales are from ethnic minority backgrounds. Estimates based on data from the 2020 Annual Population Survey provide a statement of the economically active population (aged 16 and over) in England and Wales, which show a comparative figure of 14% of the economically active population (EAP) in England and Wales being from ethnic minority backgrounds. ↩
-
It is important to note that having a higher seniority position is not necessarily a good predictor of whether someone is more likely to be appointed to a judicial role. ↩
-
See Section 4 - Overview ↩
-
The ethnicity declaration rates for solicitors in PQE bands 0-4 and 5-9 (5-6 and 7-9 combined) are below the required level for analysis, and so the representation percentages have been excluded from this publication. ↩ ↩2
-
To produce an estimate combined across all legal exercises with differently sized eligible pools, a weighting was made by the number of recommendations for each exercise. ↩
-
Those that did not disclose their ethnicity are excluded when calculating proportions. ↩
-
‘Fp Ftt et Judge’ refers to Fee-paid Judge of the First-tier Tribunal and Fee-paid Judge of the Employment Tribunals. ↩
-
Where the confidence interval (represented by the arms extending from each dot) does not overlap the parity line (1 on the x-axis). ↩ ↩2
-
The 2021 Census data suggests that 17% of the working age (25-74) population and 11% of the older working age population (50-74) in England and Wales are from ethnic minority backgrounds. Estimates based on data from the 2020 Annual Population Survey provide a statement of the economically active population (aged 16 and over) in England and Wales, which show a comparative figure of 14% of the economically active population (EAP) in England and Wales being from ethnic minority backgrounds. ↩ ↩2
-
For the general population, ’70 and above’ is based on population aged 70-74. ↩
-
As introduced in the 2018-19 publication, where further detail is given. ↩
-
To prevent double counting, if an applicant has declared both a previous role of solicitor and barrister, a value of 0.5 has been assigned for both solicitor and barrister. When referring to “ever” solicitor or “ever” barrister, these adjusted figures are used. ↩
-
Detailed figures for both methods are available in the accompanying data tables. ↩
-
Figures for Chartered Legal Executive applicants for individual selection exercises are given in the data tables. The following posts (including fee-paid or “deputy” equivalents) are open to suitably qualified Chartered Legal Executive lawyers: District Judge, District Judge (Magistrates’ Courts), Judge of the First-tier Tribunal, Employment Judge, Road User Charging Adjudicator and Adjudicators (regulation 17 Civil Enforcement of Parking Conventions), Judge of the Upper Tribunal and Recorder. ↩
-
In contrast to sex and ethnicity, comparisons in this section are based on applications, rather than the eligible pool. For posts not requiring judicial experience, 90% of the eligible pool based on current legal role are solicitors, far more than the proportion that had been recommended, so that the relative rates for solicitors are small and provide less insight. These figures are however presented in the data tables. ↩
-
The progression rates for each group are almost identical across the two definitions of ‘current legal role’ and ‘ever legal role’. As a result, we have only presented the ‘ever legal role’ definition here. ↩
-
These figures only reflect the most recent legal role at the time of appointment, and therefore will not capture the full professional legal background of the judiciary. ↩
-
These percentages do not include the small number of judges whose professional background is neither as a solicitor or a barrister. This is recorded as “other” in Table 3.3 of the accompanying tables and includes former legal executives. ↩
-
The mandatory retirement age for most judges was raised from 70 to 75 years as of March 2022. Judges can still hold a post in retirement, on a fee-paid basis - known as judges sitting in retirement - please see Chapter 11. ↩
-
The SRA had not met the required declaration rate of 60% as of April 2026. Measures are being taken to address this. ↩
-
In this section, the recommendation rate is calculated as the volume recommended as a percentage of the volume of applicants. Figures are calculated exactly and then rounded to the nearest whole number for presentation in the report. ↩
-
This figure is an aggregate of respondents who reported attending: (i) a UK state school aged 11–18 (30%); (ii) a non-selective UK state school aged 11–16 (28%); and (iii) a selective UK state school aged 11–16 (9%). Totals may not sum exactly due to rounding. ↩ ↩2
-
There may be some judges who hold another appointment in other sections of this report in which they are not sitting in retirement. These judges will be counted in both sets of figures. ↩
-
Figures do not add up to 14% due to rounding. ↩
-
Magistrates recruitment is an ongoing process, that does not always conclude within a 12 month window, and will differ across regions and Advisory Committee areas. As such, any recruitment data, particularly in regard to recruitment stages should be caveated with this understanding, that it is live data as part of an ongoing process. ↩
-
Not all of these applications will have reached a final decision by the end of the period covered by this report (31 March 2026); these may have just started, or be waiting for a shortlisting decision or for a recommendation decision. ↩
-
Figures for 2024-25 have been revised since the previous publication - please see Table 3.8a. ↩
-
Figures do not add up to 26% due to rounding. ↩
-
This figure is slightly different to the new magistrates appointment figure in Table 3.6 due to possible recording delays or differences on the relevant systems. ↩
-
Figures do not add up to 17% due to rounding. ↩