Diversity of the judiciary: Legal professions, new appointments and current post-holders - 2022 Statistics
Updated 13 July 2023
Applies to England and Wales

© Crown copyright 2023
This publication is licensed under the terms of the Open Government Licence v3.0 except where otherwise stated. To view this licence, visit nationalarchives.gov.uk/doc/open-government-licence/version/3 or write to the Information Policy Team, The National Archives, Kew, London TW9 4DU, or email: psi@nationalarchives.gov.uk.
Where we have identified any third party copyright information you will need to obtain permission from the copyright holders concerned.
This publication is available at https://www.gov.uk/government/statistics/diversity-of-the-judiciary-2022-statistics/diversity-of-the-judiciary-legal-professions-new-appointments-and-current-post-holders-2022-statistics
1. Main Points
1.1 Gender
| Women are well represented in the solicitor and Chartered Legal Executive professions, but are less represented among the more experienced and more senior members of the legal professions | Women constitute 39% of barristers, 53% of solicitors and 77% of Chartered Legal Executives. The proportion of women is notably lower for those having 20 or more years’ experience - at 29%, 39% and 69% respectively, but is higher for those less experienced legal professionals who are eligible to apply. |
| Overall, there is no evidence of disparity in legal judicial selection in 2021-22 for women relative to men when comparing recommendation rates from the eligible pool | Across all legal Judicial Appointments Commission (JAC) exercises in 2021-22, women accounted for 49% of applications and 48% of recommendations. |
| Although the proportion of women has increased slightly over recent years, they remain under-represented in the court judiciary, particularly in senior roles | As at 1 April 2022, about a third (35%) of court judges and half of tribunal judges were women. The proportion remains lower in senior court appointments (30% for High Court and above). |
1.2 Ethnicity
| Representation of ethnic minorities in the legal profession is comparable to the proportion of the working age population of England and Wales from ethnic minority backgrounds | As at 1 April 2022, ethnic minority individuals together constituted 16% of barristers, 18% of solicitors and 9% of Chartered Legal Executives. These proportions are lower for professionals with 20 or more years’ experience, at 13%, 11% and 4% respectively, but is higher for those less experienced legal professionals who are eligible to apply. |
| When considered together, there is evidence of disparity for ethnic minority candidates in legal judicial selection exercises in 2021-22 | Across all legal exercises in 2021-2022, ethnic minority candidates accounted for 23% of applications and 11% of recommendations. |
| In the past three years of legal exercises, Asian, black, and mixed ethnic minority individuals were over-represented in applications for judicial appointment. All four ethnic minority groups had lower recommendation rates than white candidates | For all legal exercises between April 2019 and March 2022, Asian, black, mixed and other ethnic minority candidates accounted for 16%, 4%, 3% and 1% of applications and 7%, 1%, 4% and 1% of recommendations respectively. |
| The proportion of Asian and Mixed ethnicity individuals in the judiciary has slowly increased since 2014, while the proportion of Black and Other ethnic minority individuals has stayed the same in that time. Proportions of ethnic minorities remain lower in senior court roles | As at 1 April 2022, 5% of judges were from Asian backgrounds, 1% were from black backgrounds, 2% were from mixed ethnic backgrounds and 1% were from other ethnic minority backgrounds. The proportion of ethnic minorities is lower for senior court appointments (5% for High Court and above) compared to others. |
1.3 Intersection of Gender and Ethnicity
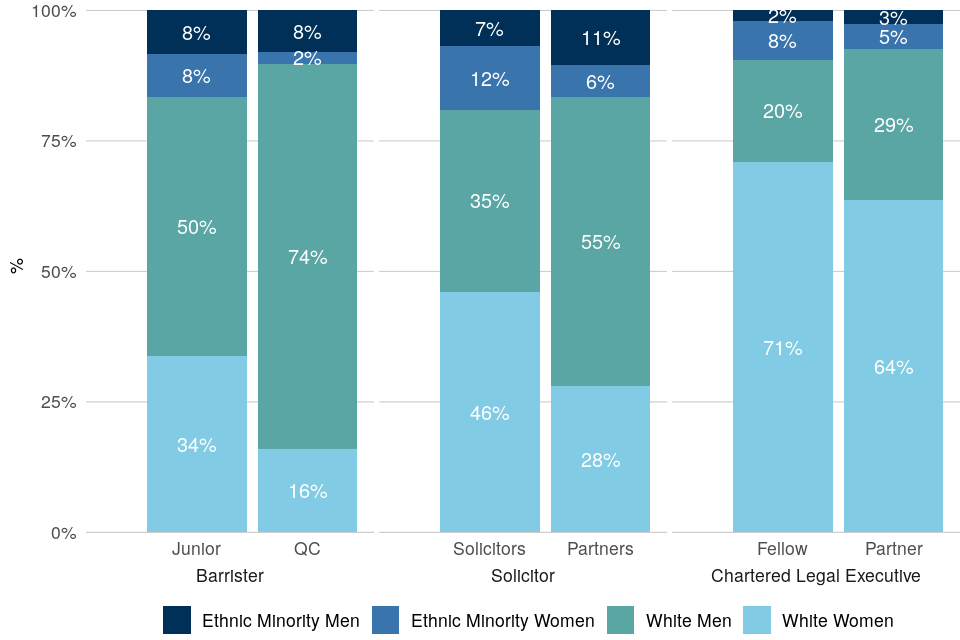
| Representation of gender-ethnicity intersection groups varies across the legal professions. For barristers, representation of white men is higher, but for Chartered Legal Executives it is white women | As at 1 April 2022, white men constituted the highest proportion of barristers (52%), followed by white women (32%), ethnic minority men (8%) and ethnic minority women (7%). White men and white women constituted the highest proportion of solicitors (40% and 41%), followed by ethnic minority women (11%), then men (8%). White women constituted two thirds (70%) of Chartered Legal Executives. |
| Representation of both ethnic minority men and women is higher among applications than recommendations. Both groups have lower recommendation rates than white candidates | Across all legal exercises between April 2019 and April 2022, ethnic minority men accounted for 11% of applications and 7% of recommendations. Ethnic minority women accounted for 13% of applications and 6% of recommendations. White women accounted for 36% of applications and 40% of recommendations. White men accounted for the remaining 40% of applications and 47% of recommendations. |
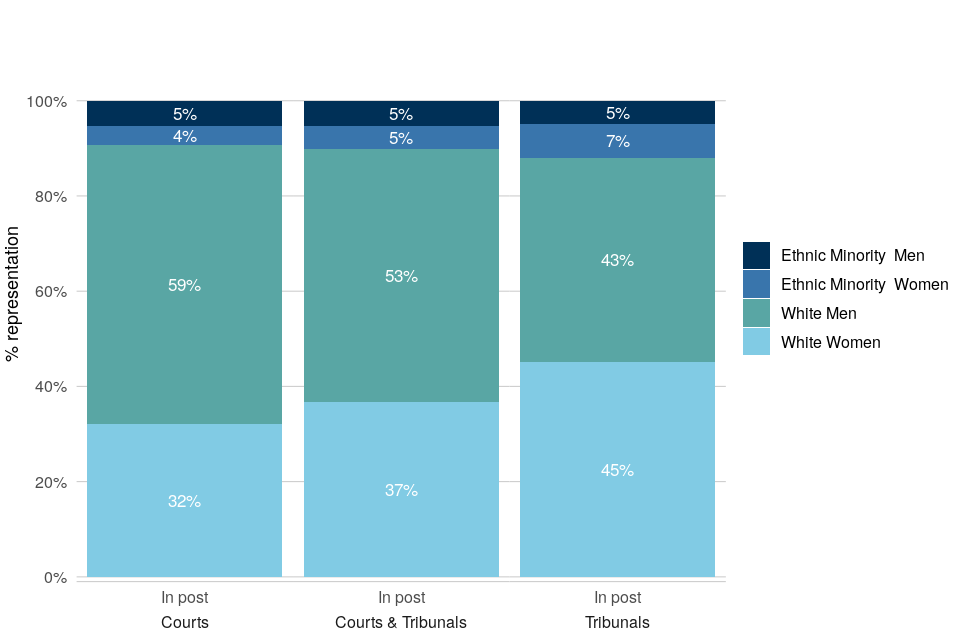
| More than half of the judiciary are white men and over a third are white women. Ethnic minority men and women each account for 5% of judges | As at 1 April 2022, ethnic minority men and women each accounted for 5% of judges in post. White women accounted for 37% and white men accounted for the remaining 53%. Representation of these groups differed between courts and tribunals, with a higher proportion of women from both white and ethnic minority backgrounds among tribunal judges. Within the senior courts, white men constituted a larger proportion of posts. |
1.4 Professional Background
| Representation of solicitors decreases predominantly between application and shortlisting during the judicial selection process | Across all legal exercises in 2021-2022, there was a higher representation of solicitors (45%) than barristers (39%) among applications, but solicitors constituted a smaller percentage of recommendations (27% compared to 54%). Chartered Legal Executives constituted 1% of all applications. |
| Most court judges have a background as a barrister, though this is not the case with tribunal judges | Overall, 31% of court judges and 63% of tribunal judges were from non-barrister backgrounds (mostly solicitors). However, in the more senior court posts (High Court and above) only 5% of current judges were non-barristers. In both courts and tribunals, the proportion with a non-barrister background has fallen compared to 2014. |
1.5 Intersection of Gender and Professional Background
| Male and female solicitors showed similar progression rates for legal exercises between 2019 and 2022 | Across all legal exercises between April 2019 and March 2022, male and female solicitors both had a recommendation rate from application of 8%. Male and female barristers had rates of 16% and 17% respectively. |
| Male barristers are the largest gender-profession group in the judiciary and are more represented in senior posts | At 1 April 2022: 38% of judges were male barristers, 21% were female barristers, 21% were male solicitors and 20% were female solicitors. Representation of these groups differed between courts and tribunals, with a higher proportion of male and female solicitors among tribunal judges. Within the senior court judiciary, male barristers occupied the majority of posts. |
1.6 Intersection of Ethnicity and Professional Background
| Ethnic minority barristers have lower recommendation rates than white barristers. Ethnic minority solicitors have lower recommendation rates than all three other ethnicity-profession groups | Across all legal exercises between April 2019 and March 2022, ethnic minority barristers accounted for 9% of applications and 7% of recommendations. Ethnic minority solicitors accounted for 15% of applications and 5% of recommendations. White solicitors accounted for 40% of applications and 32% of recommendations. White barristers accounted for 36% of applications and 56% of recommendations. |
| White barristers are the largest ethnicity-profession group in the judiciary and are more represented in senior posts | At 1 April 2022: 6% of judges were ethnic minority barristers, 4% were ethnic minority solicitors, 38% were white solicitors and 52% were white barristers. Representation of these groups differed between courts and tribunals, with a higher proportion of ethnic minority solicitors among tribunal judges. Within the senior court judiciary, white former barristers occupied almost all posts (95%). |
1.7 Intersection of Gender, Ethnicity and Professional Background
| White female barristers, closely followed by white male barristers have the highest recommendation rates from application compared to all other gender-ethnicity-profession groups | From application, white female barristers had a recommendation rate of 19% and white male barristers had a rate of 18%. Ethnic minority female solicitors had the lowest rate of 3%, whilst for ethnic minority male solicitors it was 4%. |
| White male barristers are the largest gender-ethnicity-profession group in the judiciary and occupy most senior court posts | At 1 April 2022: 3% of judges were ethnic minority male barristers, 2% were ethnic minority male solicitors, 3% were ethnic minority female barristers and 2% were ethnic minority female solicitors. 34% were white male barristers, 20% were white male solicitors, 18% were white female barristers and 18% were white female solicitors. Representation of these groups differed between courts and tribunals, with higher proportions of ethnic minority individuals, solicitors and women among tribunal judges. |
1.8 Age
| Older applicants have lower recommendation rates than younger applicants, with 77% of new appointees aged under 50 | Across all legal selection exercises in 2021-22, those aged 50 and over accounted for 35% of applications and 23% of recommendations, while for those aged under 50 the proportions were 65% and 77% respectively |
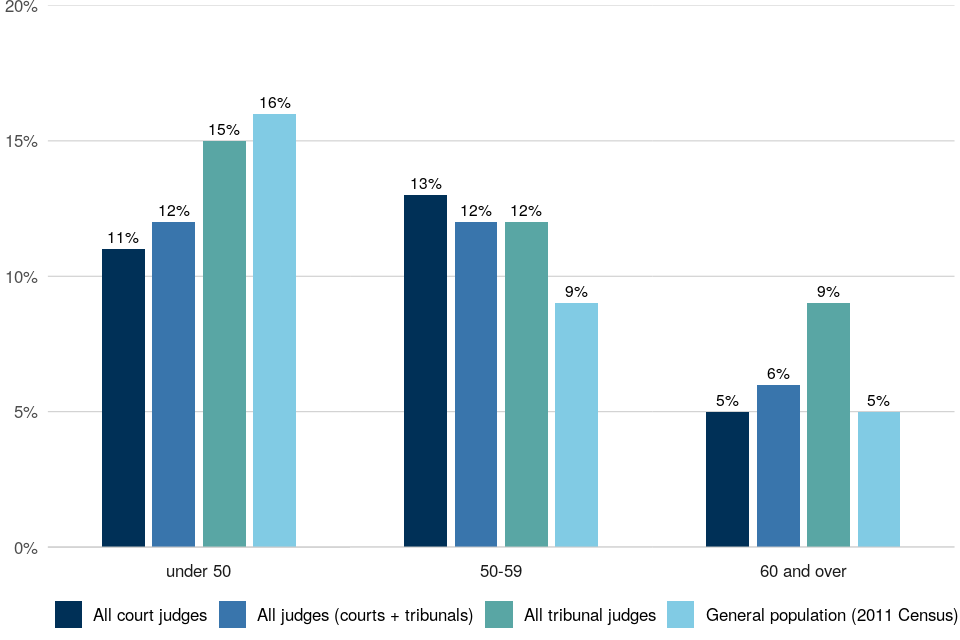
| Most judges are aged 50 or over | 70% of court judges and 69% of tribunal judges were aged 50 and over, with 35% aged 60 and over in courts and 36% in tribunals. |
1.9 Non-legal Members of Tribunals
| Compared with judges, a higher proportion of non-legal members are women, or from an ethnic minority background | Across all tribunal non-legal members in post as at 1 April 2022, 56% were women, 18% were from an ethnic minority background and 83% were aged 50 and above. |
| In judicial appointments a higher proportion of recommendations are for women and ethnic minority individuals in non-legal exercises than in legal exercises | Across all non-legal exercises in 2021/2022, 56% of recommendations were women and 21% were from ethnic minority backgrounds. In non-legal exercises between 2019 and 2022, 15% of recommendations were from Asian backgrounds, 5% were from black backgrounds, 3% were from mixed ethnic backgrounds and 1% were from other ethnic backgrounds. |
| Women and Asian candidates have higher recommendation rates from application than men and white candidates respectively | Across all non-legal exercises in 2021/2022, recommendation rates from application were 2 percentage points higher for women than they were for men. In non-legal exercises between 2019 and 2022, rates for Asian candidates were 7 percentage points higher than for white candidates and rates for ethnic minority men and women, and white women, were all higher than for white men. |
1.10 Magistrates
| Compared with judges, a higher proportion of magistrates are women, or from an ethnic minority background | As at 1 April 2022, 57% of sitting magistrates were women, 14% were from an ethnic minority background and 79% were aged 50 and above. |
2. Statistician’s Comment
This report provides figures about the diversity of judicial office holders and the legal professions who provide the eligible pool of candidates for most judicial roles in England and Wales. Statistics and analyses are also presented on the diversity of the candidates who apply for those judicial posts via selection exercises.
Latest figures show a continuation of the gradual upward trend seen in the overall proportion of female and ethnic minority judges in post. Women make up a higher proportion of new entrants than leavers, but they continue to be under-represented in the courts judiciary in 2022, particularly in the more senior roles. The proportion of judges who identify as being from an ethnic minority background has been slowly increasing, from 7% in 2014 to 10% in 2022. However, there are different trends between the ethnic groups, with increases seen in judges of Asian and mixed ethnicity backgrounds, but no evidence of a change in the proportion of black and other minority ethnic judges in this period.
For legal professionals (barristers, solicitors and Chartered Legal Executives) who make up the eligible pool of future candidates, the overall proportions of females and those of ethnic minority backgrounds are generally higher than those of existing judges in post. These proportions are even higher for the less experienced legal professionals who are earlier in their careers though still potential candidates for future judicial selection exercises.
For judicial selection exercises completed during 2021-22, analyses show that overall there was no statistically significant difference in recommendation rates from the eligible pool for women relative to men. There was a statistically significant difference between ethnic minority and white candidates, though this varies within specific exercises. Recommendation rates from application (as well as from the eligible pool) for solicitor candidates were significantly lower than for barrister candidates.
Year-on-year comparisons are not made for selection exercise data as these can be affected by the number and type of exercises run in any given year, and can vary according to recruitment needs and the timing of reporting. For example, the two largest fee-paid entry level judicial exercises were still open on 1 April 2021 and so were not included in the 2021 report but have been included in this year’s statistics, leading to a much higher number of applicants this year compared to last year (9,052 compared to 3,471). We therefore advise further caution when comparing overall judicial appointment statistics from one year to the next. Nevertheless, it is possible to look at roles over time for certain larger exercises. For instance, Recorder and District Judge exercises saw a general increase in the ethnic minority proportions in both applications and recommendations in the last three years compared to previous years.
Additionally, aggregated data across all legal exercises over a three-year period allows more in-depth analyses, such as investigating whether there are differences in rates of progression between ethnicity groups. Analysis across all legal exercises from April 2019 to March 2022 shows a varying disparity in the outcomes for the different ethnic groups; recommendation rates from the eligible pool for Asian, black and other minority ethnic candidates were significantly lower than for white candidates, but were significantly higher for candidates from mixed ethnic backgrounds compared to white candidates. However, there was no significant difference between other and mixed ethnic minority candidates compared to white candidates when looking at recommendation rates from application, illustrating that in some instances recommendation rates can be considerably different whether looked at from the eligible pool or the application stage. This is because application rates sometimes can be higher than expected for certain groups.
Combining data across 3 years also allows analyses on the intersection of diversity characteristics - for example after controlling for gender we still see a difference in the recommendation rates for those from ethnic minority groups compared to white candidates, or for solicitors compared to barristers.
Alongside figures for court and tribunal judges, this publication also includes figures about non-legal tribunal members and magistrates, which for example show that both overall have a greater representation of women and ethnic minorities compared to judges in legally-qualified positions.
3. Things you need to know
3.1 Overall
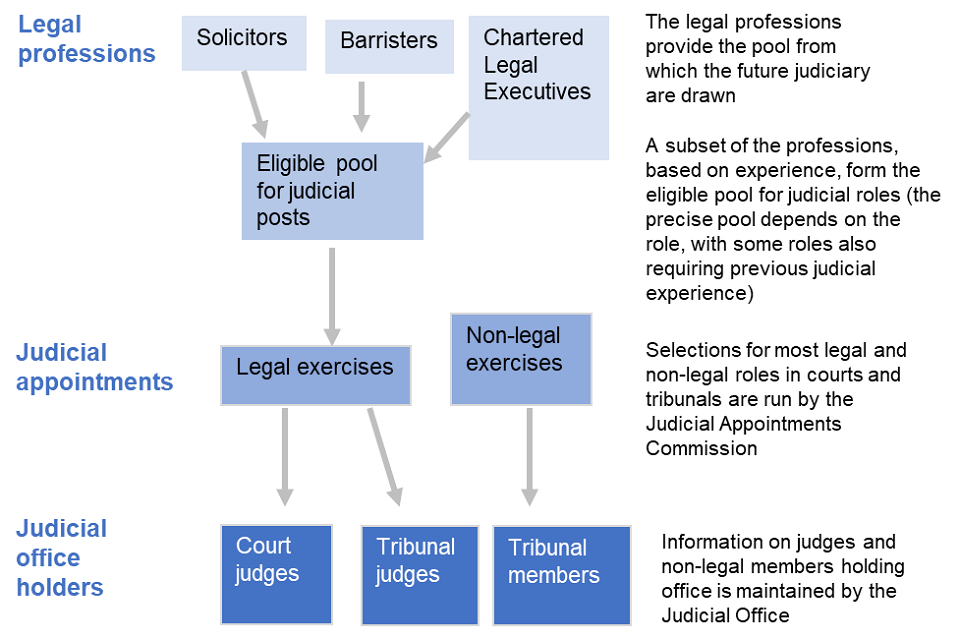
This publication sets out patterns and trends relating to judicial diversity, bringing together data on legal professions (which provide the pool from which the future judiciary are drawn), judicial appointments, and sitting judges and other post holders. It covers diversity at different stages of the path to judicial office, as summarised in the image below.
A key aim of this publication is to bring together data into one place that before 2020 was published separately, and in doing so, provide a comprehensive picture of the data available and evidence gaps.
Much of the diversity data included in this publication depends on voluntary self-declaration by legal profession members, judicial post applicants and judicial office holders. All percentages are calculated using the proportion of individuals where the characteristic is known. A characteristic is considered to be ‘unknown’ if an individual has asked for their data to not be shared further, has chosen ‘prefer not to say’, or has left the answer blank. For intersections of multiple characteristics groups, individuals in the ‘unknown’ group are those that were ‘unknown’ for one or more of the characteristics being intersected.
The minimum required declaration rate[footnote 1] for this publication is 60%. Where this declaration rate has not been met, the data has not been included. As declaration rates improve, we hope to include more information in future releases. Further details are given in the background guidance note.
As with the previous report, we have considered the newest Cabinet Office guidance[footnote 2] and the findings of the Sewell Report[footnote 3]. Recommendations included moving away from the term Black, Asian and Minority Ethnic (BAME) and disaggregating ethnicity as much as possible. As a result, in this publication we refer to ethnicity and race data using the high-level categories of those who self-identify as coming from an Asian or Asian British, black or black British, mixed, white or other ethnic background. Where the numbers in these high-level categories are small, we aggregate the Asian, black, mixed and other groups and refer to this group using the term “ethnic minority”, then compare this group to the white group[footnote 4] . These categories essentially refer to exactly the same ethnic groups as those used in previous reports, except with a new name.
For comparisons with the white group as a whole, we use the term “ethnic minority” however this term excludes white minorities. We use this aggregated group when presenting data on the intersection of ethnicity with other diversity characteristics.
We recognise that using these high-level categories and further aggregating them may not capture differences in the outcomes of those making up the groups, but this is the most granular we are able to present without risking disclosure of information or the robustness of findings.
The data tables accompanying this report provide breakdowns of ethnicity in the high-level categories referred to above for the legal professions and Judicial Office (JO). This breakdown is also provided for the Judicial Appointments Commission (JAC). However, due to the risk of disclosure from small numbers in a single year, only data for the aggregated ethnic minority group is provided for the 2021-22 data. Statistics on the more granular groups are available as an aggregation of numbers of candidates over the previous 3 years of data (2019-20, 2020-21,2021-22), and so are only available in the “JAC_3_years” tables.
3.2 Legal professions
Data on the legal professions included in this publication[footnote 5] is provided as at 1 April 2022, with definitions as follows:
- Solicitors: all practising solicitors i.e. those who hold a practising certificate (PC).
- Barristers: all practising barristers (those who hold a PC).
- Chartered Legal Executives: all fellows of the Chartered Institute of Legal Executives (CILEX) excluding students, affiliates, associates and graduates.
Definitions of Post Qualification Experience (PQE) for each profession included in this publication:
- Solicitors: number of practising certificates held (rather than years since admission).
- Barristers: years of practice (the number of years since an individual completed pupillage).
- Chartered Legal Executives: based on years of experience for members who have achieved fellowship[footnote 6]
Definitions of seniority[footnote 7] for each profession included in this publication:
- Solicitors: solicitors at the lower level and partner at the higher level. Partner includes owners and managers of law firms. There is no equivalent way of identifying seniority for in-house solicitors, who are all included in the lower level of solicitor[footnote 8].
- Barristers: junior barristers (lower level) and Queen’s Counsel (QC)[footnote 9] at the higher level.
- Chartered Legal Executives: CILEX fellows are the lower level of seniority, partners represent the higher level of seniority (if an individual is a fellow and partner, they are counted as partner)
Solicitors, barristers and Chartered Legal Executives comprise very different populations and professions. Their population sizes are highly varied, as are their members’ qualification, progression and employment processes, eligibility and potential interest in applying for, and consequent representation in, the judiciary. As a result, caution is advised in making comparisons between different professions, and with the JAC and Judicial Office data. In particular, Chartered Legal Executives are unable to apply for judicial roles requiring 7 or more years legal experience[footnote 10].
3.3 Judicial Appointments: Applications and Selections
The JAC figures include all 31 exercises which closed[footnote 11] between 1 April 2021 and 31 March 2022[footnote 12]. JAC figures on ethnic minority groups and the intersection of diversity characteristics (Gender, Ethnicity and Professional Background) include all 101 exercises which closed between 1 April 2019 and 31 March 2022. Senior appointments[footnote 13] are not covered in the main commentary but are included in the accompanying tables, and exercises with fewer than 10 recommendations are grouped to maintain applicant confidentiality.
Recommendations from JAC selection exercises will not directly correspond to new entrants to the judiciary also covered in this publication, as there is a lag between selection exercises being completed and individuals taking up their post, and some will already have had a judicial role (often fee-paid).
Where 2 or more applicants are assessed as being of equal merit, the JAC can select an applicant for the purpose of increasing judicial diversity using the Equal Merit Provision (EMP) introduced by the Crime and Courts Act 2013[footnote 14]. EMP can be applied at both the shortlisting and recommendation stage. EMP was applied at the shortlisting stage 7 times within 5 exercises, with EMP being applied twice in 2 exercises. EMP was applied at the selection stage on 6 occasions in 5 exercise, with EMP being applied twice in 1 exercise. In total, 183 candidates were advanced to the next stage of the process as a result of using EMP at the shortlisting stage. Additionally, a total of 25 candidates were recommended as a result of using EMP at the selection day stage.
A recommendation rate refers to the proportion of applicants (who have declared a specified characteristic) that were recommended for appointment which allows success of those with different characteristics to be compared within an exercise. These rates will depend on the number of applicants for the exercise as well as the number of posts available so that comparisons of rates between exercises should be avoided. Similarly, rates are also produced for eligible pool to recommendation for appointment.
The Relative Rate Index (RRI) is used to compare the relative success of two different groups, for example men and women. More information on the method of calculation and reporting can be found in the user guide that is published alongside this report.
In this publication we refer to two types of significance: practical significance and statistical significance. Practical significance refers to when an RRI for a particular comparison between two groups falls outside the 0.8 to 1.25 ‘zone of tolerance’; if it falls outside these bounds the result can be considered to be of practical importance. Statistical significance refers to when there is a less than 5% chance that a result is due to random variation, and means we are confident that there is a real difference between two groups of candidates. For more detailed explanations of these concepts, please see the user guide that accompanies this report.
Eligibility for judicial selection varies from one exercise to another. The Eligible Pool (EP) for an exercise presents the gender, ethnicity and professional background of individuals who meet the minimum eligibility requirements – including minimum years of experience – for a specific legal exercise[footnote 15]. There are three broad eligibility types:
- Posts requiring a minimum 5 years legal experience, as a barrister, solicitor or Chartered Legal Executive
- Posts requiring a minimum 7 years legal experience as a barrister or solicitor
- Posts requiring previous judicial experience (in addition to a number of years of legal experience)
This publication also includes figures for average years of PQE among candidates who have applied for judicial selection[footnote 16]. These are a guide to actual levels of experience of applicants, and are therefore different from the eligible pool which is based on all those eligible for a role (many of whom will not apply).
When considering applicants’ professional background, applicants for judicial roles are analysed based on their full career history (i.e. whether they were ever a solicitor, or ever a barrister) as well as their current legal role at time of application. The “ever” legal role is based on applicants’ self-reporting and does not take account of the relative time spent in each profession. Numbers of Chartered Legal Executives are not high enough to be considered in the “ever” legal role analysis.
This publication presents data for selection exercises concluded during 2021-22 and does not draw comparisons with previous years as these can be affected by the number and type of exercises run in a year, which can vary according to recruitment needs.
The data and associated representation percentages can also be sensitive to when exercises are formally closed and how this compares to the report’s cut-off date of 1 April in each year. For example, there are often three large fee-paid exercises run on an annual basis (Recorder, Deputy District Judge, and Fee-paid Judge of the First-tier Tribunal and Employment Tribunal). The latter two exercises were still open on 1 April 2021 and so were not included in the 2021 report but have been included in this year’s statistics. For this reason, we advise further caution when comparing judicial appointment statistics from one year to the next.
3.4 Judicial office holders
JO data in this publication relates to judges and non-legal members of tribunals in post as at 1 April 2022, as well as leavers and new entrants from 1 April 2021 to 31 March 2022.
Judges may hold more than one post at a time, for example some judges sit in more than one chamber, tribunal or court. In these statistics, a judge is counted only against their primary appointment, which is the one considered as their main judicial post. There are a small number of posts that are by definition not primary appointments, for example Upper Tier Tribunal President and Employment Appeal Tribunal President. The post-holders are included only in the counts for their primary appointment, meaning that for these posts statistics are not presented.
Throughout this report, where the term “tribunal judges” is used it is referring only to legal tribunal judges and does not include non-legal tribunal members. Statistics on non-legal tribunal members are discussed in the final chapter “Non-legal and Magistrates” only.
The data covers all courts in England and Wales, all tribunals administered by HMCTS, Welsh tribunals not administered by HMCTS and magistrates in England and Wales. This includes the Employment Tribunal Scotland, in addition to tribunals in England and Wales. Tribunals that are the responsibility of the devolved Welsh Government are not included.
4. Overview of the legal professions and judiciary
The actual levels of applicants’ PQE are often greater than the minimum statutory requirement for judicial appointments of 5 or 7 years.
Of all applicants for court and tribunal positions requiring at least 5 years’ post-qualification experience, applicants had around 18 years’ experience on average. Of those who applied for positions requiring at least 7 years’ of experience, applicants had around 20 years’ experience on average.
The number of magistrates has fallen steadily in recent years, decreasing by 50% in the past decade.
4.1 Legal professions
As at 1 April 2022, there were 17,252 barristers, 154,985 solicitors and 8,544 Chartered Legal Executives.
The varying size of the professions should be kept in mind when interpreting the figures presented throughout this publication relating to the percentage of those in different professions with various characteristics (typically there will be more solicitors than barristers or Chartered Legal Executives). Absolute numbers are given in the accompanying data tables.
4.2 Judicial Appointments: Applications and Selections
Exercises in 2021-22
The JAC completed 31 selection exercises (excluding senior judicial appointments) in 2021-22[footnote 17]:
- 16 exercises were for court posts
- 15 were for tribunal posts, of which 7 were for non-legal tribunal member posts
While this publication only makes direct reference to the 10 large legal and 5 large non-legal exercises, totals include relevant smaller exercises (unless otherwise stated).
Overall, there were 9,052 applications, resulting in 1,098 recommendations for immediate appointment (s87)[footnote 18]
- 8,374 applications for legal posts, with 888 recommendations
- 678 applications for non-legal posts, with 210 recommendations
In addition, a total of 14 applications were received and 3 recommendations made for the senior judicial Court of Appeal exercise completed in 2021-22[footnote 19].
Levels of experience among applicants
While information on the eligible pool for each exercise is presented (where available), the actual levels of applicants’ PQE are often greater than the minimum statutory requirement of 5 or 7 years. As a result, further diversity breakdowns for the legal professions are given in the following chapters to allow a more meaningful comparison.
- Court positions requiring 5 years’ PQE: average PQE of applicants was 17 years
- Court positions requiring 7 years’ PQE: average 20 years
- Tribunal positions requiring 5 years’ PQE: average 19 years
- Tribunal positions requiring 7 years’ PQE: average 21 years
High average PQE among applicants does not necessarily lead to a better chance of success. Further investigation into the relationship between experience and success in the judicial appointments process is currently being conducted by the Judicial Diversity Forum. It will look at experience in terms of exposure to types of legal work, seniority level and PQE. The findings of this investigation will be published in the future.
Comparison with previous years
This publication presents data for selection exercises concluded during 2021-22 and does not draw comparisons with previous years. Historical comparisons can be affected by the number and type of exercises run in any given year, which can vary according to recruitment needs.
The data and associated representation percentages can also be sensitive to when exercises are formally closed and how this compares to the report’s cut-off date of 1 April in each year. For example, there are often three large fee-paid exercises run on an annual basis (Recorder, Deputy District Judge, and Fee-paid Judge of the First-tier Tribunal and Employment Tribunal). The latter two exercises were still open on 1 April 2021 and so were not included in the 2021 report but have been included in this year’s statistics. For this reason, we advise further caution when comparing judicial appointment statistics from one year to the next.
However, compared to the pre-JAC years (1998-99 to 2005-06), the JAC period has seen a clear increase in the representation of women and ethnic minority candidates at both the application and recommendation stages, for the four appointments where data is consistently available[footnote 20]. Changes in the representation of solicitors between the pre-JAC and JAC periods varies by exercise. This data is presented in Table 2.5 of the accompanying tables.
4.3 Judicial office holders
As at 1 April 2022, by primary appointments there were:
- 3,470 court judges
- 1,753 tribunal judges, with an additional 3,283 non-legal members of tribunals.
The overall number of court and tribunal judges has fluctuated over time, and there is no consistent pattern of increase or decrease. Since 2012 (the earliest year with data available on both courts and tribunals), the numbers of court judges (3,575 in 2012), and tribunal judges (2,060 in 2012) have both decreased.
This publication also covers new entrants to, and leavers from, the judiciary. Turnover in the judiciary tends to be relatively low, with 514 judges beginning their first appointment in 2021-22 (333 court, 181 tribunal judges) and 236 leaving in the same period (119 court, 117 tribunal).
There were 12,506 magistrates across England and Wales. The number of magistrates has fallen steadily in recent years, decreasing by 50% from 25,170 since 2012.
5. Gender
5.1 Legal Professions
Women are well represented in the solicitor and Chartered Legal Executive professions, but are less so among the more experienced and more senior members of the legal professions.
For all Solicitors, Barristers, and Chartered Legal Professionals, the proportion of women is lower at more senior compared to less senior levels.
Considering each profession as a whole, compared to men, women constituted a lower proportion of barristers (39%), over half of solicitors (53%) and a higher proportion of Chartered Legal Executives (77%).
Post Qualification Experience
In practice, most applicants for judicial roles have more than the minimum experience. For court and tribunal posts requiring 5 years or more experience, applicants have around 18 years’ experience on average. Among those with 15 or more years’ PQE, women constituted 33% of barristers, 45% of solicitors and 74% of Chartered Legal Executives.
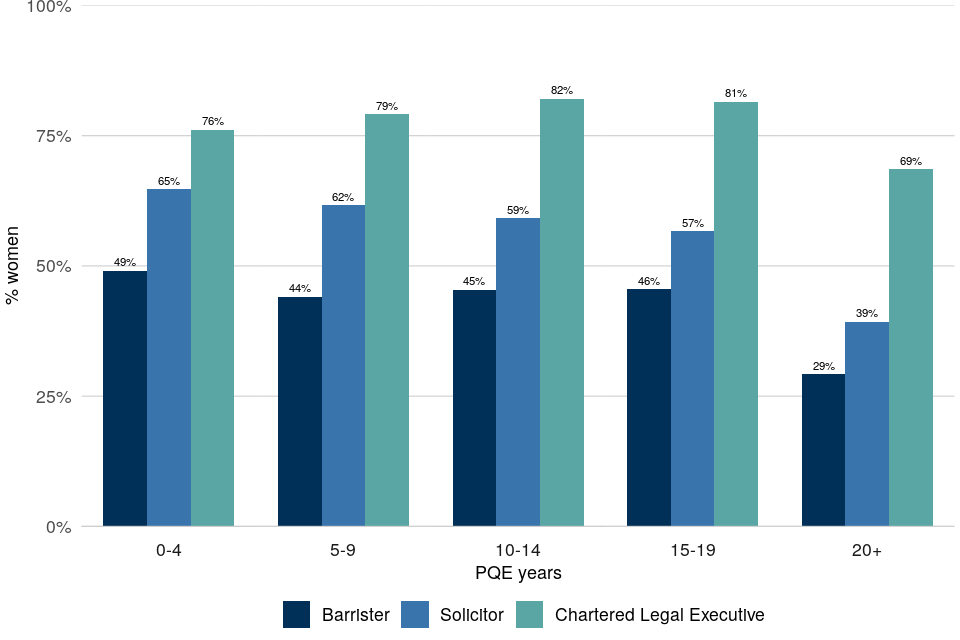
For court and tribunal posts requiring 7 years’ or more experience, applicants have on average around 20 years’ experience. Among those with 20 or more years’ PQE, women constituted 29% of barristers, 39% of solicitors and 69% of Chartered Legal Executives (though Chartered Legal Executives are not eligible to apply for these roles).
Figure 1: representation of women in the legal professions by PQE band, April 2022 Across all legal professions, the proportion of women is notably lower for those having 20+ years’ experience.
Seniority[footnote 21]
Compared to men, at 1st April 2022:
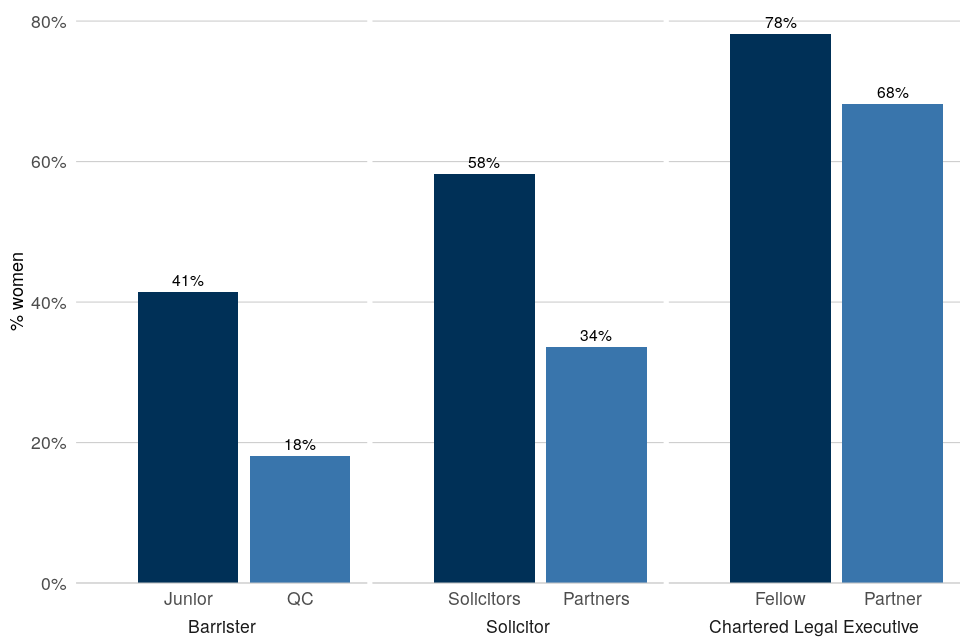
- Among barristers, women constituted a lower proportion than men at both the lower (junior barrister) and higher (Queen’s Counsel) seniority levels (Figure 2).
- Among solicitors, there was a larger proportion of women than men at lower seniority levels (solicitor), but a lower proportion of women at higher seniority levels (partner).
- Among Chartered Legal Executives, there was a larger proportion of women than men at both the lower (fellow) and higher (partner) seniority levels.
Figure 2: representation of women in the legal professions by seniority, April 2022 For all three professions, the proportion of women is lower at more senior compared to less senior levels.
5.2 Judicial Appointments: Applications and Selections
Overall, there is no evidence of disparity in legal judicial selection in 2021-22 for women relative to men when comparing recommendation rates from the eligible pool.
Overall View
Across all legal JAC exercises in 2021-22, women[footnote 22] accounted for 49% of applications, 47% of those shortlisted and 48% of those recommended for appointment.
3,731 applications were from women, of whom 393 were recommended for appointment[footnote 23].
Across all legal exercises in 2021-22, when considering the eligible pool there was not strong evidence of disparity for women. From eligible pool to recommendation, the estimated[footnote 24] RRI of 0.89 shows that overall the success rate for women from the eligible pool was 0.89 times the rate for men (or 11% lower for women than men). This difference is not statistically or practically significant.
48% of recommendations were women; this compares with an expected 51% overall if recommendations were in line with the overall eligible pool for 2021-22 exercises. Representation of women in the legal exercises remained relatively stable between the application and recommendation stages - women represented 49% of applications and 47% of those shortlisted.
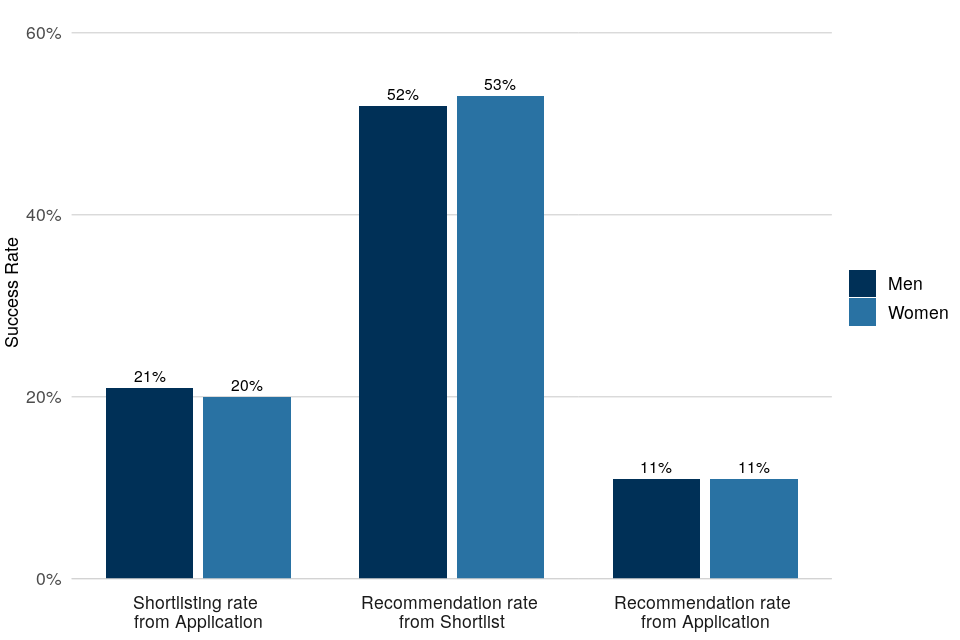
Compared to men, women had a slightly higher recommendation rate from shortlisting, but a slightly lower shortlisting rate from application (Figure 3). The smaller difference seen between men and women in the recommendation rate from application was because these other rate differences mostly cancelled each other out.
Figure 3: progression of applicants through the exercise stages by gender (all legal exercises completed in 2021-22).
Exercise-specific Analysis
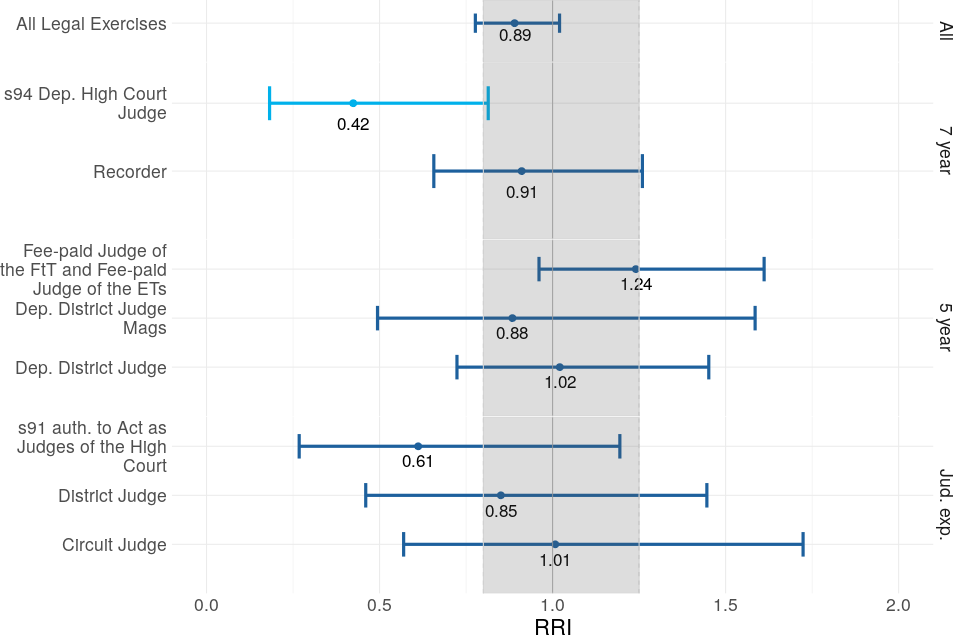
There was some variation across exercises run in 2021-22. When considering women relative to men, from the eligible pool to recommendation we can be statistically confident a disparity exists for only one of the exercises (Figure 4) – the s9(4) Deputy High Court Judge exercise.
For the s9(4) Deputy High Court Judge exercise the RRI of 0.42 indicates that women were 0.42 times as likely (or 58% less likely) to be successful relative to men[footnote 25]. However, the RRI value for application to recommendation was 0.88 and not statistically significant. This means that there is no evidence of disparity in success rate between men and women when looking at applicants rather than the eligible pool.
For s9(1) authority to Act as Judges of the High Court exercise women were 39% less likely to be successful (or 0.61 times) than men. However, because this RRI was not statistically significant, we cannot be confident that there is a true difference between genders in this exercise.
Figure 4: RRI for women compared to men, from eligible pool to recommendation (all legal exercises completed in 2021-22). Statistically significant results – where the confidence interval does not overlap the parity line - are light blue. The tolerance zone is shaded grey; results falling within this zone are considered to represent a disparity which is not large enough to be considered practically important (and tend not to be statistically significant).
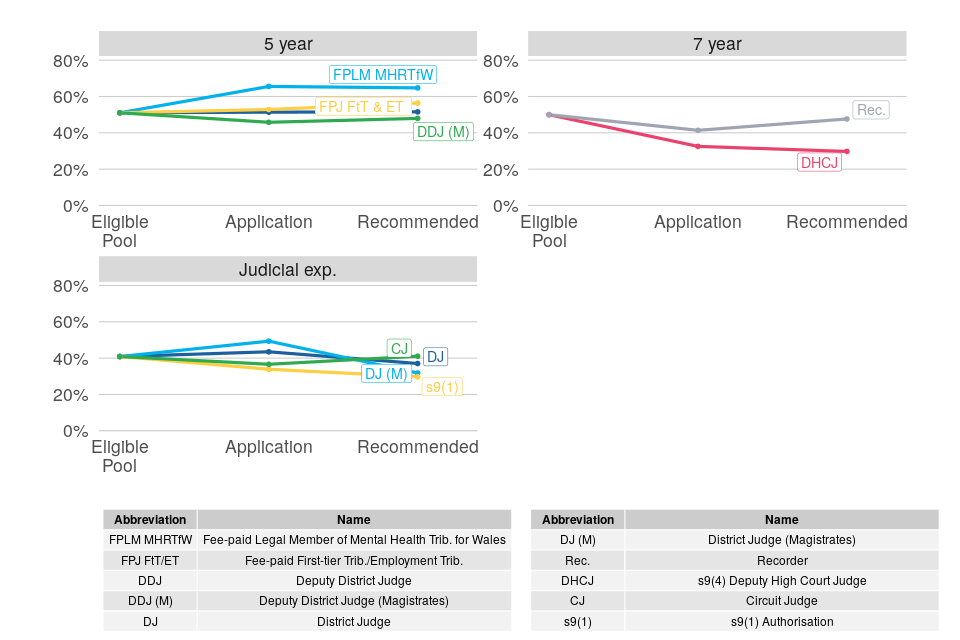
Representation percentages (Figure 5) help to show the progress of women at different stages of the selection process. In comparison to the eligible pool, the representation of women was higher at the recommendation stage for three of the ten large legal exercises, with one the same.
Figure 5: representation of women at different exercise stages, by eligible pool type (large legal exercises completed in 2021-22). Representation of women was higher at recommendation stage than in the eligible pool for three of the ten large legal exercises.
5.3 Judicial Office Holders
Female representation among judges in post has increased over recent years.
In the courts, women were less represented in the more senior posts. However, women made up more than half of senior posts in tribunals (presidents[footnote 26]). Women made up a higher proportion of new entrants compared to leavers over the past year.
Judges in post
As at 1 April 2022, women represented:
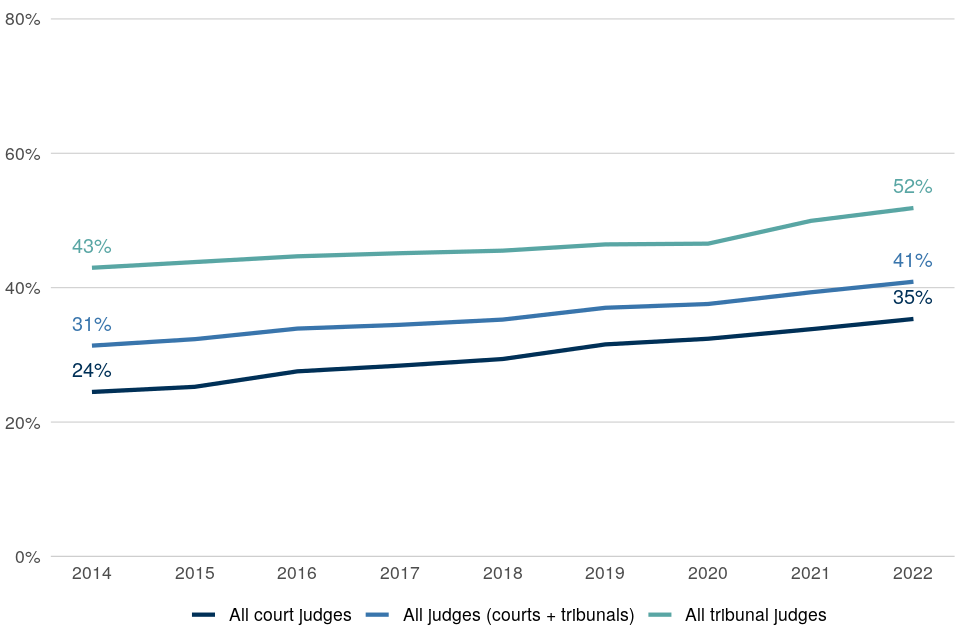
- 35% of all court judges – just less than 2 percentage points higher[footnote 27] than in 2021, and 11 percentage points higher than in 2014 (Figure 6).
- 52% of all tribunal judges – 2 percentage points higher than in 2020 and 9 percentage points higher than in 2014.
Figure 6: proportion of court and tribunal judges that were women as at 1 April, from 2014. The proportion of women judges remains lower in courts than tribunals and has increased more quickly in tribunals in the last year.
For context, women account for just over half of the general population aged 25-69[footnote 28] and just under half of the economically active population of England and Wales. However, as judicial roles require substantial legal experience, a direct comparison with the general population does not provide as much insight on the progression of representation of women in the judiciary than consideration of the makeup of the legal professions (as presented in the earlier section).
Entrants and leavers
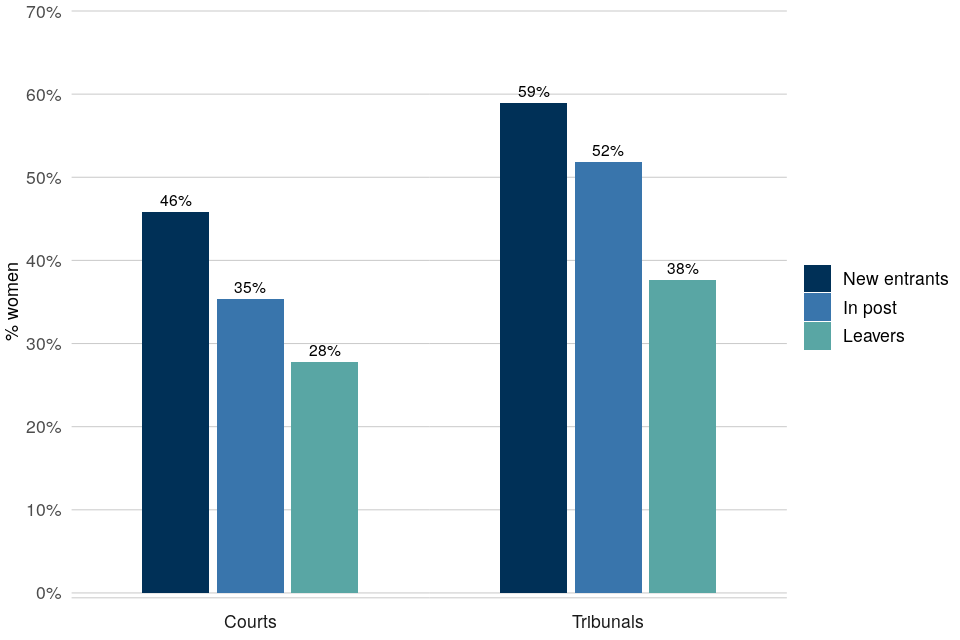
New entrants: the proportion of new entrants to the judiciary during 2021-22 – those not previously holding a judicial appointment – that were women was higher compared to judges in post as at 1 April 2022 for court judges and for tribunal judges[footnote 29] (Figure 7).
Promotions: Women made up 35% of promoted judges in courts and 63% of promoted judges in tribunals during 2021-22. These figures can be affected year-on-year by the mix of roles involved.
Leavers: A lower proportion of leavers from the judiciary were women compared to those in post, which reflects the lower proportion of older and more experienced judges that are women.
For example, of those in post at 1 April 2022, women made up 45% of court judges under age 50, compared with 31% of those aged 50 and over (and 23% of those aged 60 and over). Tribunals showed a similar pattern – women made up 57% of those under age 50, compared to 50% of those aged 50 and over.
Figure 7: representation of women among court and tribunal judges leaving and joining the judiciary, 1 April 2021 – 31 March 2022. Representation of women was higher among new entrants and those in post compared to leavers.
Patterns by type of appointment
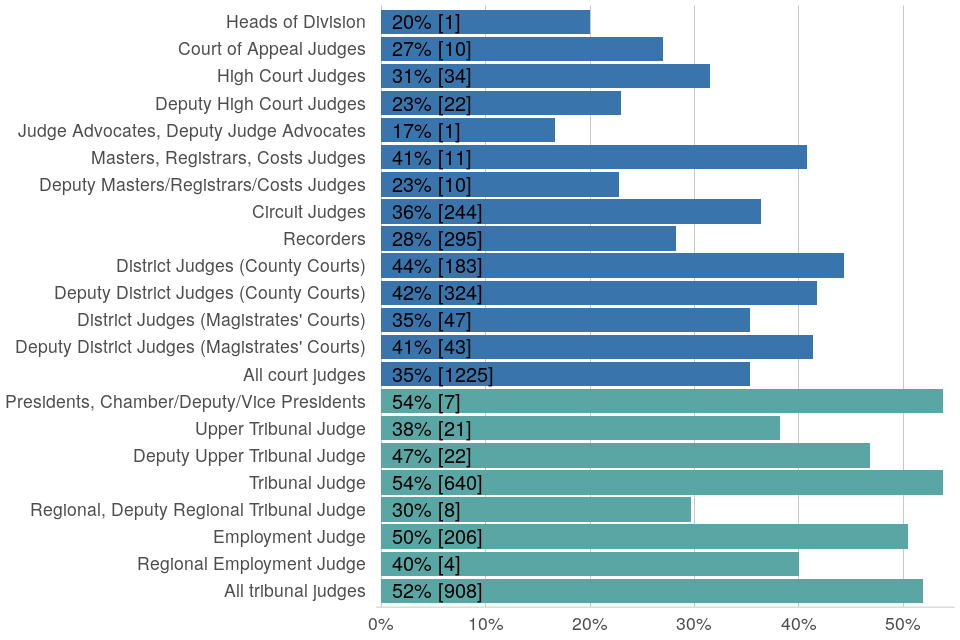
The representation of women across the judiciary varied by appointment type and seniority (Figure 8).
In the courts, women made up 30% of judges in more senior posts (High Court and above). The highest level of representation for women was among the District Judges (County Courts) at 44%.
In tribunals, women accounted for more than half of the most senior roles (Presidents)[footnote 29].
Figure 8: representation of women among court and tribunal judges by appointment, 1 April 2022. The representation of women is generally lower for more senior posts in the courts.
Patterns by region
The representation of women across the court judiciary also varies considerably by region, from 28% in Wales, to 45% in the South East. Variations may reflect the nature of the appointments in the different regions, as well as the underlying regional make-up of both the general population and the eligible pool. Further information is available in the accompanying data tables.
6. Ethnicity
6.1 Legal Professions
Representation of ethnic minorities in the legal profession is comparable to the proportion of the working age population of England and Wales from ethnic minority backgrounds[footnote 30].
Representation of individuals from ethnic minority backgrounds is lower among legal professionals with more experience and among higher seniority positions.
Overall Picture in Each Profession
As at 1 April 2022, considering each profession as a whole, ethnic minority individuals together constituted 16% of barristers, 18% of solicitors and 9% of Chartered Legal Executives, though representation of these ethnic minorities generally fell with increasing experience and seniority.
Individuals self-identifying as of Asian or Asian British ethnicity constituted 8% of barristers, 12% of solicitors and 5% of Chartered Legal Executives. Based on 2011 Census data, 8% of the working age population (16-64) in England and Wales are from Asian or Asian British backgrounds. The comparative economically active population (EAP) figure based on 2020 Annual Population Survey (APS) data was 7.4%.
Individuals self-identifying as of black or black British ethnicity constituted 3% of barristers, 3% of solicitors and 3% of Chartered Legal Executives. Based on 2011 Census data, 3% of the working age population are from black or black British backgrounds. The comparative EAP figure based on 2020 APS data was 3.6%.
Individuals self-identifying as having mixed ethnicity constituted 4% of barristers, 2% of solicitors and 2% of Chartered Legal Executives. Based on 2011 Census data, 2% of the working age population are from a mixed ethnic background. The comparative EAP figure based on 2020 APS data was 1.6%.
Individuals self-identifying their ethnicity as being in the other ethnic group (not Asian, black, mixed or white) constituted 1% of barristers, 2% of solicitors and 0% of Chartered Legal Executives. Based on 2011 Census data, 1% of the working age population are from other backgrounds. The comparative EAP figure based on 2020 APS data was 1.6%.
The representation of Asian or Asian British ethnicity was higher for solicitors compared to the working age or economically active populations, and the representation of individuals of mixed ethnicity was higher for all three legal professions compared to the working age or economically active populations.
Post Qualification Experience
In practice, most applicants for judicial roles have more than the minimum experience. For court and tribunal posts requiring at least 5 years’ experience, applicants have on average around 18 years’ experience[footnote 34]. Among legal professionals with 15 or more years’ PQE, ethnic minority individuals together make up 14% of barristers, 13% of solicitors and 5% of Chartered Legal Executives.
For court and tribunal posts requiring 7 years’ or more experience, applicants have on average around 20 years’ experience. Among legal professionals with 20 or more years’ PQE, ethnic minority individuals together make up 13% of barristers, 11% of solicitors and 4% of Chartered Legal Executives.
More detail on each of the minority groups is shown in Figure 9.
Figure 9: representation of ethnicity groups in legal professions by PQE band, April 2022 Note, the ethnicity declaration rates for solicitors in PQE bands 0-4 and 5-9 (5-6 and 7-9 combined) are below the required level for analysis, and so the representation percentages have been excluded from this publication.
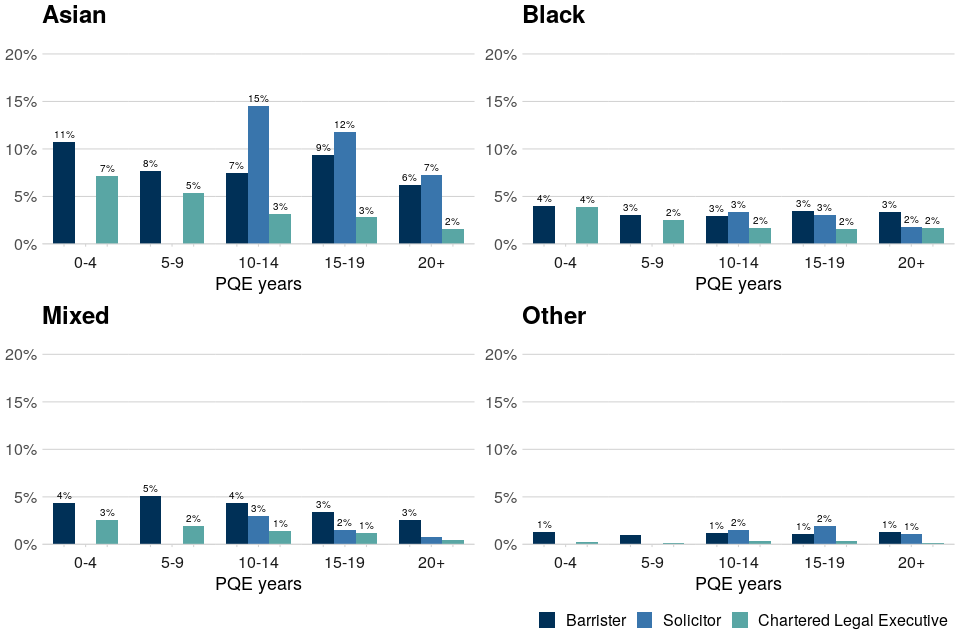
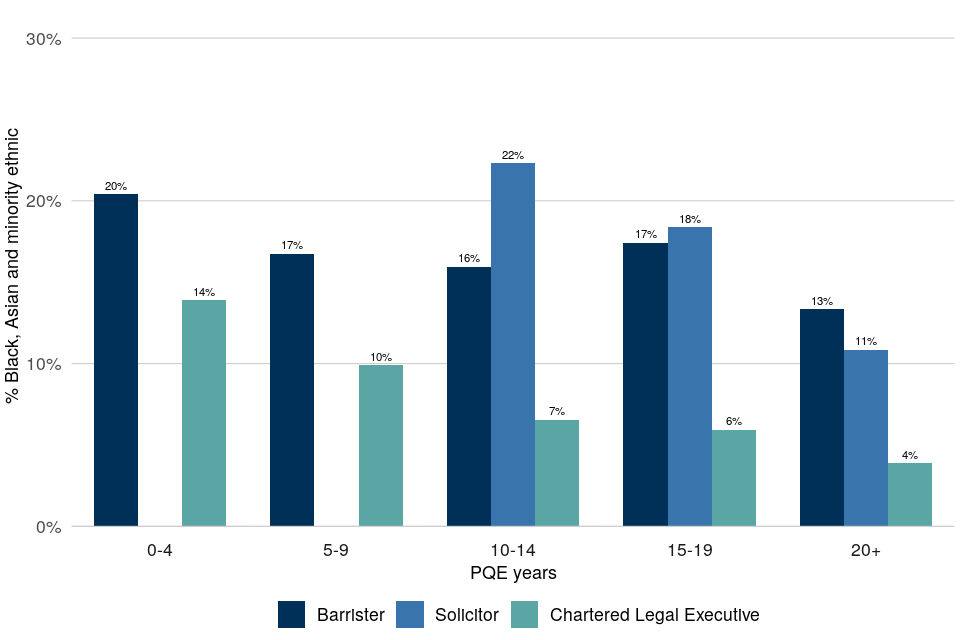
Figure 10: representation of ethnic minority in the legal professions by PQE band, April 2022 Note, the ethnicity declaration rates for solicitors in PQE bands 0-4 and 5-9 (5-6 and 7-9 combined) are below the required level for analysis, and so the representation percentages have been excluded from this publication. The drop-off in the proportion of ethnic minority individuals with experience is less prominent among barristers than for solicitors and CILex members.
Seniority[footnote 31]
For all three legal professions, ethnic minority individuals together constituted a smaller proportion of individuals at higher compared to lower seniority levels.
Black or black British individuals are less represented in higher seniority roles in all three legal professions. For Asian or Asian British individuals and those with mixed ethnicity this is the case for two of the three professions. For those with a self-declared ethnicity other than Asian, black, mixed or white, the pattern is true among solicitors and Chartered Legal Executives but not for barristers, where representation is slightly higher in the Queen’s Counsel (Figure 11).
Figure 11: representation of each ethnic minority group in the legal professions by seniority, April 2022 The proportion of ethnic minority individuals is lower at the more senior levels within all three professions.
6.2 Judicial Appointments: Applications and Selections
Single-year Analysis: 2021/2022
For all legal exercises completed in the latest year, the proportion of ethnic minority candidates decreased between each of the stages application to shortlisting to recommendation.
The data suggests that there is some disparity in judicial appointments for ethnic minority candidates relative to white candidates when comparing recommendation rates from the eligible pool.
For selection exercises that closed in the 2021-2022 financial year, group numbers at the application, shortlist and recommendation stages were not high enough to produce and publish statistics on a breakdown of ethnic minority ethnicities without risking disclosure of sensitive information. Therefore, for this most recent year of data, we consider candidates from ethnic minority backgrounds together as one group and compare their progression outcomes to white candidates.
Later in this section we have grouped together exercises from 2019 to 2022 in order to generate a sufficient sample of candidates from which we can look in more detail at ethnic minority backgrounds in the judicial appointments process.
Across all legal exercises in 2021-22, ethnic minority individuals accounted for 23% of applications, 15% of those shortlisted and 11% of those recommended for appointment.
1,759 applicants identified as ethnic minority, with 92 recommended for immediate appointment[footnote 32].
Overall, recommendation rates from the eligible pool for ethnic minority candidates were an estimated 37% lower than for white candidates, a difference that is statistically significant.
Overall View
Across all legal exercises in 2021-22:
- Eligible pool to recommendation rates for ethnic minority candidates were an estimated 37% lower than for white candidates (shown by the estimated[footnote 33] RRI of 0.63, Figure 13). This is within the range considered to be practically significant and it is statistically significant
- Ethnic minority candidates represented 23% of applications but 11% of recommendations, compared to comprising 17% of the eligible pool
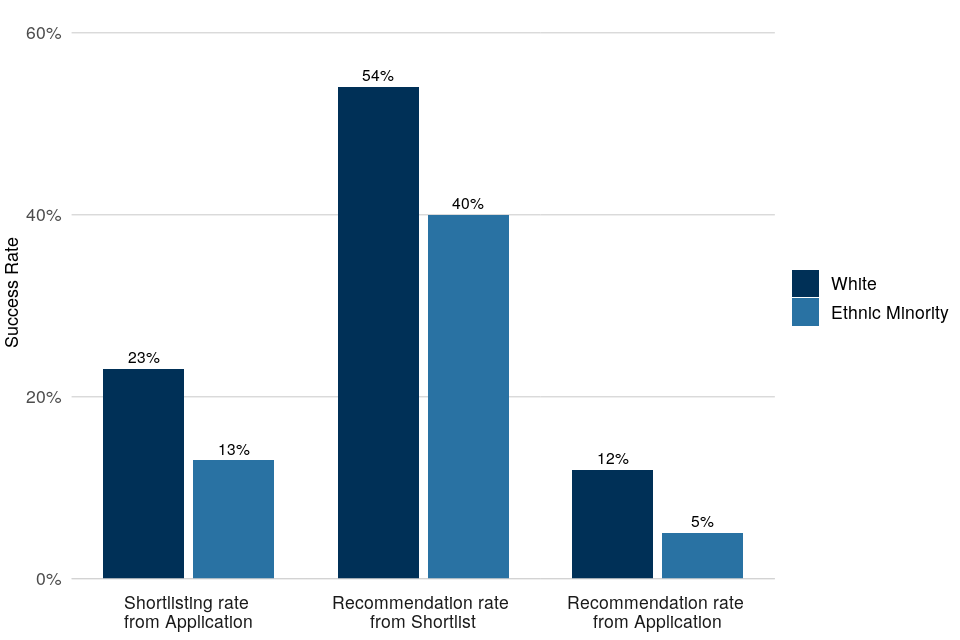
- The shortlisting rate from application was lower for ethnic minority candidates (13%) than white candidates (23%), and the recommendation rate from shortlist showed a similar difference, 40% compared to 54% respectively (Figure 12)
Figure 12: progression of applicants through the exercise stages by ethnicity (all legal exercises completed in 2021-22). Differences in both rates contributed to the overall difference in recommendation rates between white and ethnic minority candidates.
Exercise-specific Analysis
When considering ethnic minority candidates relative to white candidates:
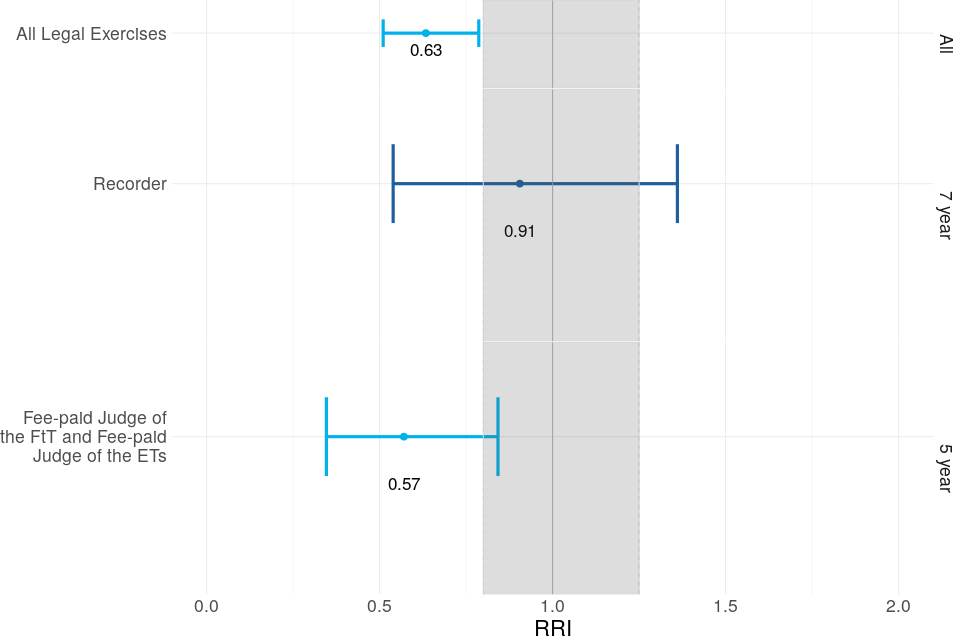
- In the Recorder exercise, one of the two exercises for which an RRI could be calculated (0.91), there is no evidence of a disparity from the eligible pool to recommendation. However, the RRI value for application to recommendation was a statistically significant 0.63. This suggests that there was evidence of disparity in the success between ethnic minority and white candidates when looking at applicants rather than the eligible pool.
- In the other exercise for which an RRI could be calculated, Fee paid Judge of the First-tier Tribunal and Fee paid Judge of the Employment Tribunal, the RRI values for recommendation from both the eligible pool and application were 0.57 and 0.40 respectively, both practically and statistically significant. This suggests evidence of a disparity in the success between ethnic minority and white candidates, when looking at either applicants or the eligible pool.
Figure 13: RRI for ethnic minority compared to white candidates from eligible pool to recommendation (large legal exercises completed 2021-22). Statistically significant results – where the confidence interval does not overlap the parity line - are light blue. The tolerance zone is shaded grey; results falling within this zone are considered to represent no practical disparity.
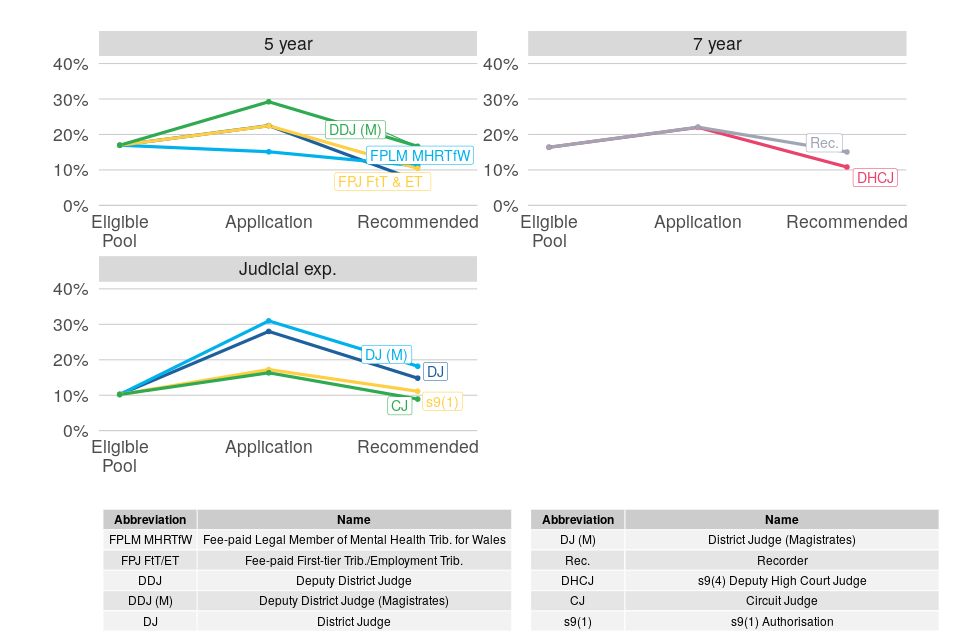
In nine of the ten large legal exercises in 2021/22, ethnic minority representation in applications was higher than in the corresponding eligible pool, but for all ten of the exercises ethnic minority representation in recommendations was lower than in applications (Figure 14).
There were three exercises (District Judge, District Judge (Magistrates) and s9(1) authority to Act as Judges of the High Court) that had higher ethnic minority representation in recommendations compared to the corresponding eligible pools, and one, Deputy District Judge (Magistrates), where the proportions were equal.
Figure 14: representation of ethnic minority candidates at different exercise stages, by eligible pool type (large legal exercises completed in 2021-22). Ethnic minority representation in exercises tended to be higher at the application stage than in the eligible pool, but lower at recommendation than at the application stage.
6.3 Judicial Appointments: Applications and Selections
Three-year Analysis: 2019 to 2022
In the past three years of legal exercises, Asian, black, and mixed ethnic minority individuals were over-represented in applications for judicial appointment. All four ethnic minority groups had lower recommendation rates than white candidates.
To present more detailed statistics on the progression of candidates from Asian, black, mixed and other ethnic backgrounds without risking disclosure of sensitive information, we have aggregated data from the three most recent years of judicial appointments. The statistics presented below are produced from data on selection exercises that closed between 1 April 2019 and 31 March 2022.
Across all legal exercises in this three-year period, ethnic minority candidates together constituted 24% of applications (4,025) and 12% of recommendations for appointment (239). The rate of recommendation from the eligible pool for ethnic minority candidates was an estimated 31% lower than the rate for white candidates (a statistically significant result) during this period.
Asian or Asian British
Across all legal exercises that closed between 1 April 2019 and 31 March 2022, overall:
- For all exercise types, representation among applicants was higher than it was in the eligible pool. Asian or Asian British candidates constituted 16% of applications but 7% of recommendations, compared to 11% of the eligible pool
- Recommendation rates from the eligible pool for Asian candidates were an estimated 37% lower than for white candidates (shown by the estimated RRI of 0.63). This estimate is statistically significant, meaning that we can be confident that this result represents a real difference between Asian and white candidate progression rates (Figure 16)
- For all exercise types, representation among recommended candidates was lower than representation among applications. The recommendation rate from application for Asian candidates (5%) was less than half that of white candidates (13%), largely reflecting differences at the shortlisting stage (Figure 15)
- The shortlisting rate from application for Asian candidates (15%) was half that of white candidates (29%) (Figure 16)
- The recommendation rate from the shortlist stage for Asian candidates (36%) was lower than it was for white candidates (46%)
When considering Asian candidates relative to white candidates, from the eligible pool to recommendation:
- In Recorder and Deputy District Judge exercises, representation among recommended candidates was statistically significantly lower than it was in the respective eligible pools, whereas for District Judge it was statistically significantly higher.
Black or black British
Across all legal exercises that closed between 1 April 2019 and 31 March 2022, overall:
- For all exercise types considered, black representation among recommended candidates was lower than among all applications. Black or black British candidates constituted 4% of applications but 1% of recommendations, compared to 3% of the eligible pool
- Recommendation rates from the eligible pool for black candidates were an estimated 75% lower than for white candidates (shown by the estimated RRI of 0.25). This estimate is statistically and practically significant, meaning that we can be confident that there is a real difference between black and white candidate progression rates (Figure 16)
- The recommendation rate from application for black candidates (2%) was around a fifth of that of white candidates (13%), with the differences at both shortlisting and recommendation stages compounding the overall effect (Figure 15)
- The shortlisting rate from application for black candidates (7%) was less than a quarter that of white candidates (29%)
- The recommendation rate from the shortlist stage for black candidates (29%) was about two-thirds that for white candidates (46%)
When considering black candidates relative to white candidates, from the eligible pool to recommendation:
- No individual exercise types had high enough numbers of black recommended candidates for an RRI covering all stages to be reliably calculated. An RRI is only available for black candidates across all legal exercises combined and is described above.
Mixed Ethnicity
Across all legal exercises that closed between 1 April 2019 and 31 March 2022, overall:
- Representation from those from a mixed ethnic background was higher at the application stage than it was in the eligible pool, except High court Judge where it was the same. Mixed ethnicity candidates constituted 3% of applications and 4% of recommendations, compared to comprising 2% of the eligible pool
- Recommendation rates from the eligible pool for mixed ethnicity candidates were an estimated 81% higher than for white candidates (shown by the estimated RRI of 1.81). This estimate is statistically and practically significant, meaning that we can be confident that there is a real difference between mixed and white candidate progression rates (Figure 16)
- The recommendation rate from application for mixed ethnicity candidates (12%) was close to that of white candidates (13%)
- The shortlisting rate from application for mixed ethnicity candidates (26%) was like that of white candidates (29%)
- The recommendation rate from the shortlist stage for mixed ethnicity candidates (46%) was the same as it was for white candidates (46%)
When considering candidates with mixed ethnic backgrounds relative to white candidates, from the eligible pool to recommendation:
- Only the Deputy District Judge and Recorder exercises between 2019 and 2022 had sufficient numbers of recommended candidates with mixed ethnicity to calculate a reliable RRI estimate. The estimates were that the mixed ethnicity candidates’ progression rate was not statistically significantly different from the rate for white candidates
Other Ethnicities
Across all legal exercises that closed between 1 April 2019 and 31 March 2022, overall:
- Candidates with an ethnicity other than Asian, black, mixed or white constituted 1% of applications and 1% of recommendations, compared to 1% of the eligible pool
- Recommendation rates from the eligible pool for candidates from other ethnic backgrounds were an estimated 52% lower than the rates for white candidates (shown by the estimated RRI of 0.48), a statistically and practically significant result (Figure 16)
- The recommendation rate from application for “other” candidates (11%) was close to that of white candidates (13%)
- The shortlisting rate from application was slightly higher for “other” candidates (33%) than white candidates (29%)
- The recommendation rate from the shortlist stage for “other” candidates (34%) was lower than that for white candidates (46%)
When considering other ethnic minority candidates relative to white candidates, from the eligible pool to recommendation:
- No individual exercise types had high enough numbers of other ethnicity recommended candidates for an RRI covering all stages to be reliably calculated. An RRI is only available for other ethnicity candidates across all legal exercises combined and is described above
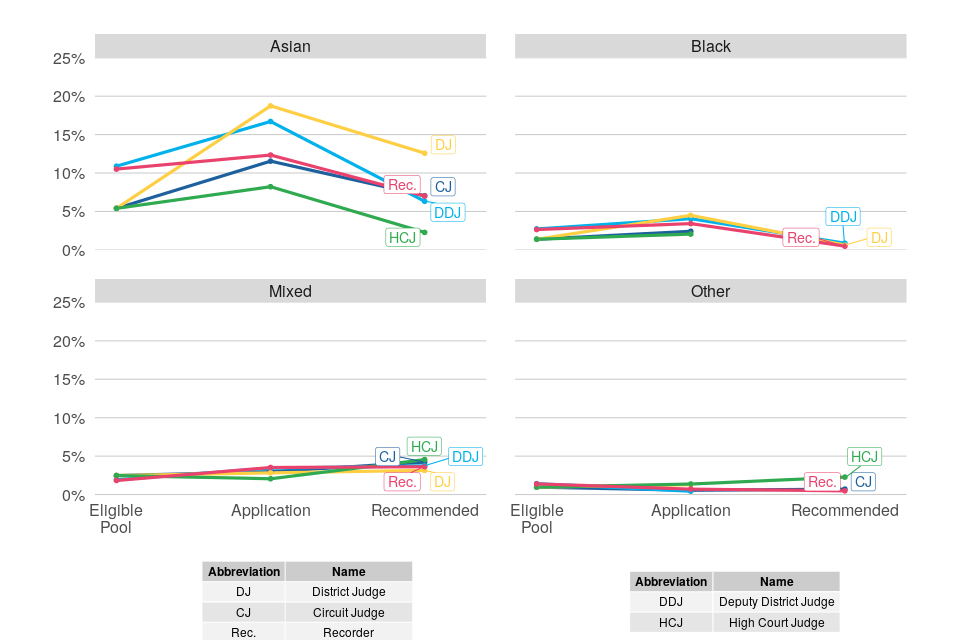
Figure 15: progression of applicants through the exercise stages by ethnicity (all legal exercises completed between April 2019 and March 2022)
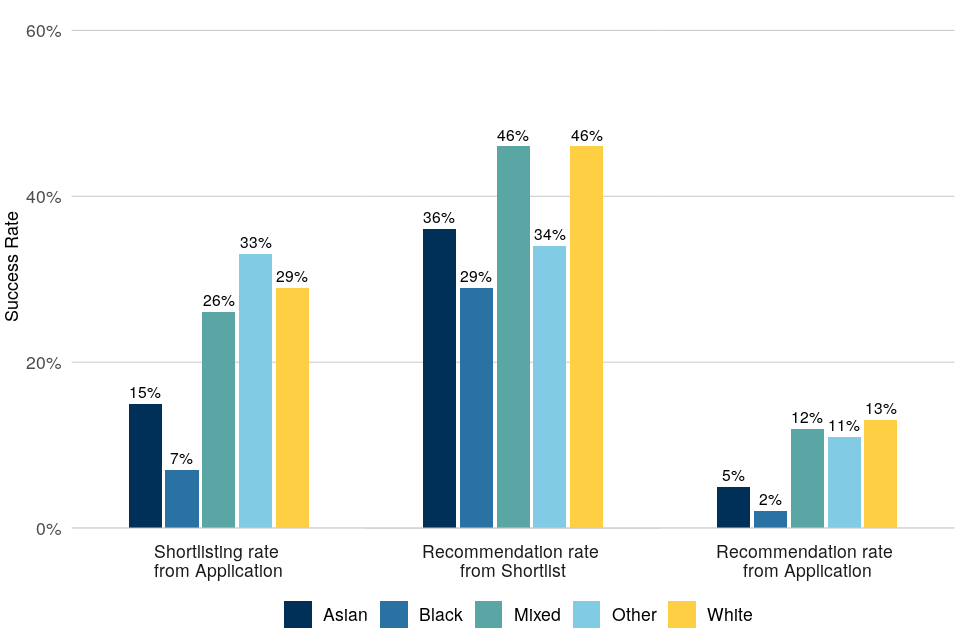
Figure 16: RRI for ethnic minorities compared to white candidates from eligible pool to recommendation, in legal selection exercises between April 2019 and March 2022. Statistically significant results – where the confidence interval does not overlap the parity line - are shown in light blue. The tolerance zone is shaded grey; results falling within this zone are considered to represent no practical disparity.
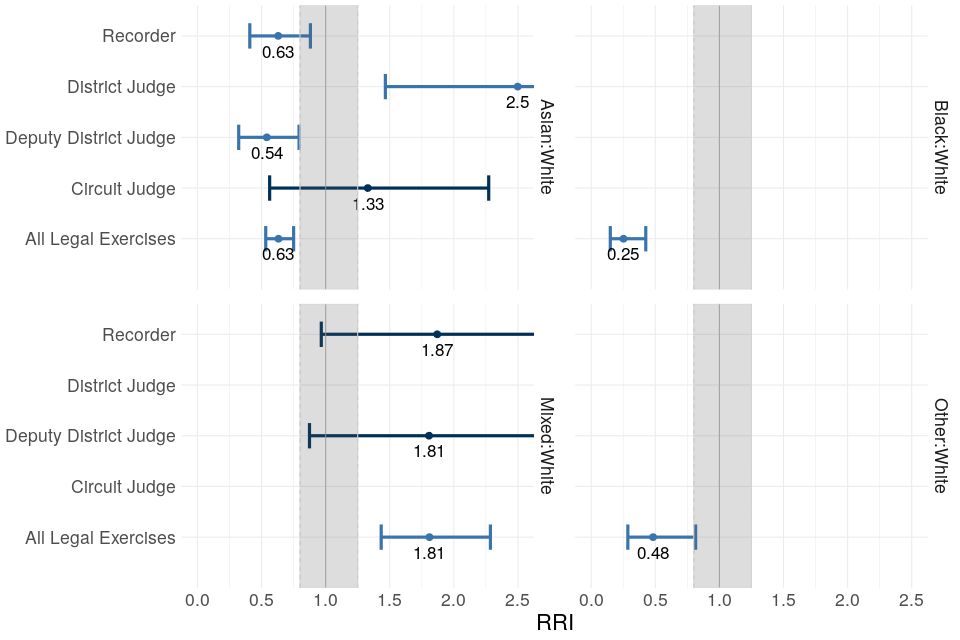
Figure 17: representation of ethnic minority candidates at different exercise stages, legal exercises between April 2019 and March 2022
6.4 Judicial Office Holders
The proportion of Asian and mixed ethnicity individuals in the judiciary has slowly increased since 2014, while the proportion of black and other ethnic minority individuals has stayed the same in that time. Proportions of ethnic minorities remain lower in senior court roles.
Judges in post
As at 1 April 2022, of all judges in post for courts and tribunals combined:
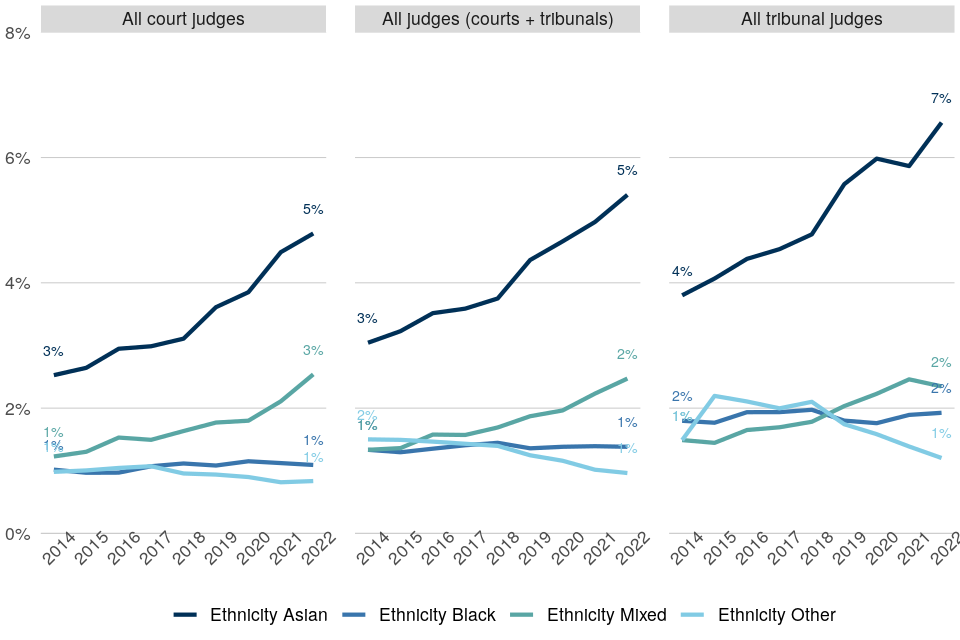
- 5% were Asian or Asian British - a rise of 2 percentage points since 2014 (which is equivalent to a more than 50% increase in representation)
- 1% were black or black British - no change since 2014
- 2% were mixed ethnicity - 1 percentage point higher than in 2014 (which is equivalent to a doubling of representation in that time)
- 1% were individuals with ethnicity other than Asian, black, mixed or white - no change since 2014
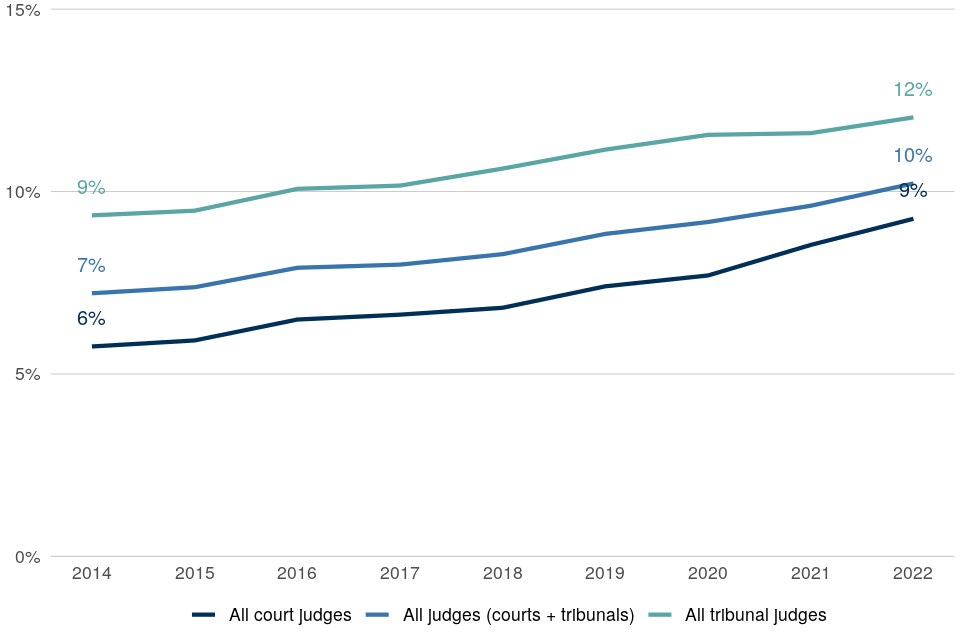
Ethnic minority individuals together constituted 10% of all judges - 3 percentage points higher than in 2014[footnote 34].
The representation of ethnic minorities varied with appointment type and was lower for senior court posts (5% for High Court and above).
A further breakdown across courts and tribunals is shown in Figure 18.
Figure 18: representation of ethnic minority individuals among court and tribunal judges, 2014 to 2022. Ethnic minority representation has increased slightly in recent years.
As very broad context, comparisons can be made between the ethnic minority representation among judges with that of the general working age (25-69) population of England and Wales, by age group, as determined by the 2011 Census[footnote 35] (Figure 19). However, this may not be an entirely suitable comparator because the 2011 Census data is ten years out of date, and judges tend to be drawn from the upper end of the age distribution. For these reasons, characteristics of the legal professions, presented above, may provide more appropriate context when comparing the ethnic minority proportion among the judiciary - namely 10% of all judges being of ethnic minority compared to 16% of all barristers, 18% of all solicitors and 9% of all Chartered Legal Executives.
Despite limitations in making comparisons, the age of judges should be kept in mind when considering variations in the proportion of ethnic minority, for example by appointment type.
Figure 19: representation of ethnic minority individuals by age group - court and tribunal judges (2022) compared to general population (2011 Census)[footnote 36]
Entrants, Promotions and Leavers
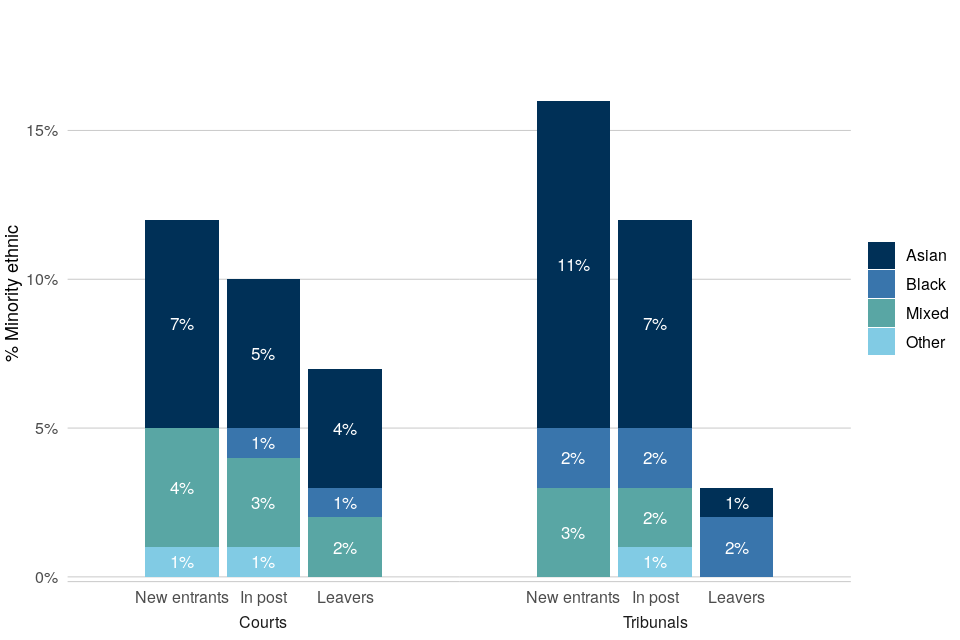
Entrants: for court and tribunal judges in 2021-22, the proportion of ethnic minority individuals entering the judiciary was higher than of those in post as at 1 April 2022 for both courts and tribunals (Figure 20). As with gender, these figures are likely to fluctuate depending on which roles were appointed during the year.
Representation of Asian and mixed ethnicities were higher in new entrants than it was for all in post judges in the courts and tribunals. black or black British individuals constituted no new entrants to the courts and 2% to the tribunals’ judiciary.
Promotions: Ethnic minority individuals constituted 12% of promotions in the courts and 19% of promotions in the tribunals.
Leavers: conversely, a lower proportion of judges leaving the judiciary – who are older on average – in 2021-22 were ethnic minority (7%) compared to those in post (10%) (Figure 20).
Figure 20: representation of ethnic minority individuals among court and tribunal judges leaving and joining the judiciary, 1 April 2021 – 31 March 2022 The representation of ethnic minority individuals was higher among new entrants and in post than leavers.
Patterns by type of appointment
Due to small numbers for individual ethnicity groups within the ethnic minority category, here we only consider the aggregated category overall.
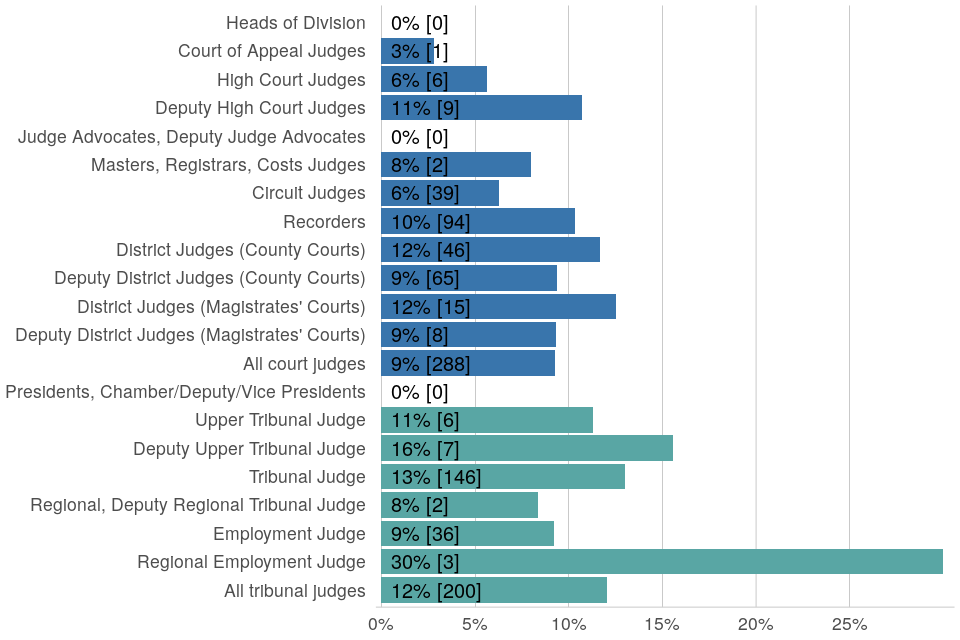
In the courts, representation of ethnic minority individuals was fairly high for Deputy High Court Judges (Figure 21) but otherwise generally lower for the more senior appointments (e.g. Court of Appeal, High Court and Circuit Judge) with 5% of judges in the High Court or above being of ethnic minority background.
Ethnic minority representation was higher among judges of the Upper Tribunals than tribunals overall, though there were no ethnic minority judges whose primary appointment was in the most senior tribunal positions (presidents).
Figure 21: representation of ethnic minority individuals among court and tribunal judges by appointment, 1 April 2022. The representation of ethnic minority individuals varied with appointment-type, but there was no clear pattern with regards to seniority.
Patterns by region
Over half (52%) of all court judges who declared their ethnicity as ethnic minority were based in London, compared to only 2% in Wales and 5% in the South East and South West.
The proportion of ethnic minority court judges also varied by region, from 12% in London and the Midlands, to 3% in Wales and 4% in the South West.
This is likely to reflect, to some extent, variations in the ethnic minority proportion of general population by region, which is considerably higher in London than other regions.
7. Intersection of Gender and Ethnicity
7.1 Legal Professions
Representation of gender-ethnicity intersection groups varies across the legal professions. For barristers representation of white men is higher, but for Chartered Legal Executives it is white women.
Across each whole profession:
- Ethnic minority men constituted 8% of barristers, 8% of solicitors and 2% of Chartered Legal Executives
- Ethnic minority women constituted 7% of barristers, 11% of solicitors and 7% of Chartered Legal Executives
- White women constituted 32% of barristers, 41% of solicitors and 70% of Chartered Legal Executives
- White men constituted the remaining 52% of barristers, 40% of solicitors and 21% of Chartered Legal Executives
Post Qualification Experience
Among legal professionals with 15 or more years’ PQE:
- Ethnic minority men constituted 8% of barristers, 6% of solicitors and 1% of Chartered Legal Executives
- Ethnic minority women constituted 6% of barristers, 7% of solicitors and 4% of Chartered Legal Executives
- White women constituted 27% of barristers, 38% of solicitors and 71% of Chartered Legal Executives
- White men constituted the remaining 59% of barristers, 48% of solicitors and 25% of Chartered Legal Executives
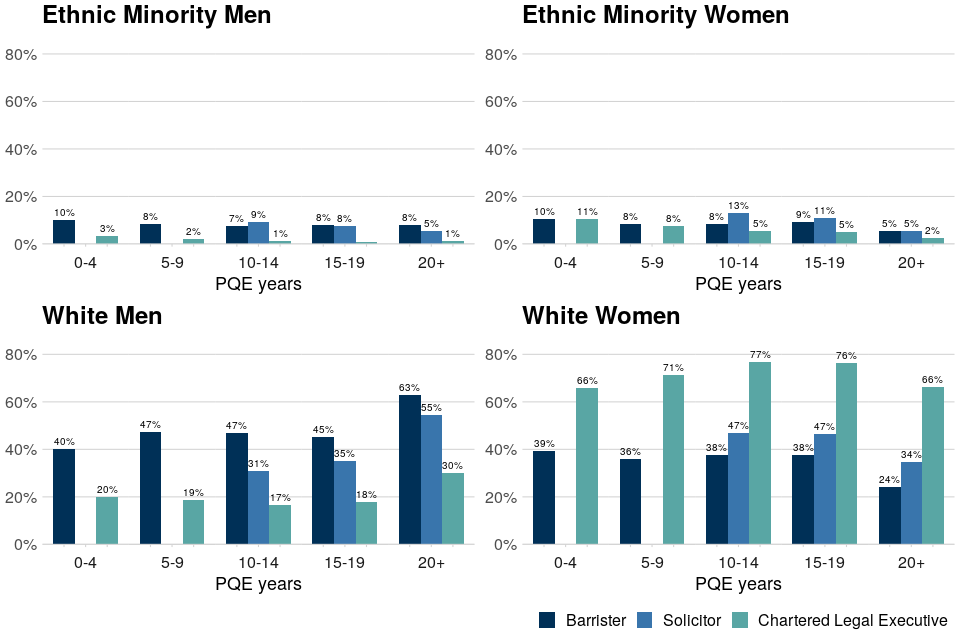
Figure 22: representation of gender-ethnicity intersection groups by profession at different levels of PQE as at 1 April 2022. Note, the ethnicity declaration rates for solicitors in PQE bands 0-4 and 5-9 (5-6 and 7-9 combined) are below the required level for analysis, and so the representation percentages have been excluded from this publication.
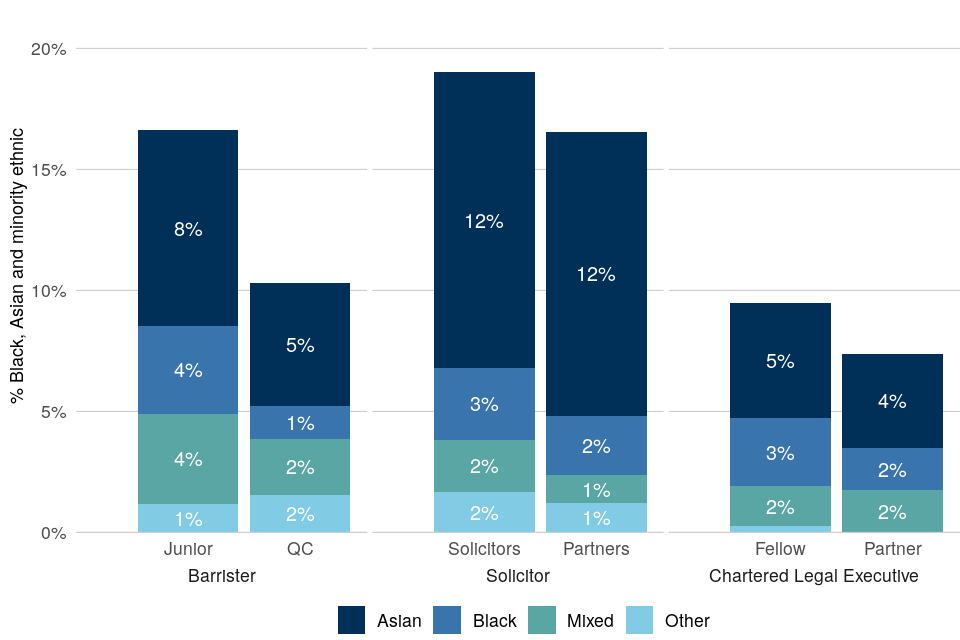
Seniority
Ethnic minority women have lower representation in higher seniority positions in all three legal professions (Figure 23).
Representation of ethnic minority men is consistent for junior barristers and Queen’s Counsel but is lower for solicitors and Chartered Legal Executives in their respective junior positions.
Like ethnic minority women, white women have lower representation in higher seniority positions in all three legal professions.
White men are the only gender-ethnicity intersection group for which representation is higher in more senior positions in all three legal professions.
Figure 23: Representation of gender-ethnicity intersection groups by profession and seniority
7.2 Judicial Appointments: Applications and Selections
Three-year analysis: 2019 to 2022
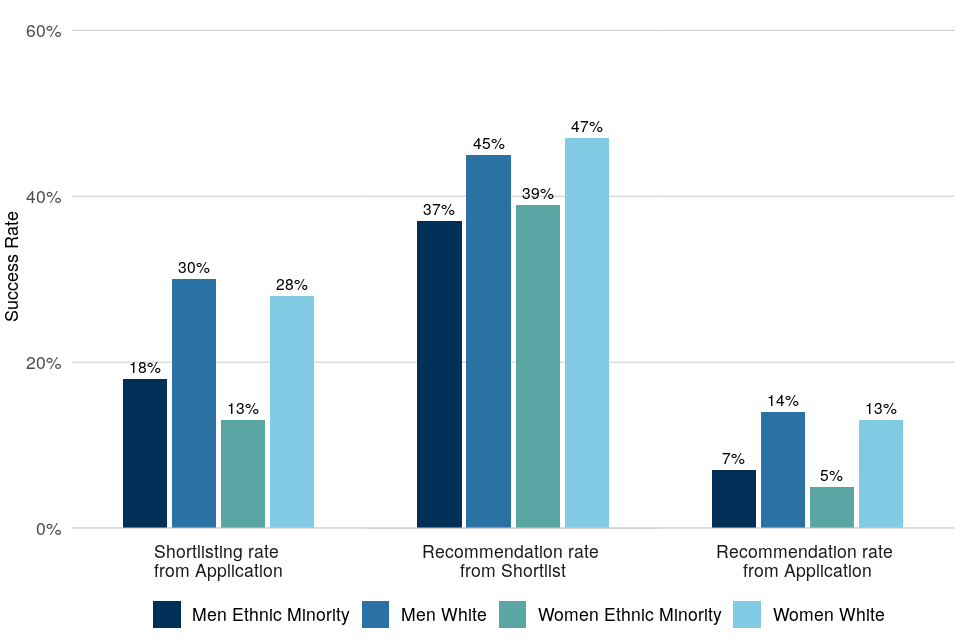
Representation of both ethnic minority men and women is higher among applications than recommendations. Both groups have lower recommendation rates than white candidates.
To produce the following statistics on gender-ethnicity groups in the judicial appointments process in a sufficiently robust way, data from the most recent three years of completed exercises (April 2019 to March 2022) was aggregated. Counts and percentages therefore cover applications and recommendations across the whole three-year period.
Overall View
Across all legal exercises that completed between 1 April 2019 and 31 March 2022, ethnic minority men:
- Constituted 11% of applications and 7% of recommendations, compared to 7% of the eligible pool
- Were recommended from the eligible pool at an estimated rate that was 20% lower than that of white men (shown by the estimated RRI of 0.80). This estimate is statistically significant, but on the cusp of being practically significant (Figure 25)
Across all legal exercises that completed between 1 April 2019 and 31 March 2022, ethnic minority women:
- Constituted 13% of applications and 6% of recommendations, compared to 9% of the eligible pool
- Were recommended from the eligible pool at an estimated rate that was 47% lower than that of white men (shown by the statistically significant estimated RRI of 0.53, Figure 25)
- Were recommended from the eligible pool at an estimated rate that was 40% lower than that of white women (shown by the statistically significant estimated RRI of 0.60, Figure 25)
- Were recommended from the eligible pool at an estimated rate that was 34% lower than that of ethnic minority men (shown by the statistically significant estimated RRI of 0.66, Figure 25)
Across all legal exercises that completed between 1 April 2019 and 31 March 2022, white women:
- Constituted 36% of applications and 40% of recommendations, compared to 41% of the eligible pool
- Were recommended from the eligible pool at an estimated rate that was 13% lower than that of white men candidates (shown by the statistically significant estimated RRI of 0.87, Figure 25), though this is not of practical significance.
Figure 24: progression rates of gender-ethnicity intersection groups through the exercise stages, all legal exercises between April 2019 and March 2022
Exercise-specific Analysis
Progression differences between intersection groups varied depending on the exercise (Figure 25). For example, in District Judge exercises across the past 3 years, the progression rate of ethnic minority women from the eligible pool to recommendation was nearly double that of white men (indicated by the estimated RRI of 1.91, Figure 25), though this is not statistically significant. However, ethnic minority women are nearly three-times more likely to apply from the eligible pool compared to white men (RRI value of 2.94, Table 2.8) leading to the RRI value for application to recommendation to be a statistically significant 0.54 (Table 2.8). That is when looking at applicants rather than the eligible pool, the success rate of ethnic minority women was half rather than double that of white men.
In Recorder and Deputy District Judge exercises, the progression rate of ethnic minority women was significantly less than that of white men, when looking at either eligible pool or application to recommendation.
Figure 25: RRI for gender-ethnicity intersection groups compared to white men, from eligible pool to recommendation, legal exercises between April 2019 and March 2022
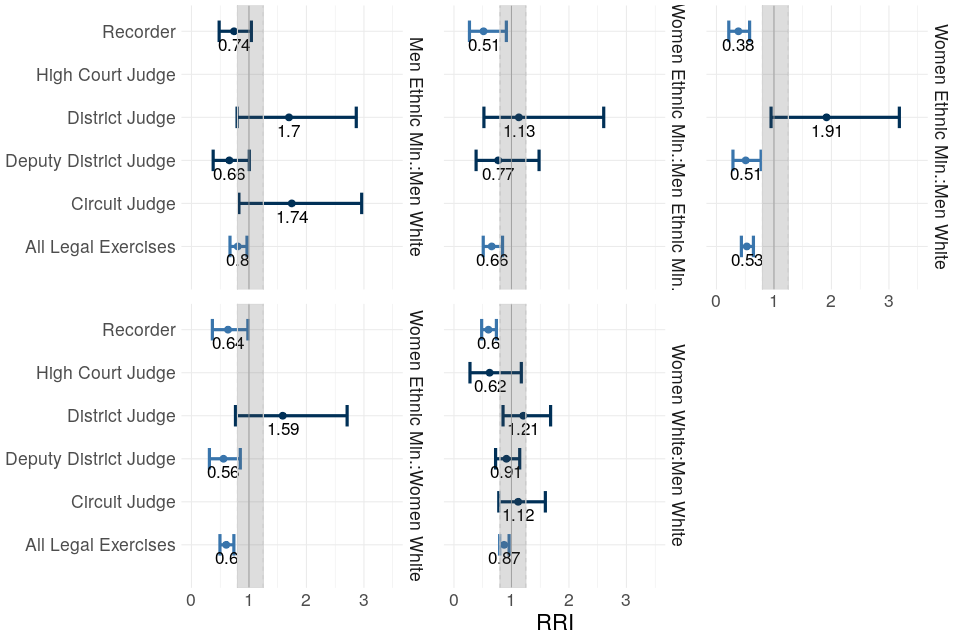
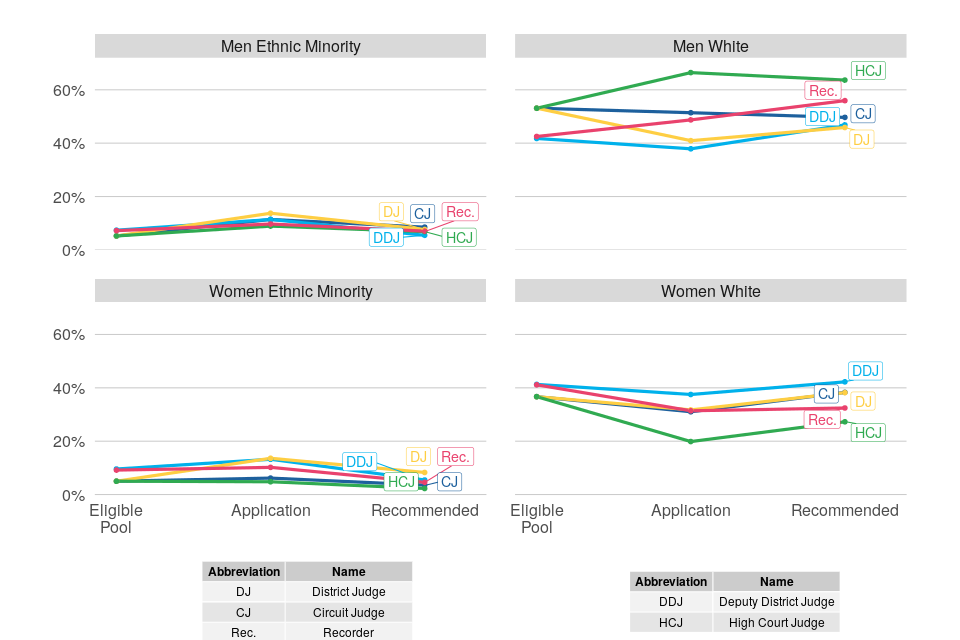
Figure 26: representation of gender-ethnicity intersection groups at different exercise stages, in legal exercises between April 2019 and March 2022 (eligible pool percentages from 2022 only)
7.3 Judicial Office Holders
More than half of the judiciary are white men and over a third are white women. Ethnic minority men and women each account for 5% of judges.
Judges in post
At 1 April 2022:
- Ethnic minority men constituted 5% of court judges, 5% of tribunal judges and 5% of judges overall (Figure 27)
- Ethnic minority women constituted 4% of court judges, 7% of tribunal judges and 5% of judges overall
- White women constituted 32% of court judges, 45% of tribunal judges and 37% of judges overall
- White men constituted the remaining 59% of court judges, 43% of tribunal judges and 53% of judges overall
Figure 27: representation of different gender-ethnicity groups in judges in post, April 2022
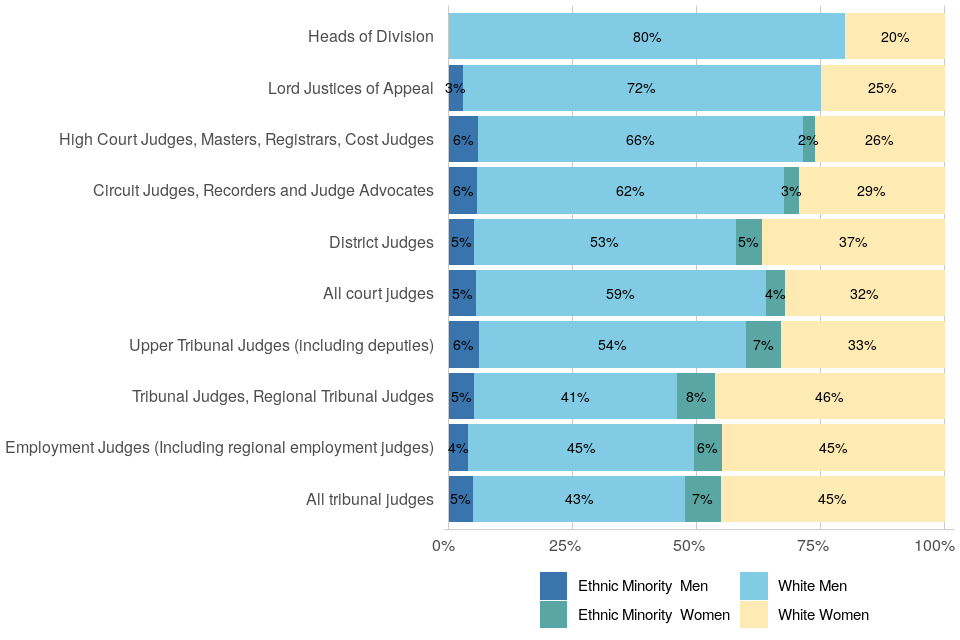
Patterns by type of appointment
A substantial majority of senior court judicial posts (High Court and above) are held by white men (Figure 28). Tribunal posts tend to have higher proportions of white women and ethnic minority women than court posts.
The proportion of white men is also higher for judges in courts (59%) than judges in tribunals (43%). This difference is further extended for senior court posts as, for High Court and above, 67% of post holders are white men. Ethnic minority men made up 5% of these senior positions, whilst ethnic minority women made up 2% and white women made up the remaining 26%.
Figure 28: representation of gender-ethnicity groups by primary appointment, April 2022
8. Professional Background
8.1 Judicial Appointments: Applications and Selections
Across all legal exercises in 2021-2022, there was a higher representation of solicitors (45%) than barristers (39%) among applications, but solicitors constituted a smaller percentage of recommendations (27% compared to 54%). Chartered Legal Executives constituted 1% of all applications.
The professional background of applicants for judicial appointment is analysed using two separate methods:
-
“current legal role” compares applicants who have declared their current legal role as solicitor with those declaring their current legal role as barrister[footnote 37]
-
“ever legal role”[footnote 38] compares those who have ever been a solicitor to those who have ever been a barrister. This includes those who currently hold a legal role of barrister or solicitor and those who have declared holding the role of barrister or solicitor at any stage in their career[footnote 39].
Around 10% more applicants were identified as solicitors using the wider definition of ever legal role, though the same broad patterns are shown for both measures and as a result the focus below is on the ‘ever legal role’[footnote 40].
Overall, 94 applicants (1%) declared holding the role of CILEX professional at application. 9 of these were shortlisted and 2 recommended for immediate appointment. It is important to note that CILEX fellows are only eligible to apply for a limited number of legal exercises and given the small numbers are not considered further here[footnote 41].
Overall View
Across all legal exercises in 2021-22:
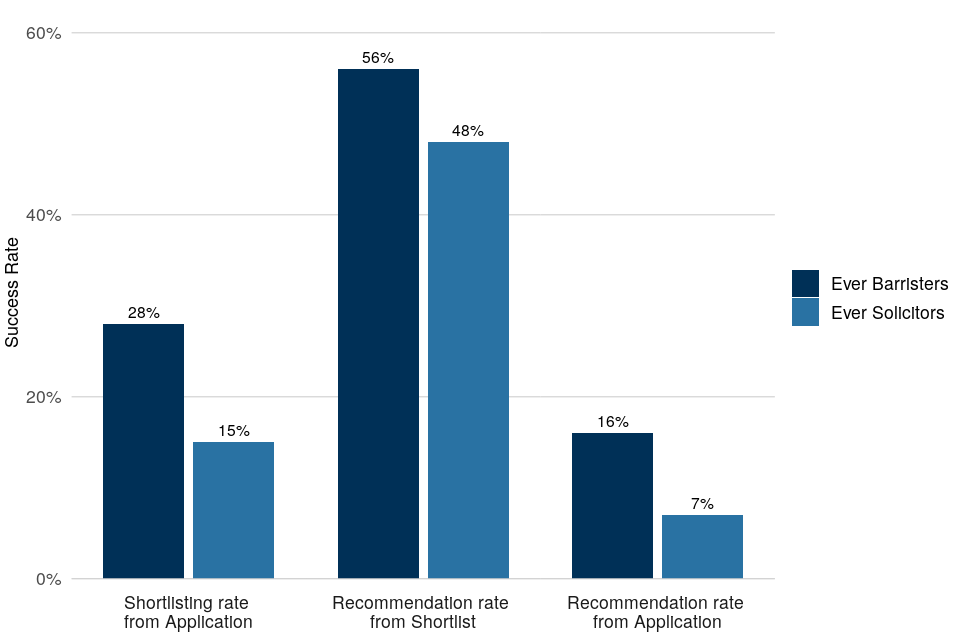
- From application[footnote 42] to recommendation, we can be confident that a disparity of practical significance exists between solicitors and barristers; “ever” solicitors were 53% less likely to be successful than “ever” barristers (shown by the statistically significant RRI of 0.47; for current solicitors relative to current barristers, the equivalent RRI is 0.44)
- “Ever” solicitors made up 37% of the recommendations for appointment (compared to 63% for “ever” barristers). For current solicitors, the equivalent figure was 27% (compared to 54% for barristers and 19% for other roles)
- Recommendation rates for “ever” solicitors were lower than for “ever” barristers, with the biggest difference going from application to shortlisting (Figure 29). A similar pattern exists for the current legal role measure.
Figure 29: progression of applicants through the exercise stages by “ever legal role” (all legal exercises completed in 2021-22)[footnote 43]. Representation of solicitors fell from application to shortlisting, and from shortlisting to recommendation.
Exercise-specific Analysis
Considering the results for individual exercises:
- in all five legal selection exercises large enough to reliably calculate an RRI, there was a disparity in success rates from application to recommendation for “ever” solicitors compared to “ever” barristers large enough to be considered practically significant. In all but one of these cases (District Judge) the difference was statistically significant so we can conclude that there is a real disparity between progression rates of solicitors and barristers in these exercises (Figure 30)
- Figure 31 shows that for two exercises, District Judge and District Judge (Magistrates), there was a higher representation rate for “ever” solicitors at the eligible pool stage compared to recommendation stage
- comparing representation rates for “ever” solicitors at application and recommendation stages, Figure 31 also shows that the proportion of both applicants and recommendations that are “ever” solicitors is typically lower for the more senior court posts (for example, High Court Judge and Circuit Judge)
Figure 30: RRI for “ever” solicitors compared to “ever” barristers, from application to recommendation (large legal exercises completed in 2021-22). Statistically significant results – where the confidence interval does not overlap the parity line - are light blue. The tolerance zone is shaded grey; results falling within this zone are considered to represent no practical disparity.
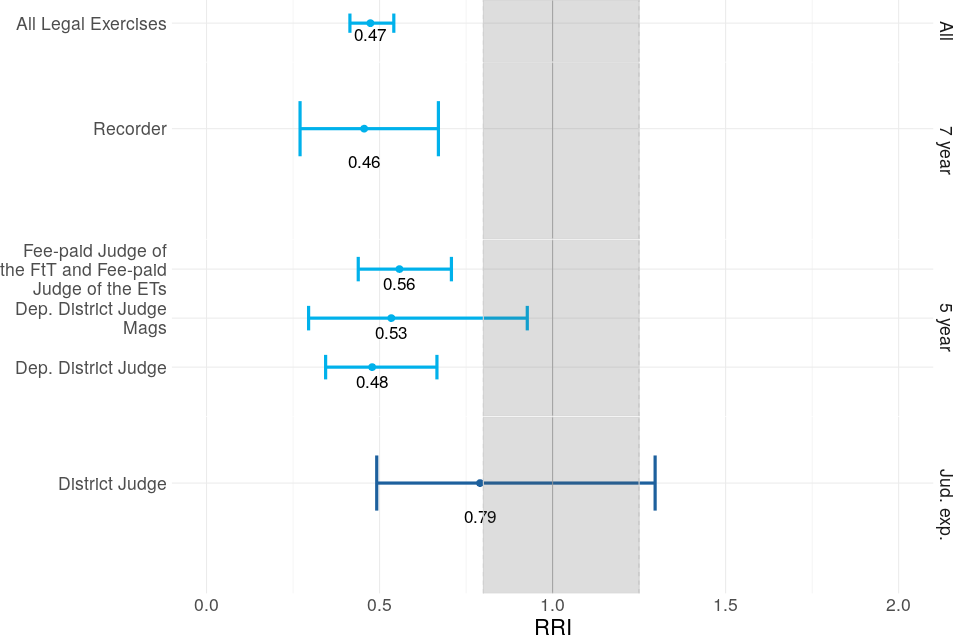
Figure 31: representation of “ever” solicitors at different exercise stages, by eligible pool type (large legal exercises completed in 2021-22). Solicitor representation fell between application and recommendation in all but 2 of the 10 exercises.
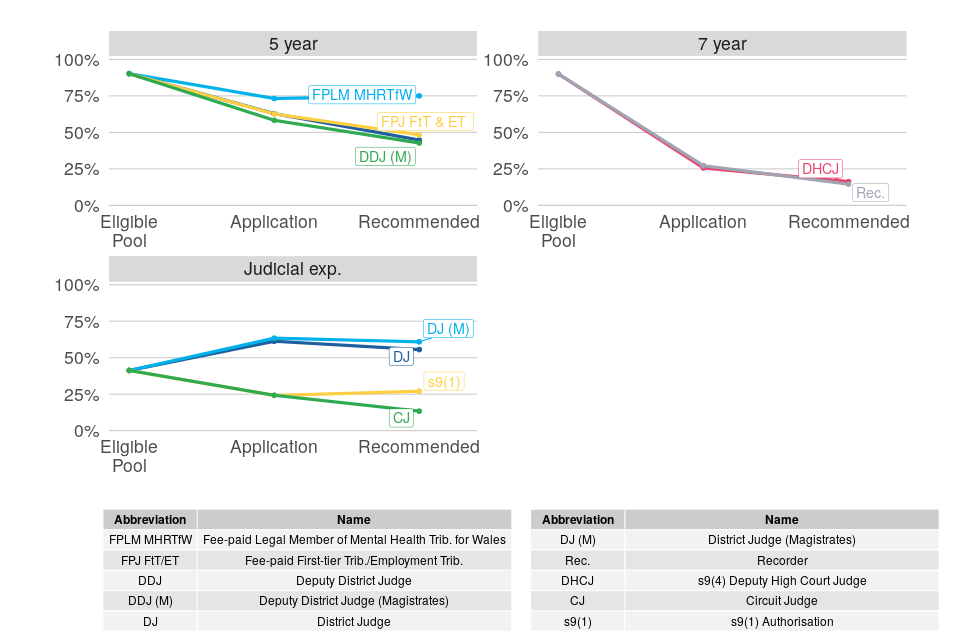
8.2 Judicial Office Holders
Most court judges have a background as a barrister, though this is not the case with tribunal judges.
Judges in post
As at 1 April 2022:
- non-barristers represented 31% of all court judges and 63% of all tribunal judges. Compared to 2014, this is a 5 percentage-point decrease among court judges, and compared to 2015 a 5 percentage-point decrease among tribunal judges (Figure 32)[footnote 44]
- the majority of judges from a non-barrister background were former solicitors with only 6 court judges and 37 tribunal judges coming from a legal executive or any other legal background[footnote 45]
Figure 32: representation of non-barristers among court and tribunal judges, 2014 to 2022. Non-barristers remain better represented among tribunal judges, though non-barrister representation has reduced over time in both courts and tribunals.
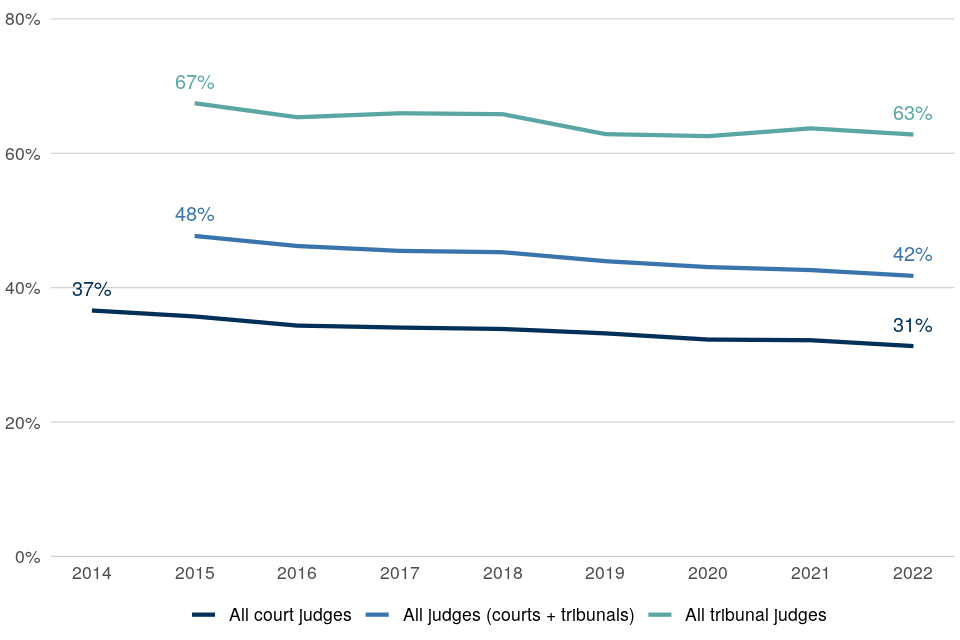
Entrants and leavers
For court judges, in 2021-22, the proportion of non-barristers leaving the judiciary (36%) was slightly higher than of those in post (31%) and those entering (25%) (Figure 33). For tribunal judges the pattern was the same with the proportion of leavers (69%) higher than those in post (63%) and new entrants (55%).
The decreasing proportion of non-barristers in post among court and tribunal judges can be associated with the finding that a higher proportion of leavers, compared to new entrants, were non-barristers.
For court and tribunal judges, the proportion of those promoted from non-barrister backgrounds were in the same range as each other, at 31% and 38% respectively.
Figure 33: representation of non-barristers among court and tribunal judges leaving and joining the judiciary, 1 April 2021 – 31 March 2022. The representation of non-barristers was higher among leavers compared to new entrants and those in post, especially for court judges.
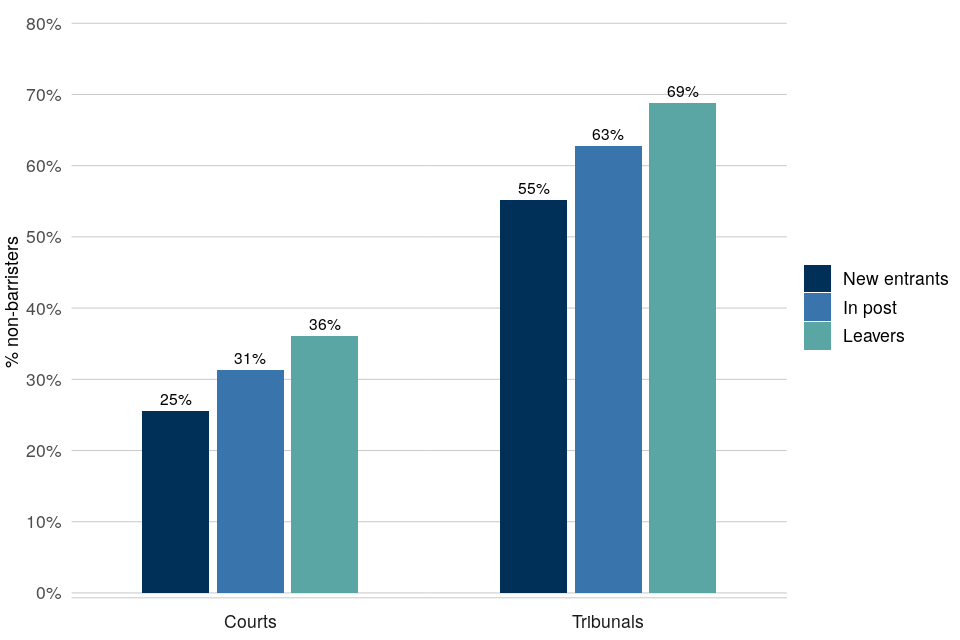
Patterns by type of appointment
Within the courts, non-barristers had a higher representation among the less senior judicial posts. 5% of all judges in the senior posts (High Court and above) were non-barristers (Figure 34). Conversely, the non-barristers proportion among District Judges and Deputy District Judges was at least 56%.
Within the tribunals, representation of non-barristers was more evenly distributed across the different appointments.
Figure 34: representation of non-barristers among court and tribunal judges, by appointment, 1 April 2022. The representation of non-barristers was higher among the less senior posts in the courts but was evenly distributed in the tribunals.
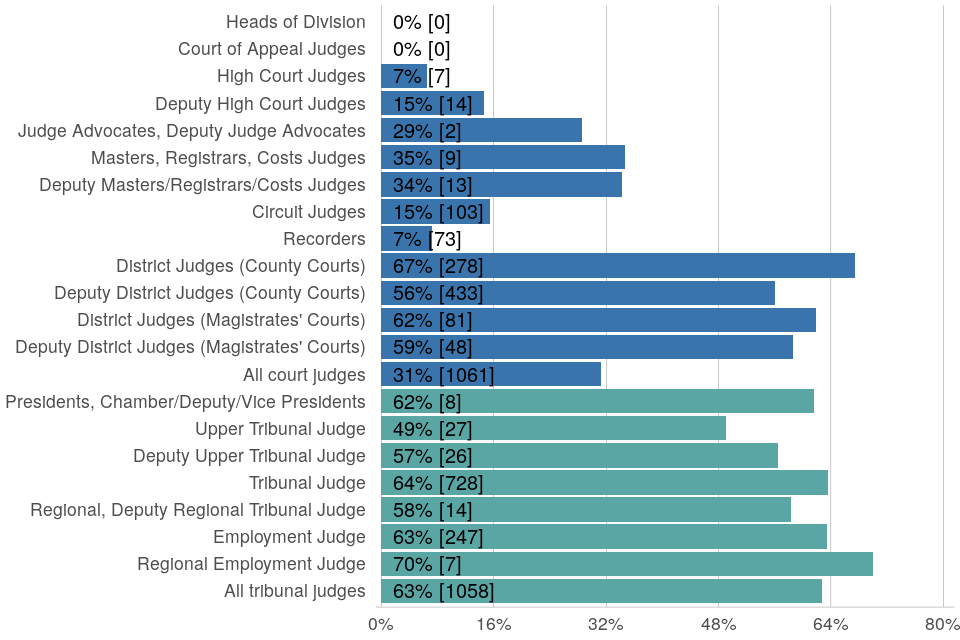
9. Intersection of Gender and Professional Background
9.1 Judicial Appointments: Applications and Selections
Three-year Analysis: 2019 to 2022
Male and female solicitors showed similar progression rates for legal exercises between April 2019 and March 2022.
From application[footnote 46], progression rates for both male and female “ever” solicitors were significantly less than for male and female “ever” barristers.
To produce the following statistics on gender-profession groups in the judicial appointments process in a sufficiently robust way, data from the most recent three years of completed exercises (April 2019 to March 2022) was aggregated. Counts and percentages therefore cover applications and recommendations across the whole three-year period.
These statistics cover gender-profession intersection groups and thus only male and female “ever” solicitors and barristers are considered. There were insufficient numbers to include statistics on male and female Chartered Legal Executives.
Overall View
Across all legal exercises closed between April 2019 and March 2022, male and female solicitors had a recommendation rate from eligible pool of 8%. Male and female barristers had rates of 16% and 17% respectively.
Male “ever” solicitors:
- Constituted 26% of applications and 18% of recommendations
- Had a rate of recommendation from application that was an estimated 50% lower than that for male “ever” barristers (indicated by the statistically significant estimated RRI of 0.50, Figure 36)
Female “ever” solicitors:
- Constituted 29% of applications and 19% of recommendations
- Had a rate of recommendation from application that was an estimated 53% lower than that for male “ever” barristers (indicated by the statistically significant estimated RRI of 0.47, Figure 36)
- Had a rate of recommendation from application that was an estimated 54% lower than that for female “ever” barristers (indicated by the statistically significant estimated RRI of 0.46, Figure 36)
- Had a rate of recommendation from application that was an estimated 7% lower than that for male “ever” solicitors (indicated by the estimated RRI of 0.93, Figure 36) though this was not statistically significant, meaning that there is no evidence of any difference in the progression rates between these two groups
Female “ever” barristers:
- Constituted 19% of applications and 27% of recommendations
- Had a very similar rate of recommendation from application compared to male “ever” barristers (indicated by the estimated RRI of 1.01, Figure 36),
Figure 35: progression rates of gender-profession intersection groups through the exercise stages, all legal exercises between April 2019 and March 2022
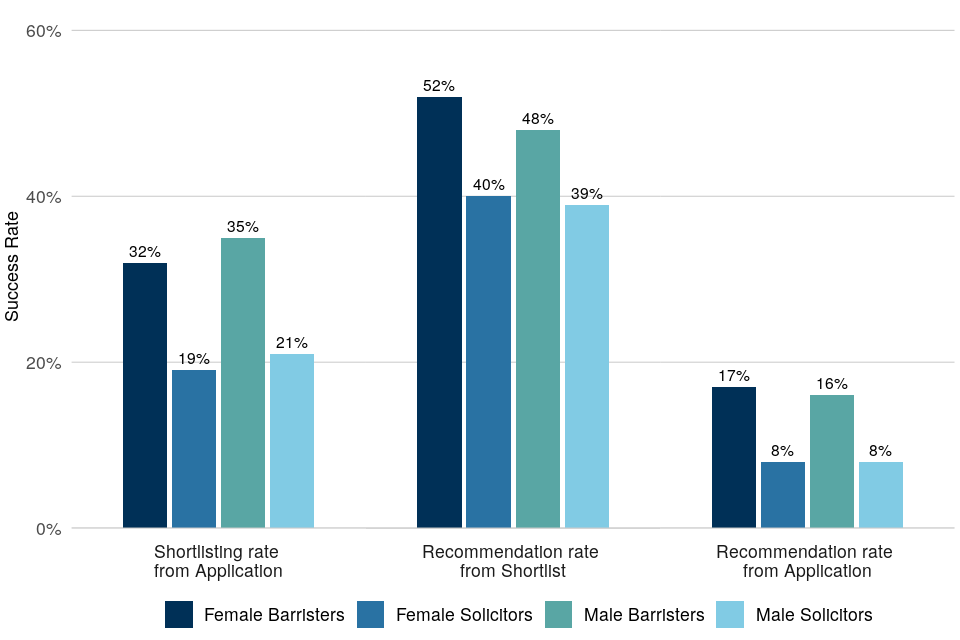
Exercise-specific Analysis
In Recorder exercises, male and female “ever” solicitors both had lower recommendation rates from application than male “ever” barristers (indicated by the statistically significant estimated RRI values of 0.54 and 0.34 depicted in light blue, Figure 36).
However, for District Judge exercises there is no such disparity in the recommendation rates from application (indicated by the estimated RRI values of 0.94 and 0.86 respectively, displayed in dark blue, Figure 36). The RRI values for eligible pool to recommendation were 2.48 and 2.20 respectively, and both statistically significant. This means that male and female “ever” solicitors had more than double the recommendation rate of male “ever” barristers when looking at the eligible pool rather than applicants, mainly driven by high application rates from the eligible pool for both groups.
Figure 36: comparison of RRI for gender-profession intersection groups, from application to recommendation, legal exercises between April 2019 and March 2022
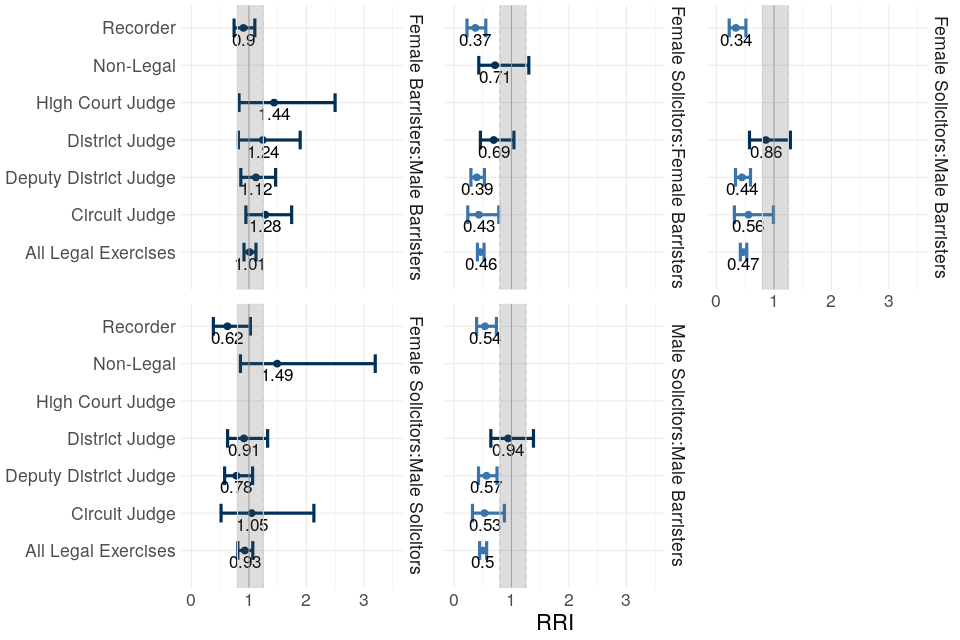
Figure 37: representation of gender-profession intersection groups at different exercise stages, in legal exercises between April 2019 and March 2022 (eligible pool percentages from 2022 only)
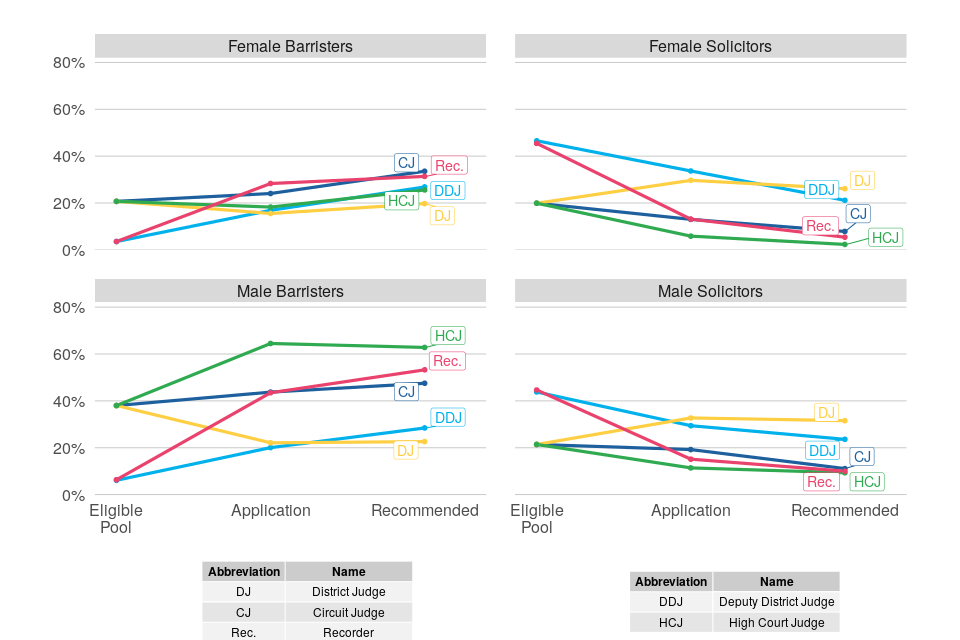
9.2 Judicial Office Holders
Male barristers are the largest gender-profession group in the judiciary and are more represented in senior posts.
Representation of these groups differed between courts and tribunals, with a higher proportion of male and female solicitors among tribunal judges. Within the senior courts judiciary, male former barristers occupied the majority of posts.
Judges in post
At 1 April 2022:
- Men with barrister professional backgrounds constituted 46% of court judges, 21% of tribunal judges and 38% of judges overall[footnote 47] (Figure 38)
- Women with barrister professional backgrounds constituted 22% of court judges, 17% of tribunal judges and 21% of judges overall
- Men with solicitor professional backgrounds constituted 19% of court judges, 27% of tribunal judges and 21% of judges overall
- Women with solicitor professional backgrounds constituted 13% of court judges, 35% of tribunal judges and 20% of judges overall
Figure 38: representation of different gender-profession groups in judges in post, April 2022
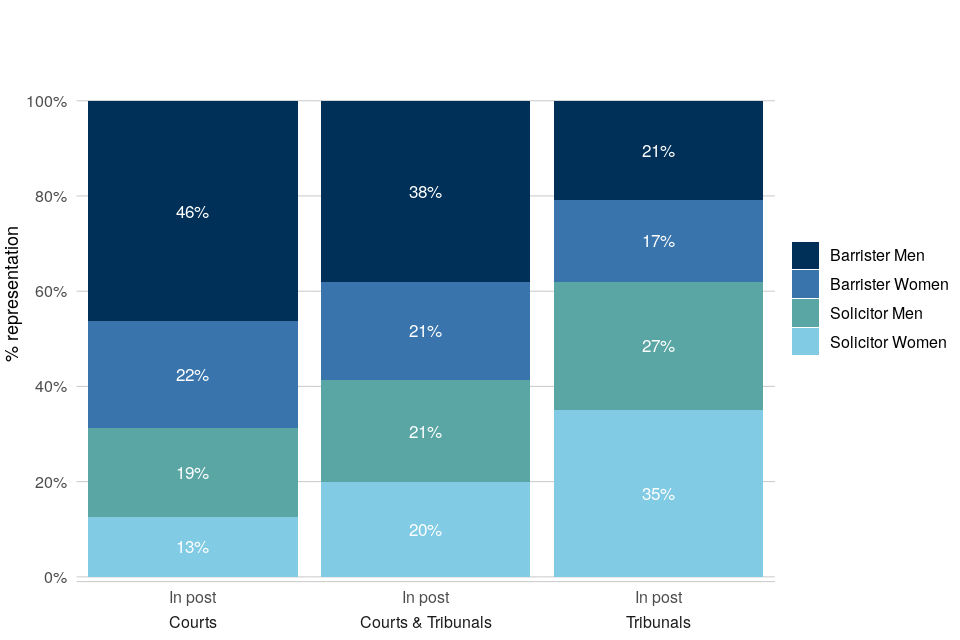
Patterns by type of appointment
Almost all the senior court judicial posts (High Court and above) are held by former barristers, the majority of whom are men (Figure 39). Deputy District and District Judge posts have more solicitors than other court judge roles. Tribunals tend to have a greater proportion of solicitors, both male and female, in judicial posts than the courts.
Figure 39: representation of gender-profession groups by primary appointment, April 2022
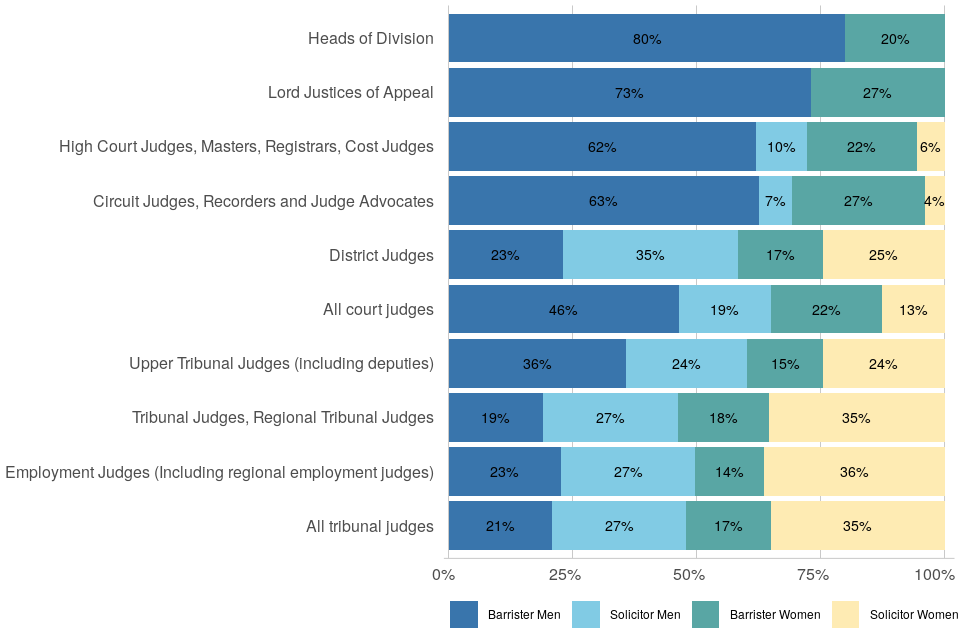
10. Intersection of Ethnicity and Professional Background
10.1 Judicial Appointments: Applications and Selections
Three-year Analysis: 2019 to 2022
From application[^52], ethnic minority barristers have lower recommendation rates than white barristers. Ethnic minority solicitors have lower recommendation rates than all three other ethnicity-profession groups.
To produce the following statistics on ethnicity-profession groups in the judicial appointments process in a sufficiently robust way, data from the most recent three years of completed exercises (April 2019 to March 2022) was aggregated. Counts and percentages therefore cover applications and recommendations across the whole three-year period.
These statistics cover ethnicity-profession intersection groups, and thus only ethnic minority and white “ever” solicitors and barristers are considered (four groups). There were insufficient numbers to include statistics on the ethnic minority and white Chartered Legal Executives subgroups.
Overall View
Across all legal exercises that closed between 1 April 2019 and 31 March 2022, ethnic minority candidates who had ever been a barrister:
- Constituted 9% of applications and 7% of recommendations
- Had a rate of recommendation from application that was an estimated 47% lower than that for white “ever” barristers (indicated by the statistically significant estimated RRI of 0.53, Figure 41)
Across all legal exercises that closed between 1 April 2019 and 31 March 2022, ethnic minority candidates who had ever been a solicitor:
- Constituted 15% of applications and 5% of recommendations
- Had a rate of recommendation from application that was an estimated 79% lower than that for white “ever” barristers (indicated by the statistically significant estimated RRI of 0.21, Figure 41)
- Had a rate of recommendation from application that was an estimated 61% lower than that for ethnic minority “ever” barristers (indicated by the statistically significant estimated RRI of 0.39, Figure 41)
- Had a rate of recommendation from application that was an estimated 60% lower than that of white “ever” solicitors (indicated by the statistically significant estimated RRI of 0.40, Figure 41)
Across all legal exercises that closed between 1 April 2019 and 31 March 2022, white candidates who had ever been a solicitor:
- Constituted 40% of applications and 32% of recommendations
- Had a rate of recommendation from application that was an estimated 49% lower than that for white “ever” barristers (indicated by the statistically significant estimated RRI of 0.51, Figure 41)
Figure 40: progression rates of ethnicity-profession intersection groups through the exercise stages, all legal exercises between April 2019 and March 2022
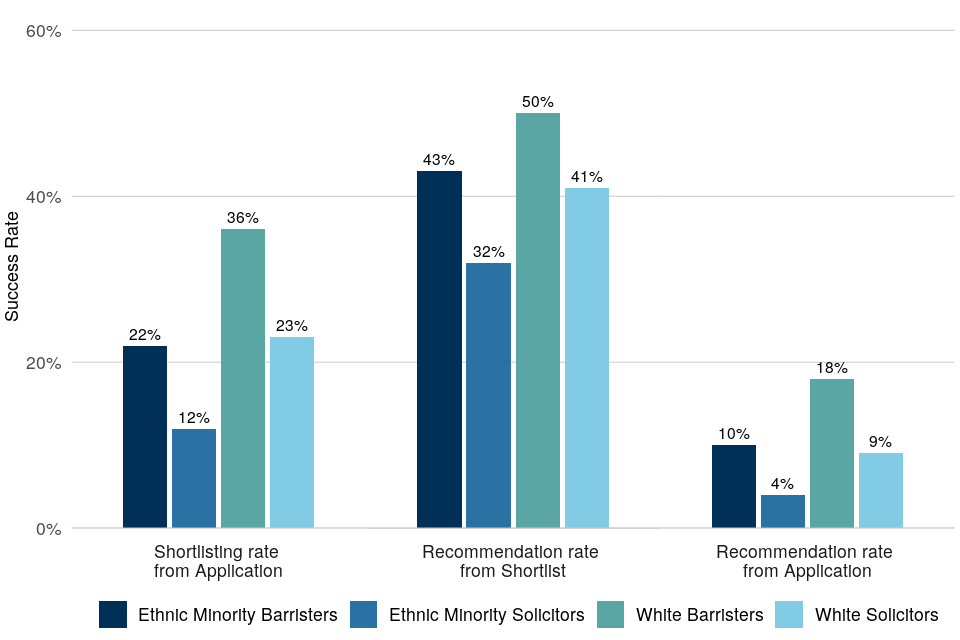
Exercise-specific Analysis
In Recorder, Deputy District Judge and District Judge exercises, ethnic minority “ever” solicitors had lower recommendation rates from application than ethnic minority “ever” barristers, although only for Deputy District Judge was the difference statistically significant, with an RRI value of 0.43 depicted in light blue (Figure 41).
Similarly, white “ever” solicitors had lower recommendation rates from application compared to white “ever” barristers in all exercise types, with statistically significant differences seen in Recorder, Deputy District Judge and Circuit Judge exercises.
Figure 41: RRI for ethnicity-profession intersection groups comparisons, from application to recommendation, legal exercises between April 2019 and March 2022
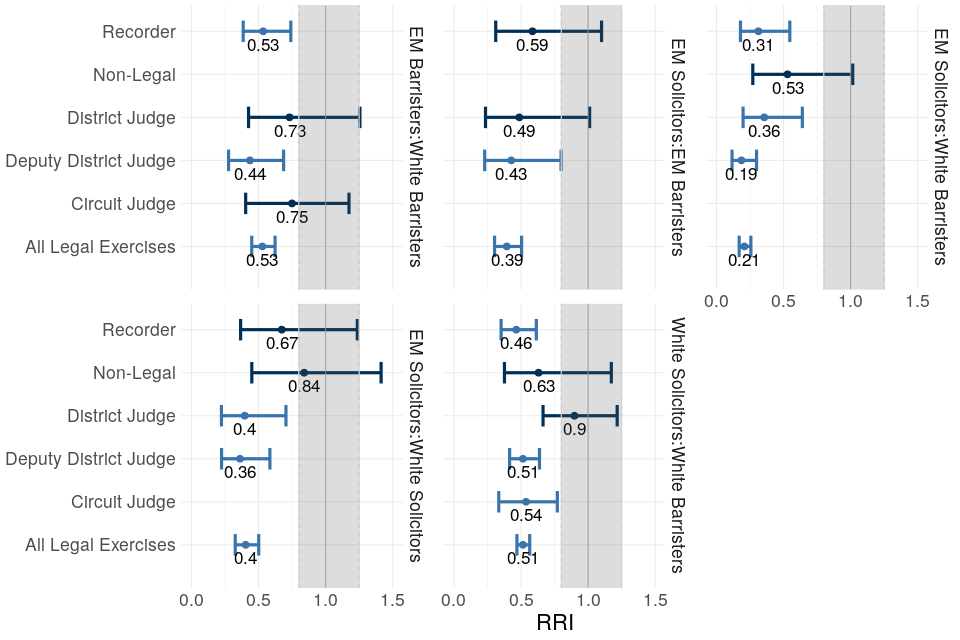
Figure 42: representation of ethnicity-profession intersection groups at different exercise stages, in legal exercises between April 2019 and March 2022 (eligible pool percentages from 2022 only)
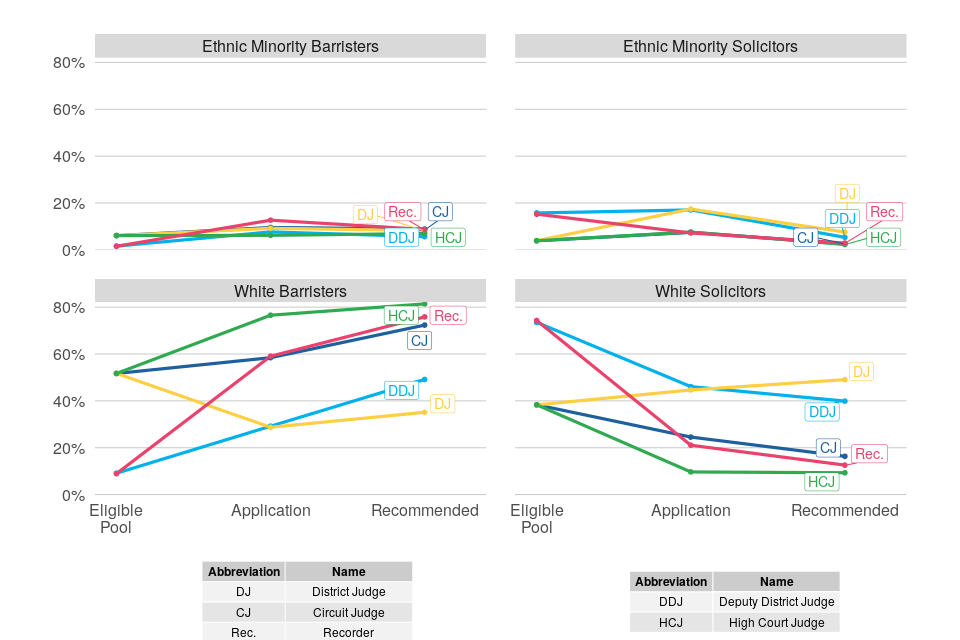
10.2 Judicial Office Holders
White barristers are the largest ethnicity-profession group in the judiciary and are more represented in senior posts.
Representation of these groups differed between courts and tribunals, with a higher proportion of ethnic minority solicitors among tribunal judges. Within the senior courts judiciary, white former barristers occupied almost all posts.
Judges in post
At 1 April 2022:
- Ethnic minority individuals with barrister professional backgrounds constituted 6% of court judges, 6% of tribunal judges and 6% of judges overall[^60]
- Ethnic minority individuals with solicitor professional backgrounds constituted 3% of court judges, 6% of tribunal judges and 4% of judges overall
- White individuals with barrister professional backgrounds constituted 62% of court judges, 32% of tribunal judges and 52% of judges overall
- White individuals with solicitor professional backgrounds constituted 29% of court judges, 56% of tribunal judges and 38% of judges overall
Figure 43: representation of different ethnicity-profession groups in judges in post, April 2022
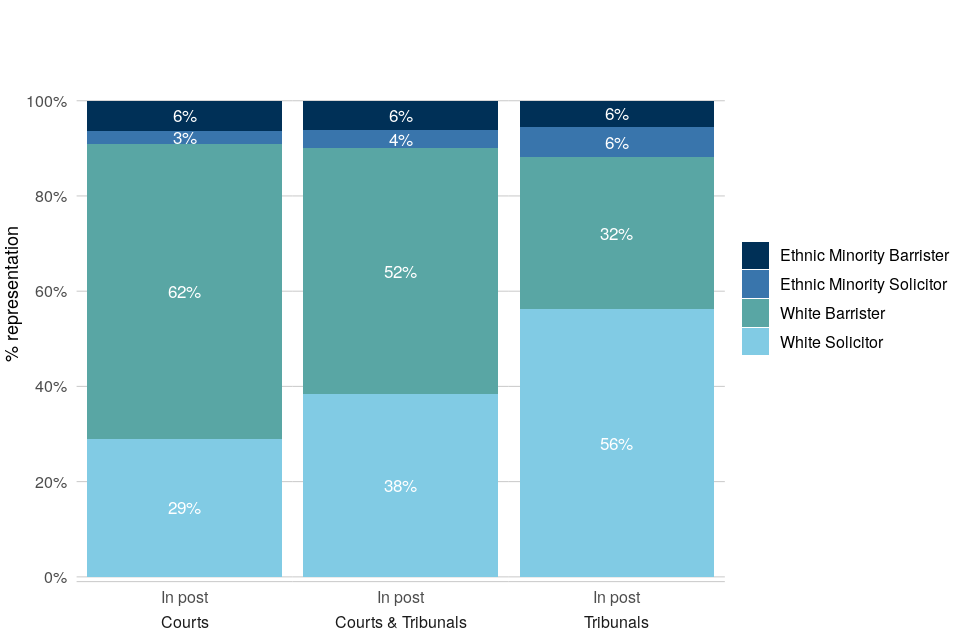
Patterns by type of appointment
Almost all of the senior court judicial posts (High Court and above) are held by white former barristers. Below the senior courts, Circuit Judges, Recorders and Judge Advocates have the highest proportion of white former (or still practicing) barristers in post.
Figure 44: representation of ethnicity-profession groups by primary appointment, April 2022
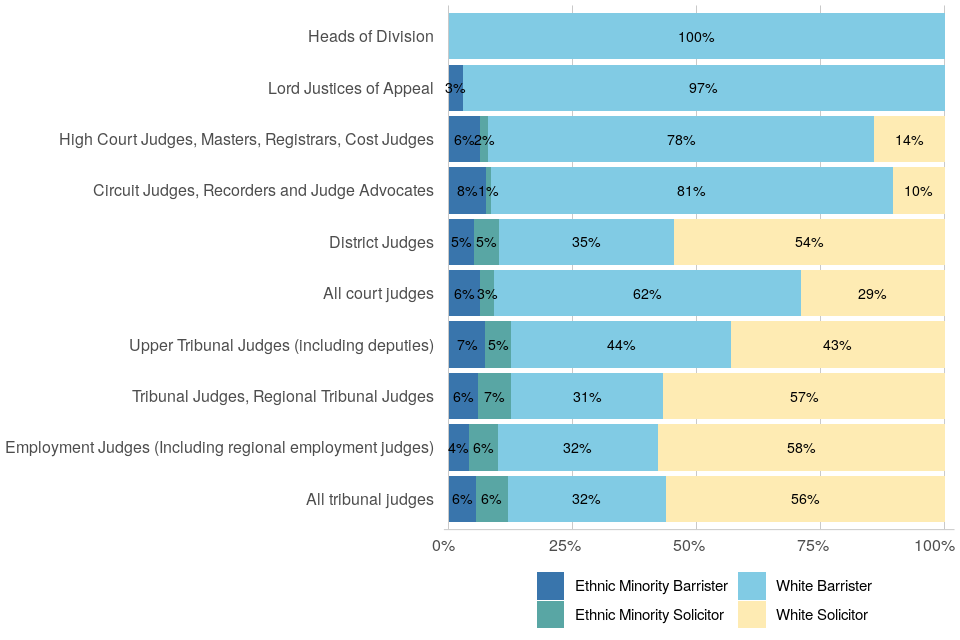
11. Intersection of Gender, Ethnicity and Professional Background
11.1 Judicial Appointments: Applications and Selections
Three-year Analysis: 2019 to 2022
White female barristers, closely followed by white male barristers had the highest recommendation rates from application[^52] compared to all other gender-ethnicity-profession groups.
From application, recommendation rates for all gender-ethnicity-profession groups were lower than the rate for white male “ever” barristers, apart from white female “ever” barristers. All the “ever” solicitor groups had lower recommendation rates than their “ever” barrister counterparts.
Similarly, all the ethnic minority groups had lower recommendation rates than their white counterparts. Only groups that contrast solely on gender (for example, white female “ever” solicitors and white male “ever” solicitors) were found to not have significantly different recommendation rates from each other. Ethnic minority male and female barristers and solicitors all had similar representation among recommendations.
To produce the following statistics on gender-ethnicity-profession groups in the judicial appointments process in a sufficiently robust way, data from the most recent three years of completed exercises (April 2019 to March 2022) was aggregated. Counts and percentages therefore cover applications and recommendations across the whole three-year period.
These statistics cover groups at the intersection of gender, ethnicity and “ever” profession and thus only ethnic minority and white men and women who were “ever” solicitors and barristers are considered (eight groups). Group counts were too small to include statistics on ethnic minority and white men and women who were ever Chartered Legal Executives.
Overall View
Comparisons with groups other than male barrister across all legal exercises between 1 April 2019 and 31 March 2022 can be found in Table 2.7.
White male “ever” solicitors:
- Constituted 19% of applications and 16% of recommendations
- Had a rate of recommendation from application that was an estimated 46% lower than that for white male “ever” barristers (indicated by the statistically significant estimated RRI of 0.54, Figure 46)
White female “ever” solicitors:
- Constituted 21% of applications and 16% of recommendations
- Had a very similar rate of recommendation from application compared to that for white male “ever” solicitors (indicated by the statistically significant estimated RRI of 0.96)
- Had a rate of recommendation from application that was an estimated 51% lower than white female “ever” barristers (indicated by the statistically significant estimated RRI of 0.49)
White female “ever” barristers:
- Constituted 15% of applications and 24% of recommendations
- Had a very similar rate of recommendation from application compared to than that for white male “ever” barristers (a statistically non-significant RRI of 1.07)
Ethnic minority male “ever” barristers:
- Constituted 5% of applications and 4% of recommendations
- Had a rate of recommendation from application that was an estimated 41% lower than that of white male “ever” barristers (indicated by the statistically significant estimated RRI of 0.59, Figure 46)
Ethnic minority female “ever” barristers:
- Constituted 4% of applications and 3% of recommendations
- Had a rate of recommendation from application that was an estimated 16% lower than that of ethnic minority male “ever” barristers (estimated RRI of 0.84), though this estimate was not statistically significant
- Had a rate of recommendation from application that was an estimated 54% lower than that of white female “ever” barristers (indicated by the statistically significant estimated RRI of 0.46)
Ethnic minority male “ever” solicitors:
- Constituted 6% of applications and 2% of recommendations
- Had a rate of recommendation from application that was an estimated 59% lower than that of ethnic minority male “ever” barristers (indicated by the statistically significant estimated RRI of 0.41)
- Had a rate of recommendation from application that was an estimated 55% lower than that of white male “ever” solicitors (indicated by the statistically significant estimated RRI of 0.45)
Ethnic minority female “ever” solicitors:
- Constituted 8% of applications and 2% of recommendations
- Had a rate of recommendation from application that was an estimated 21% lower than that of ethnic minority male “ever” solicitors (estimated RRI of 0.79), though this result was not statistically significant
- Had a rate of recommendation from application that was an estimated 63% lower than that of white female “ever” solicitors (indicated by the statistically significant estimated RRI of 0.37)
- Had a rate of recommendation from application that was an estimated 61% lower than that of ethnic minority female “ever” barristers (indicated by the statistically significant estimated RRI of 0.39)
Figure 45: progression rates of gender-ethnicity-profession intersection groups through the exercise stages, all legal exercises between April 2019 and March 2022
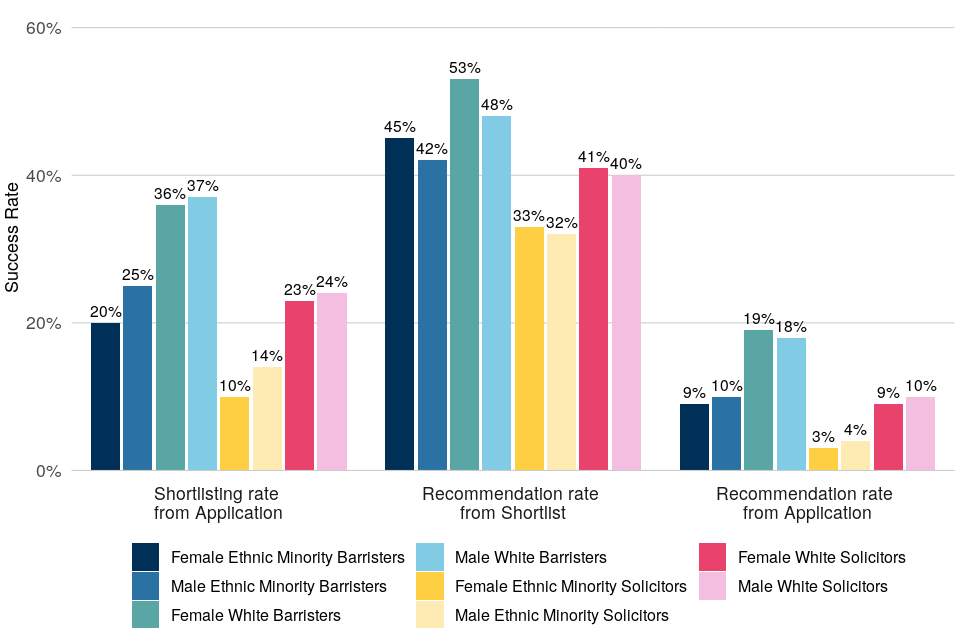
Exercise-specific Analysis
In Deputy District Judge exercises between 2019 and 2022, all gender-ethnicity-profession groups apart from white female “ever” barristers had significantly lower progression from application to recommendation than white male “ever” barristers where RRI values could be calculated (Figure 46).
Ethnic minority female and male “ever” barristers, as well as white male “ever” solicitors also had significantly lower progression than white male “ever” barristers in Recorder exercises in that time period (Figure 46).
Figure 46: RRIs for gender-ethnicity-profession intersection groups in comparison to white Men Barristers, from application to recommendation Legal exercises between April 2019 and March 2022. Table cells highlighted in orange indicate a statistically significant result.
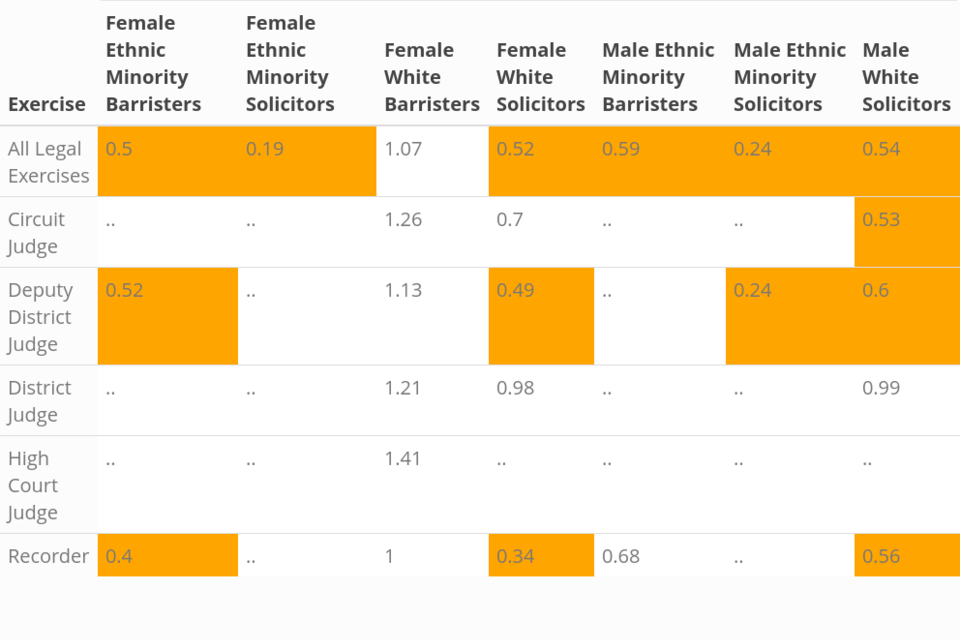
Figure 47: representation of gender-ethnicity-profession intersection groups at different stages, in legal exercises between April 2019 and March 2022 (eligible pool percentages from 2022 only)
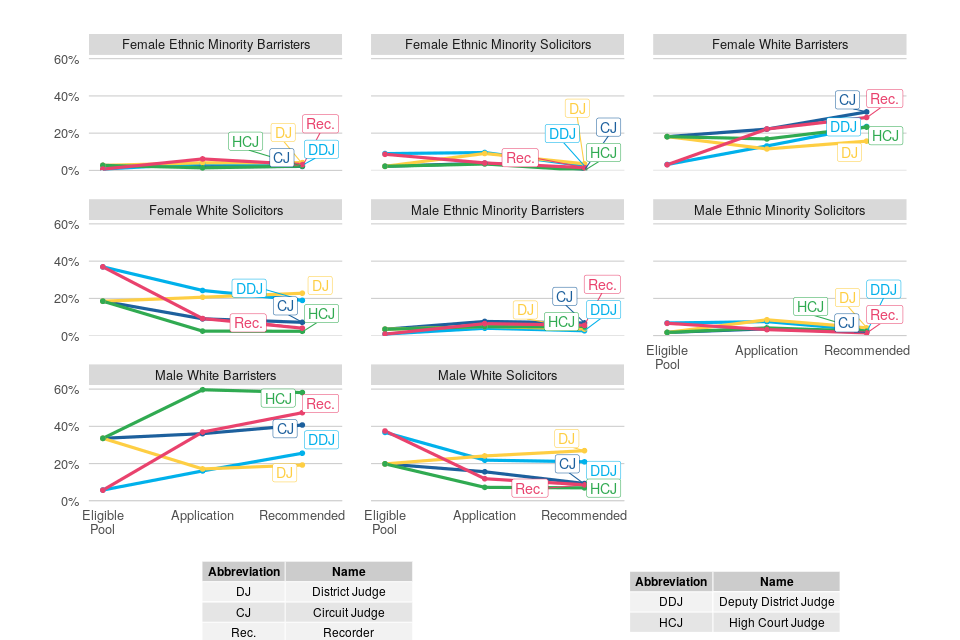
11.2 Judicial Office Holders
White male barristers are the largest gender-ethnicity-profession group in the judiciary and occupy most senior court posts.
Representation of gender-ethnicity-profession intersection groups differed between courts and tribunals, with higher proportions of ethnic minority individuals, former solicitors and women among tribunal judges. Within the senior courts judiciary, white male former barristers occupied the majority of posts.
Judges in post
At 1 April 2022:
- White men with barrister professional backgrounds constituted 42% of court judges, 18% of tribunal judges and 34% judges overall (Figure 48)[^60]
- White men with solicitor professional backgrounds constituted 17% of court judges, 24% of tribunal judges and 20% of judges overall
- Ethnic minority men with barrister professional backgrounds constituted 4% of court judges, 2% of tribunal judges and 3% of judges overall
- Ethnic minority men with solicitor professional backgrounds constituted 1% of court judges, 2% of tribunal judges and 2% of judges overall
- White women with barrister professional backgrounds constituted 20% of court judges, 14% of tribunal judges and 18% of judges overall
- White women with solicitor professional backgrounds constituted 12% of court judges, 32% of tribunal judges and 18% of judges overall
- Ethnic minority women with barrister professional backgrounds constituted 2% of court judges, 3% of tribunal judges and 3% of judges overall
- Ethnic minority women with solicitor professional backgrounds constituted 1% of court judges, 4% of tribunal judges and 2% of judges overall
Figure 48: representation of different gender-ethnicity-profession groups in judges in post, April 2022
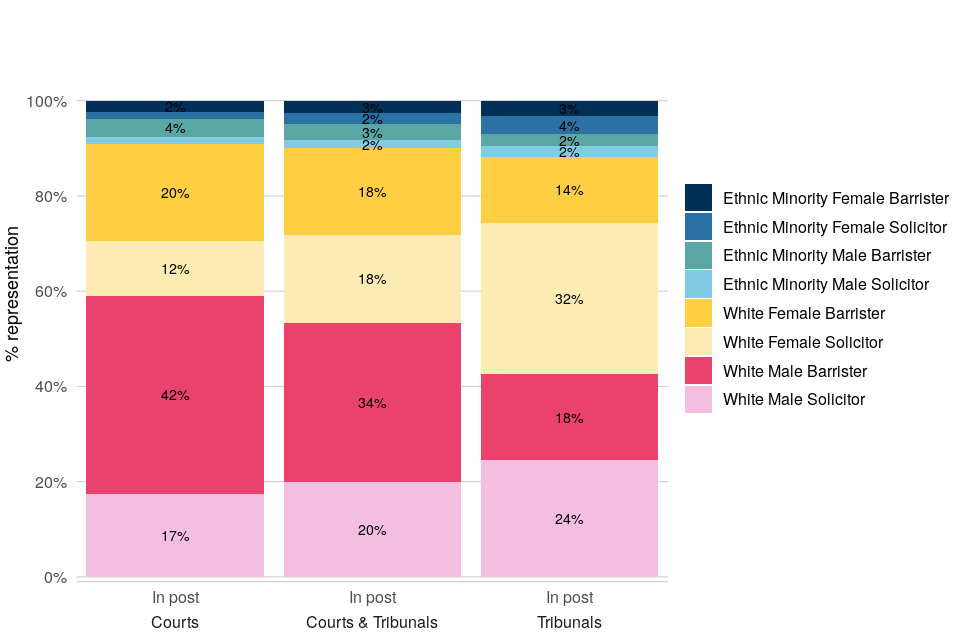
Patterns by type of appointment
A substantial majority of the senior court judicial posts (High Court and above) are held by white male former barristers. White women with solicitor professional backgrounds tend to make up around a quarter of tribunal judicial posts.
Figure 49: representation of gender-ethnicity-profession groups by primary appointment, April 2022
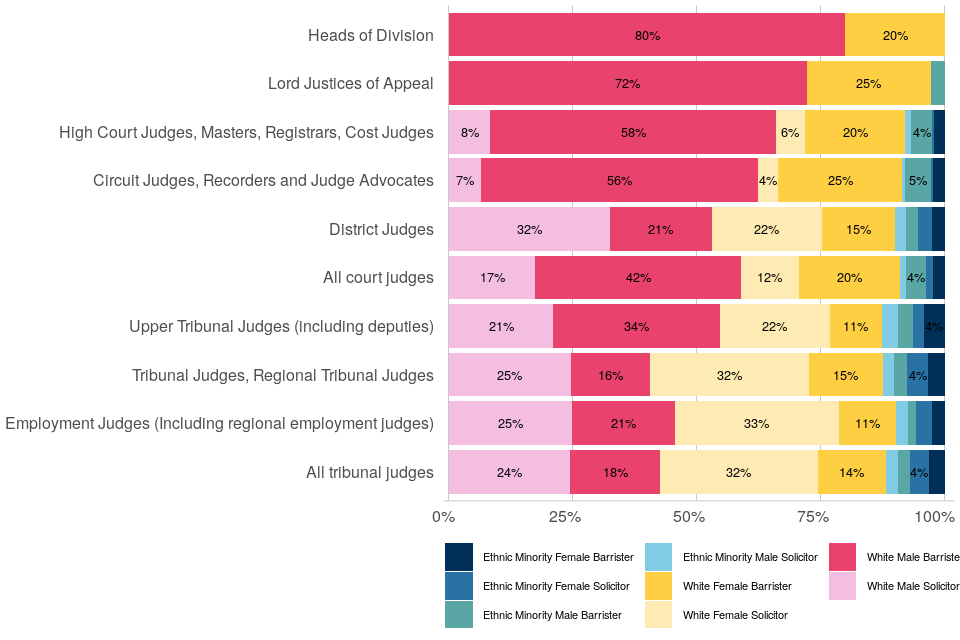
12. Age
12.1 Legal Professions
38% of barristers, 30% of solicitors and 46% of Chartered Legal Executives are aged 50 or over.
Post Qualification Experience
Predictably, post qualification experience in legal professionals is strongly associated with age (Figure 50).
- Of those with 15 or more years’ experience, 63% of barristers, 56% of solicitors and 76% of Chartered Legal Executives are aged 50 and over
Figure 50: age group for different levels of post-qualification experience in the legal professions, April 2022. A similar pattern across all legal professions, with over half of those with 15 or more years’ PQE being aged 50 and over.
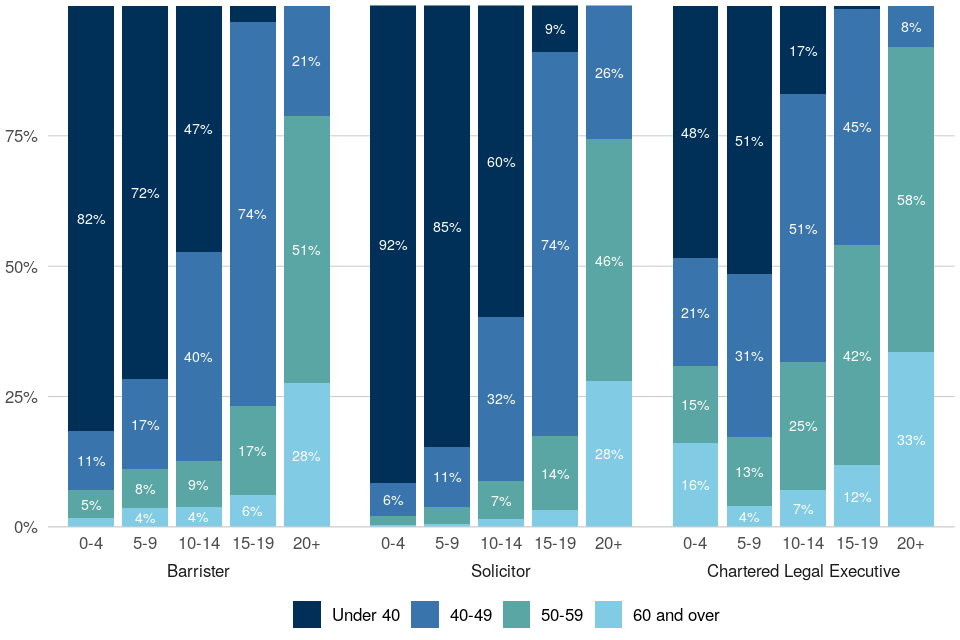
Seniority
A higher proportion of those in more senior roles are aged 50 or over, compared to those in less senior positions:
- for barristers, 77% of QCs, compared with 34% of junior barristers
- for solicitors, 51% of partners compared with 24% of solicitors
- for Chartered Legal Executives, 51% of partners compared with 45% of fellows
12.2 Judicial Appointments: Applications and Selections
Older applicants have lower recommendation rates than younger applicants, with 77% of new appointees aged under 50.
Age and experience are related, and the proportion of individuals aged 50 and over was higher among applications and recommendations made for more senior positions.
Age is strongly correlated with experience and, as a result, it is less insightful to make comparisons between recommendation rates based on age than for other characteristics. Although figures are broken down by age group, we do not conduct relative comparisons of rates of recommendation.
Overall View
Overall, 35% of applicants to legal exercises were aged 50 and over. Representation of those aged over 50 decreased between application and recommendation stages with 30% of those shortlisted and 23% of recommendations for individuals aged 50 and above.
Exercise-specific Analysis
More senior roles typically require greater experience and therefore older age groups are more highly represented at both application and recommendation stages (Figure 51).
The proportion of individuals aged 50 and over tends to decrease between the application and recommendation stages, though this was not the case for every exercise. Exercises where representation of those aged over 50s decreased from application to recommendation are those shown below and to the right of the diagonal line in Figure 51.
Figure 51: proportion of applications and recommendations aged 50 and over for each large legal exercise. Proportion of applications and recommendations who are aged 50 and over broadly increases with seniority of post.
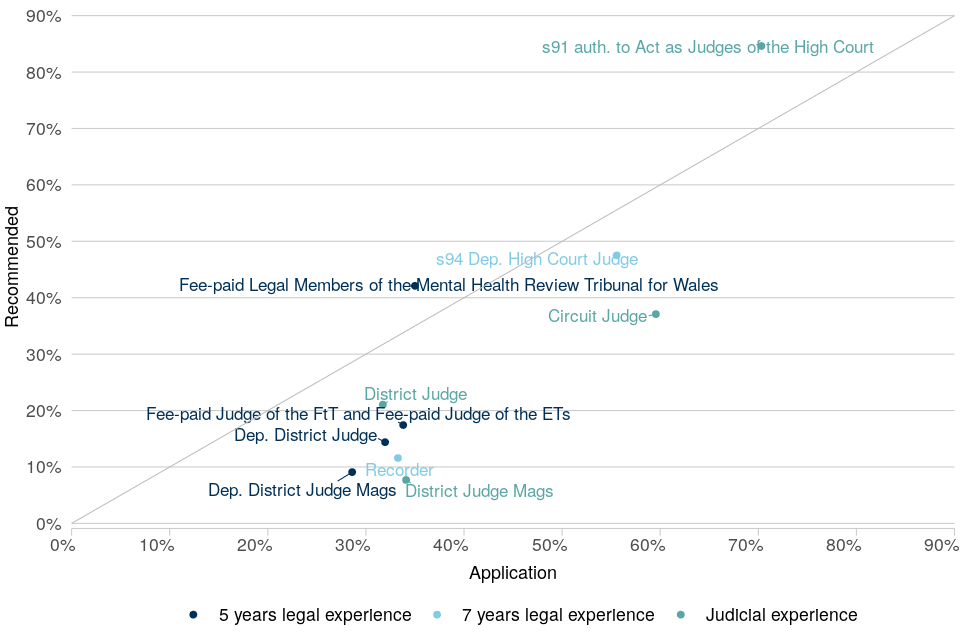
12.3 Judicial Office Holders
Most court and tribunal judges are aged 50 and over, with slightly more than one third of court and tribunal judges aged 60 and over.
Within the courts, there was a lower representation of younger ages in more senior posts.
Judges in post
At 1 April 2022, over two-thirds of judges were aged 50 and over - 70% in courts and 69% in tribunals. In courts 35% of judges were aged 60 and over, while that figure was 36% in tribunals.
Entrants and Leavers
For judges in both courts and tribunals, around three quarters of new entrants to the judiciary in 2021-22 were aged under 50. Almost all those leaving the judiciary were aged 50 and over[footnote 48].
Patterns by type of appointment
Overall, the proportion of those aged 50 and over, and 60 and over, was higher among more senior posts (particularly Court of Appeal and above) (Figure 52). There was a broadly similar pattern in the tribunals, where tribunal presidents were all aged 50 or over.
Figure 52: representation of ages 50 and over among court and tribunal judges by appointment, 1 April 2022. The representation varied with appointment type and was higher for the more senior posts in the courts.
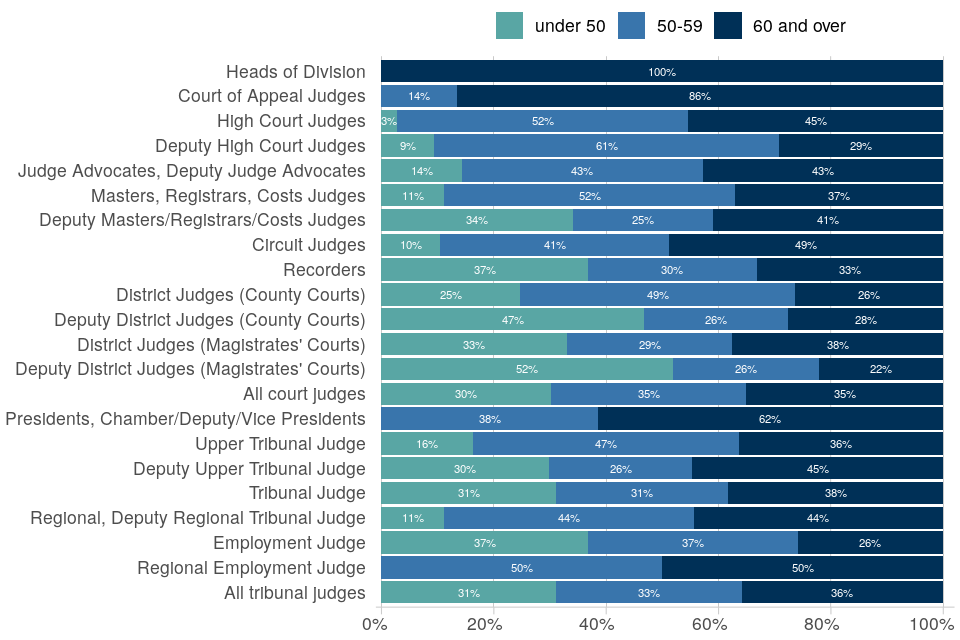
13. Other Characteristics
13.1 Judicial Appointments: Applications and Selections
Disability: For legal exercises overall, candidates with a disability had a slightly lower recommendation rate from application than candidates without a disability.
Social mobility: Across all legal exercises, candidates who attended a UK state school had a lower recommendation rate from application compared to those who attended a UK independent or fee-paying school.
Sexual orientation: Across all legal and non-legal exercises combined, candidates who were lesbian, gay or bisexual had a slightly higher recommendation rate from application than candidates who were heterosexual.
Religion: Across all legal and non-legal exercises combined, candidates who declared their religion as Christian were the largest group among applications and recommendations. Recommendation rates from application were the lowest for Muslim candidates and highest for Jewish candidates.
This section presents available statistics for other diversity characteristics – disability, social mobility, religion, and sexual orientation. Currently these are only collected in a sufficiently robust way for judicial selection, and not for judges in post or the legal professions. This means we cannot provide analysis of recommendation rates compared to the eligible pools, as done for other characteristics. A summary is presented here, with further details in the accompanying data tables.
Disability
Across all legal exercises in 2021-22 candidates with a disability:
- represented 7% of applications and 6% of all recommendations made
- had a slightly lower recommendation rate from application (9%) than candidates without a disability (11%)
Social Mobility
Across all legal exercises in 2021-22, individuals who attended a UK state school:
- represented 74% of applications and 67% of recommendations made
- had a lower recommendation rate from application (10%) compared to those who attended a UK independent or fee-paying school (16%)
Across all legal exercises in 2021-22, almost all (98%) of applicants attended university.
- 61% of applications and 52% of recommendations were the first generation in their family to do so (i.e. neither of their parents attended university)
- Candidates who attended but whose parents did not attend university had a lower recommendation rate from application (9%) than candidates who attended and one or both of their parents also attended university (14%)
Sexual Orientation
Across all exercises (legal and non-legal) in 2021-22 combined[^54]:
- 7% of applicants and 7% of recommendations were lesbian, gay, or bisexual
- candidates who declared themselves to be lesbian, gay, or bisexual (13%) had a slightly higher recommendation rate from application than those who declared themselves to be heterosexual (12%)
Religion
Across all exercises (legal and non-legal) in 2021-22 combined[footnote 49]:
- the religion or belief with the largest representation among both applications and recommendations was Christian (both at 46%), followed by individuals who declared no religion or atheist (37% and 43% respectively)
- recommendation rates from application ranged from 5% for Muslim candidates to 15% for Jewish candidates, with Christian candidates at 12%
13.2 Legal Professions and Judicial Office Holders
As at 31 January 2022, the disability declaration rates for Judicial Office and the Bar Standards Board (BSB) are not at the 60% level required for statistical confidence in presenting data on judges or barristers with a disability. The Solicitors Regulation Authority (SRA) has reported a 97.6% declaration rate for partners and a 76.5% declaration rate for solicitors but when migrating historical data to new systems in the past, those who had not responded to the disability question were included in the ‘no disability’ group alongside those who had actively declared they had no disability. This means that the true declaration rate is not known but is likely to be lower than it appears. The SRA is doing further work to validate these data. CILEX have reported an 88% declaration rate. Given the current declaration rate overall, it is not possible to publish disability data for judges and lawyers in this report. However, the judiciary and Bar Council are actively working towards improving their data collection so that it can be included in 2023.
14. Non-legal tribunal members
Compared with judges, a higher proportion of non-legal members are women, or from an ethnic minority background.
In judicial appointments a higher proportion of recommendations were for women and ethnic minority individuals in non-legal exercises than in legal exercises.
Women and Asian candidates had higher recommendation rates from application than men and white candidates respectively.
The following sections cover roles which do not require a legal background – non-legal members in tribunals, and magistrates. This compares with preceding sections which focus on legal professions, selections for judicial posts requiring legal experience and judges in post. While non-legal posts typically have eligibility criteria (for example, membership of an appropriate professional body) no attempt is currently made to estimate the eligible pool.
14.1 Appointments for Non-Legal Tribunal Members
Gender
Across all non-legal exercises in 2021/2022:
- women represented 56% of recommendations
- comparing application to recommendation stages for non-legal exercises, success rates for women were on par with that for men (indicated by the RRI estimate of 1.07 not being statistically significant)
Ethnicity
Single-year Analysis: 2021/2022
Across all non-legal exercises in 2021/22:
- Ethnic minority individuals constituted 19% of applications and 21% of recommendations
- Ethnic minority candidates had a recommendation rate from application on par with that of white candidates (indicated by the RRI estimate of 1.12 being not statistically significant)
Only exercise JAC00010 had a sufficiently large applicant pool to conduct analyses. In this exercise, ethnic minority candidates had a lower recommendation rate from application compared to white candidates (RRI of 0.74), which was not statistically significant.
Three-year Analysis: 2019 to 2022
Across all non-legal exercises between 1 April 2019 and 31 March 2022:
- Asian or Asian British individuals constituted 13% of applications and 15% of recommendations
-
Asian or Asian British candidates had a recommendation rate from application that was an estimated 23% higher than that of white candidates, a statistically significant result
- Black or black British individuals constituted 4% of applications and 5% of recommendations
-
Black or black British candidates had a recommendation rate from application that was an estimated 16% higher than that of white candidates, but not a statistically significant result
- Mixed ethnicity individuals constituted 3% of applications and 3% of recommendations
-
Mixed ethnicity candidates had a recommendation rate from application on par with that of white candidates
- Other ethnicity individuals constituted 1% of applications and 1% of recommendations
- Other ethnicity candidates had a recommendation rate from application on par with that of white candidates
Intersection of Gender and Ethnicity
Across all non-legal exercises between 1 April 2019 and 31 March 2022:
- Ethnic minority men constituted 9% of applications and 11% of recommendations
- Ethnic minority men had a recommendation rate from application that was 46% higher than that of white men
- Ethnic minority women constituted 12% of applications and 14% of recommendations
- Ethnic minority women had a recommendation rate from application that was 41% higher than that of white men
- Ethnic minority women had a recommendation rate from application that was equivalent to that of white women
- Ethnic minority women had a recommendation rate from application that was equivalent to that of ethnic minority men
- White men constituted 33% of applications and 26% of recommendations
- White women constituted 46% of applications and 49% of recommendations
- White women had a recommendation rate from application that was 35% higher than that of white men
Age
Across all non-legal exercises overall in 2021/2022:
- 58% of those recommended for appointment were aged 50 or over
Recommendation rates from application varied by exercise, with some exercises having a higher rate among older candidates and others having a higher recommendation rate among younger candidates.
Disability
Across all non-legal exercises overall in 2021/2022:
- 12% of applications and 11% of those recommended declared themselves to have a disability
- the recommendation rate from application for candidates with a disability was slightly lower (29%) than for candidates without a disability (32%)
Social Mobility
Across all non-legal exercises overall in 2021/2022:
- Candidates who attended a UK state school accounted for most applications (78%) and recommendations (74%), but had a lower recommendation rate from application (30%) compared to those who attended a UK independent or fee-paying school (41%)
- Candidates who attended but whose parents did not attend university accounted for most applications (60%) and recommendations (59%).
- 10% of candidates did not attend university
- Candidates who attended but whose parents did not attend university had a slightly lower recommendation rate from application (31%) compared to candidates who attended university and one or both parents also did (37%)
14.2 Non-Legal Tribunal Members in post
Gender
As at 1 April 2022, women represented 56% of all non-legal members of tribunals (11 percentage points higher than in 2014).
The representation of women varied by the type of non-legal post, with 51% of medical members and 77% of disability members being women.
The proportion of women entering non-legal member roles in 2021-22 (65%) was higher than for those in post as at 1 April 2022 (56%).
Ethnicity
As at 1 April 2022:
- Asian or Asian British individuals constituted 12% of all non-legal tribunal members
- Black or black British individuals constituted 3% of all non-legal tribunal members
- Mixed ethnicity individuals constituted 2% of all non-legal tribunal members
- Individuals from other ethnicities constituted 2% of all non-legal tribunal members
In total, ethnic minority individuals constituted 18% of all non-legal members of tribunals (3 percentage points higher than in 2014).
Ethnic minority representation varied by the type of non-legal post, with 29% of medical members and 9% of disability members being from ethnic minority backgrounds.
The proportion of ethnic minority individuals among non-legal members new entrants in 2021-22 was higher (23%) than of those in post as at 1 April 2022 (18%).
Intersection of Gender and Ethnicity
Of all non-legal tribunal members as at April 2022:
- Ethnic minority men constituted 10%
- Ethnic minority women constituted 8%
- White men constituted 34%
- White women constituted 49%
Age
Non-legal members tended to be older than judges on average, with 83% of those in post being 50 and over, and 55% being 60 and over.
For non-legal member posts in tribunals, almost half (54%) of new entrants were aged 50 and over. Most leavers (90%) were aged 50 and over.
15. Magistrates
Compared with judges, a higher proportion of magistrates are women, or from an ethnic minority background.
15.1 Magistrates in Post
Gender
As at 1 April 2022, women represented 57% of all magistrates (5 percentage points higher than in 2014).
Ethnicity
As at 1 April 2022:
- Asian or Asian British individuals constituted 7% of magistrates
- Black or black British individuals constituted 4% of magistrates
- Mixed ethnicity individuals constituted 1% of magistrates
- Individuals from other ethnicities constituted 1% of magistrates
In total, ethnic minority individuals constituted 14% of all magistrates (a 6 percentage- point increase from 2014 when 8% declared themselves as ethnic minority).
Intersection of Gender and Ethnicity
Statistics on the intersection of gender and ethnicity groups in the magistracy were not available this year, but we are looking to improve this for future iterations of this publication.
Age
Magistrates tended to be older than judges on average, with 79% of those in post being 50 and over, and 44% being 60 and over.
16. Further Information
16.1 Accompanying Files
As well as this publication, the following products are published as part of this release:
- A supporting guide providing further information on how the data is collected and processed, and including information about the quality of the statistics in relation to their use
- A set of data tables, providing more detailed statistics on the legal professions, judicial appointments and judicial office holders
16.2 Official Statistics Status
These are official statistics which should comply with all aspects of the Code of Practice for Statistics.
General information about the official statistics system of the United Kingdom is available from: (https://uksa.statisticsauthority.gov.uk/about-the-authority/uk-statistical-system/)
16.3 Future Publications
Our statisticians regularly review the content of publications. As part of our continual review and prioritisation, we welcome user feedback on existing outputs including content, breadth, frequency and methodology. Please send any comments you have on this publication including suggestions for further developments or reductions in content.
Next update: scheduled for July 2023
16.4 Contact
Enquiries and feedback on these statistics should be directed to the Data and Evidence as a Service division of the Ministry of Justice:
Wincen Lowe - email judicial.statistics@justice.gov.uk
Media or other queries on the wider policy implications of these statistics should be directed to the relevant contact:
Judicial appointments: Jessica Prandle - email diversity@judicialappointments.gov.uk or communications@judicialappointments.gov.uk
Judiciary: Katy Durrans - email katy.durrans@judiciary.uk or press.enquiries@judiciary.uk
-
The percentage of individuals who have declared their diversity characteristics as a proportion of the total population. ↩
-
The Cabinet Office guidance is published here: (https://www.ethnicity-facts-figures.service.gov.uk/style-guide/writing-about-ethnicity) ↩
-
The Sewell Report is published here: (https://www.gov.uk/government/publications/the-report-of-the-commission-on-race-and-ethnic-disparities) ↩
-
This is different from the government’s recommendation of including white minority groups in the black, Asian and minority ethnic group so that all ethnic minorities are considered together. We continue to include white minorities in the white group here to retain consistency and comparability with previous publications, but we will keep this approach under review for future publications. ↩
-
Data used has been provided for this publication specifically and may not match diversity data which is published separately by the professional bodies. For example, figures for solicitors used here differ from the published firm diversity data, which is collected by law firms and published by the SRA based on a slightly different subset of the population. ↩
-
Individuals who have completed the academic stage of training, been in qualifying employment for at least 3 years (at least one in the Graduate membership grade of CILEX) and have met the Work Based Learning outcomes. ↩
-
It is important to note that the measures of seniority for each profession are not equivalent. In particular, for barristers, QC status is awarded for excellence in advocacy and so is not equivalent to partner status shown for solicitors. While QC is used as an indicator of seniority in this publication, not all senior barristers will choose to apply for QC rank. ↩
-
Though they are not classified as partners for the purposes of these statistics, in-house solicitors can reach positions of seniority that are equivalent to partners. ↩
-
Solicitors can also technically become QCs, though they are not considered in these statistics. ↩
-
Only the following posts are open to suitably qualified Chartered Legal Executive lawyers: District Judge, District Judge (Magistrates’ Courts), Deputy District Judge, Deputy District Judge (Magistrates’ Courts), Judge of the First-tier Tribunal, Employment Judge, Road User Charging Adjudicator and Adjudicators (regulation 17 Civil Enforcement of Parking Conventions). ↩
-
An exercise is considered closed at the point at which the appropriate authority has made its decision on the recommendations made by the JAC. ↩
-
The JAC Annual Report and Accounts for 1 April 2020 to 31 March 2021 also presents the number of applications submitted and recommendations made; differences in figures are outlined in the background guidance. ↩
-
The JAC runs selection exercises for all judicial roles up to and including High Court Judge and Upper Tribunal Judge and convenes panels to make appointments for more senior roles (eg Court of Appeal); numbers for senior roles are too small to analyse in detail. ↩
-
Details of the Crime and Courts Act can be found here: (https://www.legislation.gov.uk/ukpga/2013/22/schedule/13/enacted) ↩
-
The pool is estimated based on information held by the legal professions’ organisations (Bar Standards Board, Solicitors Regulation Authority and CILEX) and the Judicial Office. Eligible pools are not currently available for non-legal exercises, where eligibility requirements for professional background vary considerably between exercises. ↩
-
Calculated from JAC application data between 2019 and 2022. ↩
-
Please see the accompanying statistical tables for a full list of the exercises completed by the JAC between 1 April 2021 and 31 March 2022 (Table 2_1). ↩
-
Candidates are selected for current vacancies under Section 87 of the Constitutional Reform Act and for vacancies that may arise in the foreseeable future under Section 94. There were 6 recommendations to a list for future potential appointment under Section 94 in 2021-22. ↩
-
This exercise has been included in the accompanying tables but will not be discussed in detail in the commentary as the numbers are too small to consider from a statistical perspective. ↩
-
These exercises are Circuit Judge, High Court Judge, District Judge (of the Civil Court) and District Judge of the Magistrates Court. ↩
-
Note that holding a senior position in the legal profession is not necessarily a good predictor of whether someone is more likely to be appointed to a judicial role. ↩
-
Currently sex is only collected in a binary way (i.e. with categories male and female). Those who left the question unanswered, those who chose ‘prefer not to say’, and those who stated they did not want their data shared further are grouped as unknown. The category Other was introduced within the JAC sex data in 2020, but there were insufficient numbers to publish these counts separately without risking disclosure of sensitive information. The few candidates who did choose the “Other” sex option have therefore been grouped in unknown, though this will change in future years if there are sufficient numbers. ↩
-
Compared to 3,912 applications and 431 recommendations for men and 731 applications and 64 recommendations where gender was not disclosed (disclosure rate of 91-93%). ↩
-
To produce an estimate combined across all legal exercises with differently sized eligible pools, a weighting was made by the number of recommendations for each exercise. ↩
-
RRIs comparing other stages of the application process are provided in the accompanying data tables. ↩
-
Including deputy and vice presidents. This percentage only includes primary appointments and therefore does not consider Upper Tier Tribunal Presidents and the Employment Appeal Tribunal President as these are not primary appointments. ↩
-
Changes are rounded to the nearest percentage point. From 2021 to 2022, the proportion of women increased from 33.82% to 35.34% for court judges and from 49.94% to 52.03% for tribunal judges. ↩
-
As an illustration, based on the 2011 Census data the proportion was 50.5%. This age group is used as it covers the range from the minimum age at which judges are likely to be appointed to the most common retirement age (70). However Census estimates by gender are not routinely published for more recent years. Estimates based on data from the 2020 Annual Population Survey are a more current statement of the economically active population in England and Wales, which show a comparative figure of 47.4% of the economically active population (EAP) in England and Wales being female. ↩
-
This figure can fluctuate from one year to the next depending on the appointments made, which do not cover all posts each year. In 2021-22, for example, most new entrants were Deputy District Judges (County courts) and Recorders, of which half were women (49% for both). ↩ ↩2
-
The 2011 Census data suggests that 14% of the working age population in England and Wales are from ethnic minority backgrounds, however Census estimates by ethnicity are not routinely published for more recent years. Estimates based on data from the 2020 Annual Population Survey are a more current statement of the economically active population in England and Wales, which show a comparative figure of 14.2% of the economically active population (EAP) in England and Wales being from ethnic minority backgrounds. ↩
-
When measured to the nearest percentage point; between 2021 and 2022, the ethnic minority proportion of court judges changed from 8.5% to 9.3%, and the ethnic minority proportion of tribunal judges from 11.6% to 12.0% ↩ ↩2
-
It is important to note that having a higher seniority position is not necessarily a good predictor of whether someone is more likely to be appointed to a judicial role. ↩
-
Compared to 5,812 applications and 723 recommendations who were white and 803 applications and 73 recommendations where ethnicity was not disclosed (disclosure rate of 91-93%). ↩
-
In order to produce an estimate combined across all legal exercises with differently sized eligible pools, a weighting was made by the number of recommendations for each exercise. ↩
-
The 2011 Census data suggests that 14% of the working age population in England and Wales are from ethnic minority backgrounds, however Census estimates by ethnicity are not routinely published for more recent years. Estimates based on data from the 2020 Annual Population Survey are a more current statement of the economically active population in England and Wales, which show a comparative figure of 14.2% of the economically active population (EAP) in England and Wales being from ethnic minority backgrounds. ↩
-
For general population, ’60 and above’ is based on population aged 60-69. ↩
-
For those posts requiring previous judicial experience, and where most applicants may be salaried judges, the background as recorded by the Judicial Office is instead used as the ‘current’ legal role. ↩
-
As introduced in the 2018-19 publication, where further detail is given. ↩
-
To prevent double counting, if an applicant has declared both a previous role of solicitor and barrister, a value of 0.5 has been assigned for both solicitor and barrister. When referring to “ever” solicitor or “ever” barrister, these adjusted figures are used. ↩
-
Detailed figures for both methods are available in the accompanying data tables. ↩
-
Figures for CILEX applicants for individual selection exercises are given in the data tables. ↩
-
In contrast to gender and ethnicity, comparisons in this section are based on applications, rather than the eligible pool. For posts not requiring judicial experience, 90% of the eligible pool based on current legal role are solicitors, far in excess of the proportion recommended, so that the relative rates for solicitors are small and provide less insight. These figures are however presented in the data tables. ↩
-
The progression rates for each group are almost identical across the two definitions of ‘current legal role’ and ‘ever legal role’. As a result, we have only presented the ‘ever legal role’ definition here. ↩
-
Figures for tribunal judges are not available for 2014. ↩
-
These figures only reflect the most recent legal role at the time of appointment, and therefore will not capture the full professional legal background of the judiciary. ↩
-
In the Gender-Profession, Ethnicity-Profession and Gender-Ethnicity-Profession sections, RRIs comparing groups’ recommendation rates from application are presented, as opposed to recommendation rates from the eligible pool, because of how dominant solicitors are in the overall eligible pool (they constitute 88% of it in this case). With so many more solicitors in the eligible pool, solicitors’ progression rate from eligible pool through to recommendation is very low by default and therefore, comparing it to the same rate for barristers is less informative than looking at the application to recommendation rates. ↩
-
These percentages do not include the small number of judges whose professional background is neither as a solicitor or a barrister. This is recorded as “other” in Table 3.3 of the accompanying tables and includes former legal executives. ↩
-
The mandatory retirement age for most judges is 70 years. Judges can still hold a post in retirement, on a fee-paid basis; however, judges sitting in retirement are not included in the figures within this publication. ↩
-
Information on sexual orientation and religion and belief has been grouped across all exercises due to the small numerical breakdowns that make conclusions drawn less meaningful if they are not combined. ↩