DCMS Sectors Economic Estimates: Regional Gross Value Added 2024
Published 5 November 2026

© Crown copyright 2026
This publication is licensed under the terms of the Open Government Licence v3.0 except where otherwise stated. To view this licence, visit nationalarchives.gov.uk/doc/open-government-licence/version/3 or write to the Information Policy Team, The National Archives, Kew, London TW9 4DU, or email: psi@nationalarchives.gov.uk.
Where we have identified any third party copyright information you will need to obtain permission from the copyright holders concerned.
This publication is available at https://www.gov.uk/government/statistics/dcms-sectors-economic-estimates-regional-gva-2024/dcms-sectors-economic-estimates-regional-gross-value-added-2024
1. Introduction
Release date: 5 November 2026
Next release: Summer 2027
Geographic coverage: United Kingdom, Regions
Time coverage: 2010 to 2024
Responsible analyst: Rachel Moyce
This release provides estimates of the contribution of included the Department for Digital, Culture, Media and Sport (DCMS) sectors to the UK economy from 2010 to 2023, and provisionally for 2024, measured by gross value added (GVA), for the UK regions.
We use current prices to report current sector estimates and chained volume measures for any comparisons over time.
Sectors included in this release are the creative industries, cultural sector, gambling, and sport. These figures do not include tourism or civil society as these are defined in a different way and data is not available at a regional level. The digital sector is also not included in this release. Following the Machinery of Government Changes in July 2026, Digital Sector Economic Estimates are transferring from the former Department for Science, Innovation and Technology (DSIT) to DCMS. We will bring the 2 series of Economic Estimates together in due course. The latest estimates for the digital sector can be found on the Digital Sector Economic Estimates page.
DCMS publishes an annual GVA series at the UK level in advance of this regional breakdown which does include tourism and civil society. We also publish a monthly GVA series, starting in January 2019, which is more timely but less accurate than the annual series and can be used as a leading indicator.
The estimates included in this release are consistent with the GVA data in our Annual GVA 2024 release and with the ONS Blue Book 2025. This release does not include revisions to GVA published as part of the ONS Blue Book 2026 on 30 October 2026.
Estimates for 2024 are provisional and subject to change as underlying data sources are updated and revised GVA data from Blue Book 2026 is incorporated into these statistics.
2. Regional GVA in Included DCMS Sectors (creative industries, cultural, sport and gambling sectors)
Our annual GVA 2024 (provisional) statistics estimated that total GVA by DCMS sectors was provisionally estimated to be £247.6 billion, 9.4% of the UK economy. The part of this generated by the creative industries, culture, gambling, and sport was £172.4 billion, 6.6% of total UK economy GVA in 2024. This publication shows how that GVA is distributed by region.
-
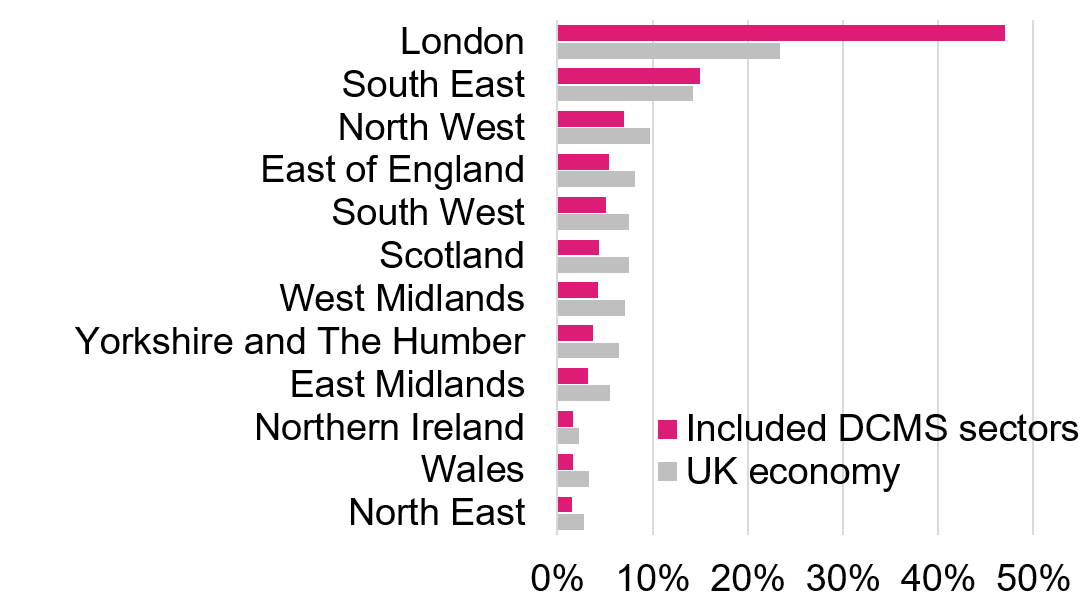
Almost half (47.0%) of included DCMS sector GVA in the UK in 2024 was generated in London (£107 billion, around 4% of total UK economy GVA in 2024), followed by the South East which contributed 15.0%.
-
London (23.4%) and the South East (14.3%) were the greatest contributors to the overall UK economy too. However London generated a substantially larger proportion of included DCMS sector GVA compared to the UK economy as a whole.
Figure 1 Included DCMS sectors and UK economy GVA Regional Distribution 2024 (percentage)
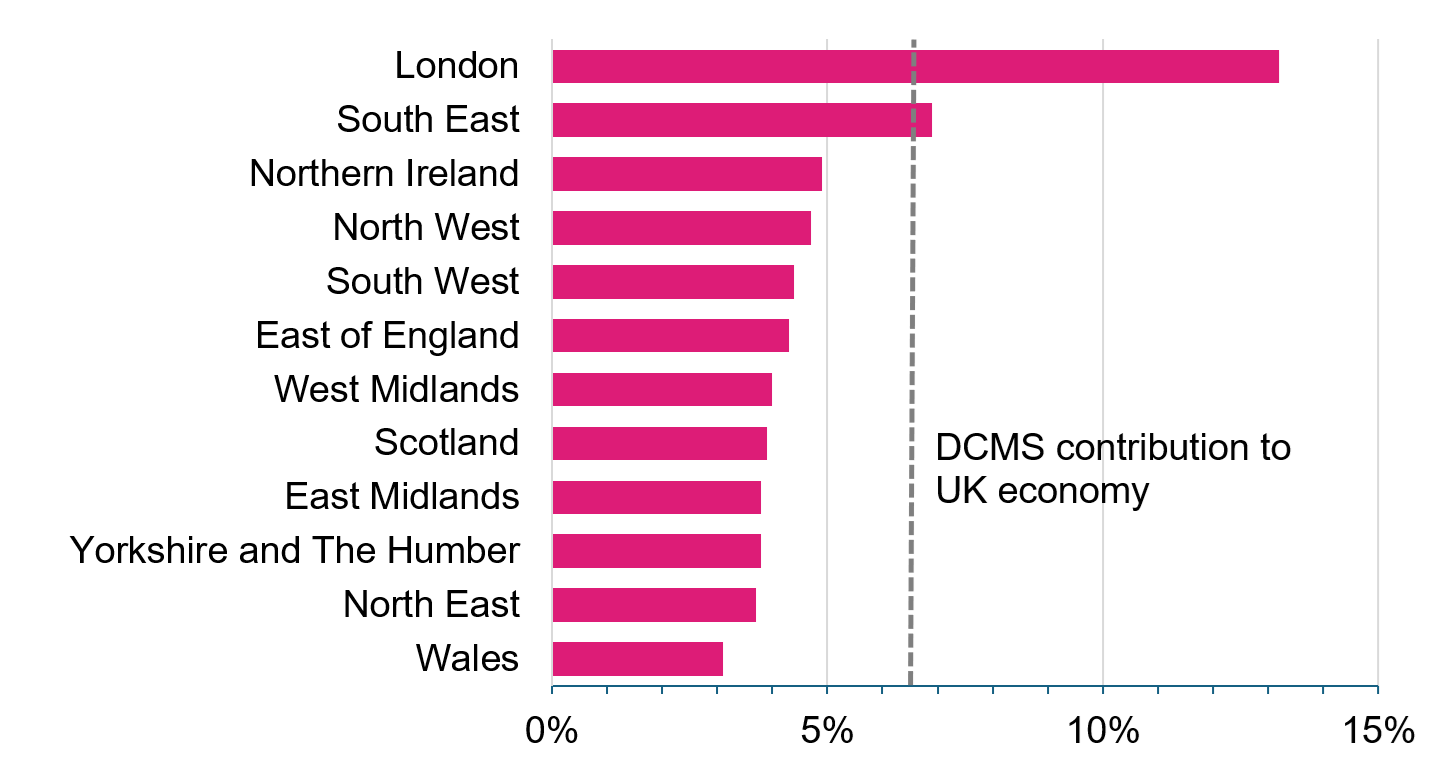
Another way to look at regional GVA is to consider the contribution of included DCMS sectors to regional economies. Included DCMS sectors contributed most to the regional economy in London and the South East, where the sectors contributed 13.2% and 6.9% respectively to the regional economy.
Figure 2. Contribution of Included DCMS Sectors to Regional Economies as a Percentage, 2024
The following findings report the real-terms growth. All GVA figures that follow are in chained volume measures and adjusted for inflation.
Included DCMS sector GVA grew in all regions between 2023 and 2024.
-
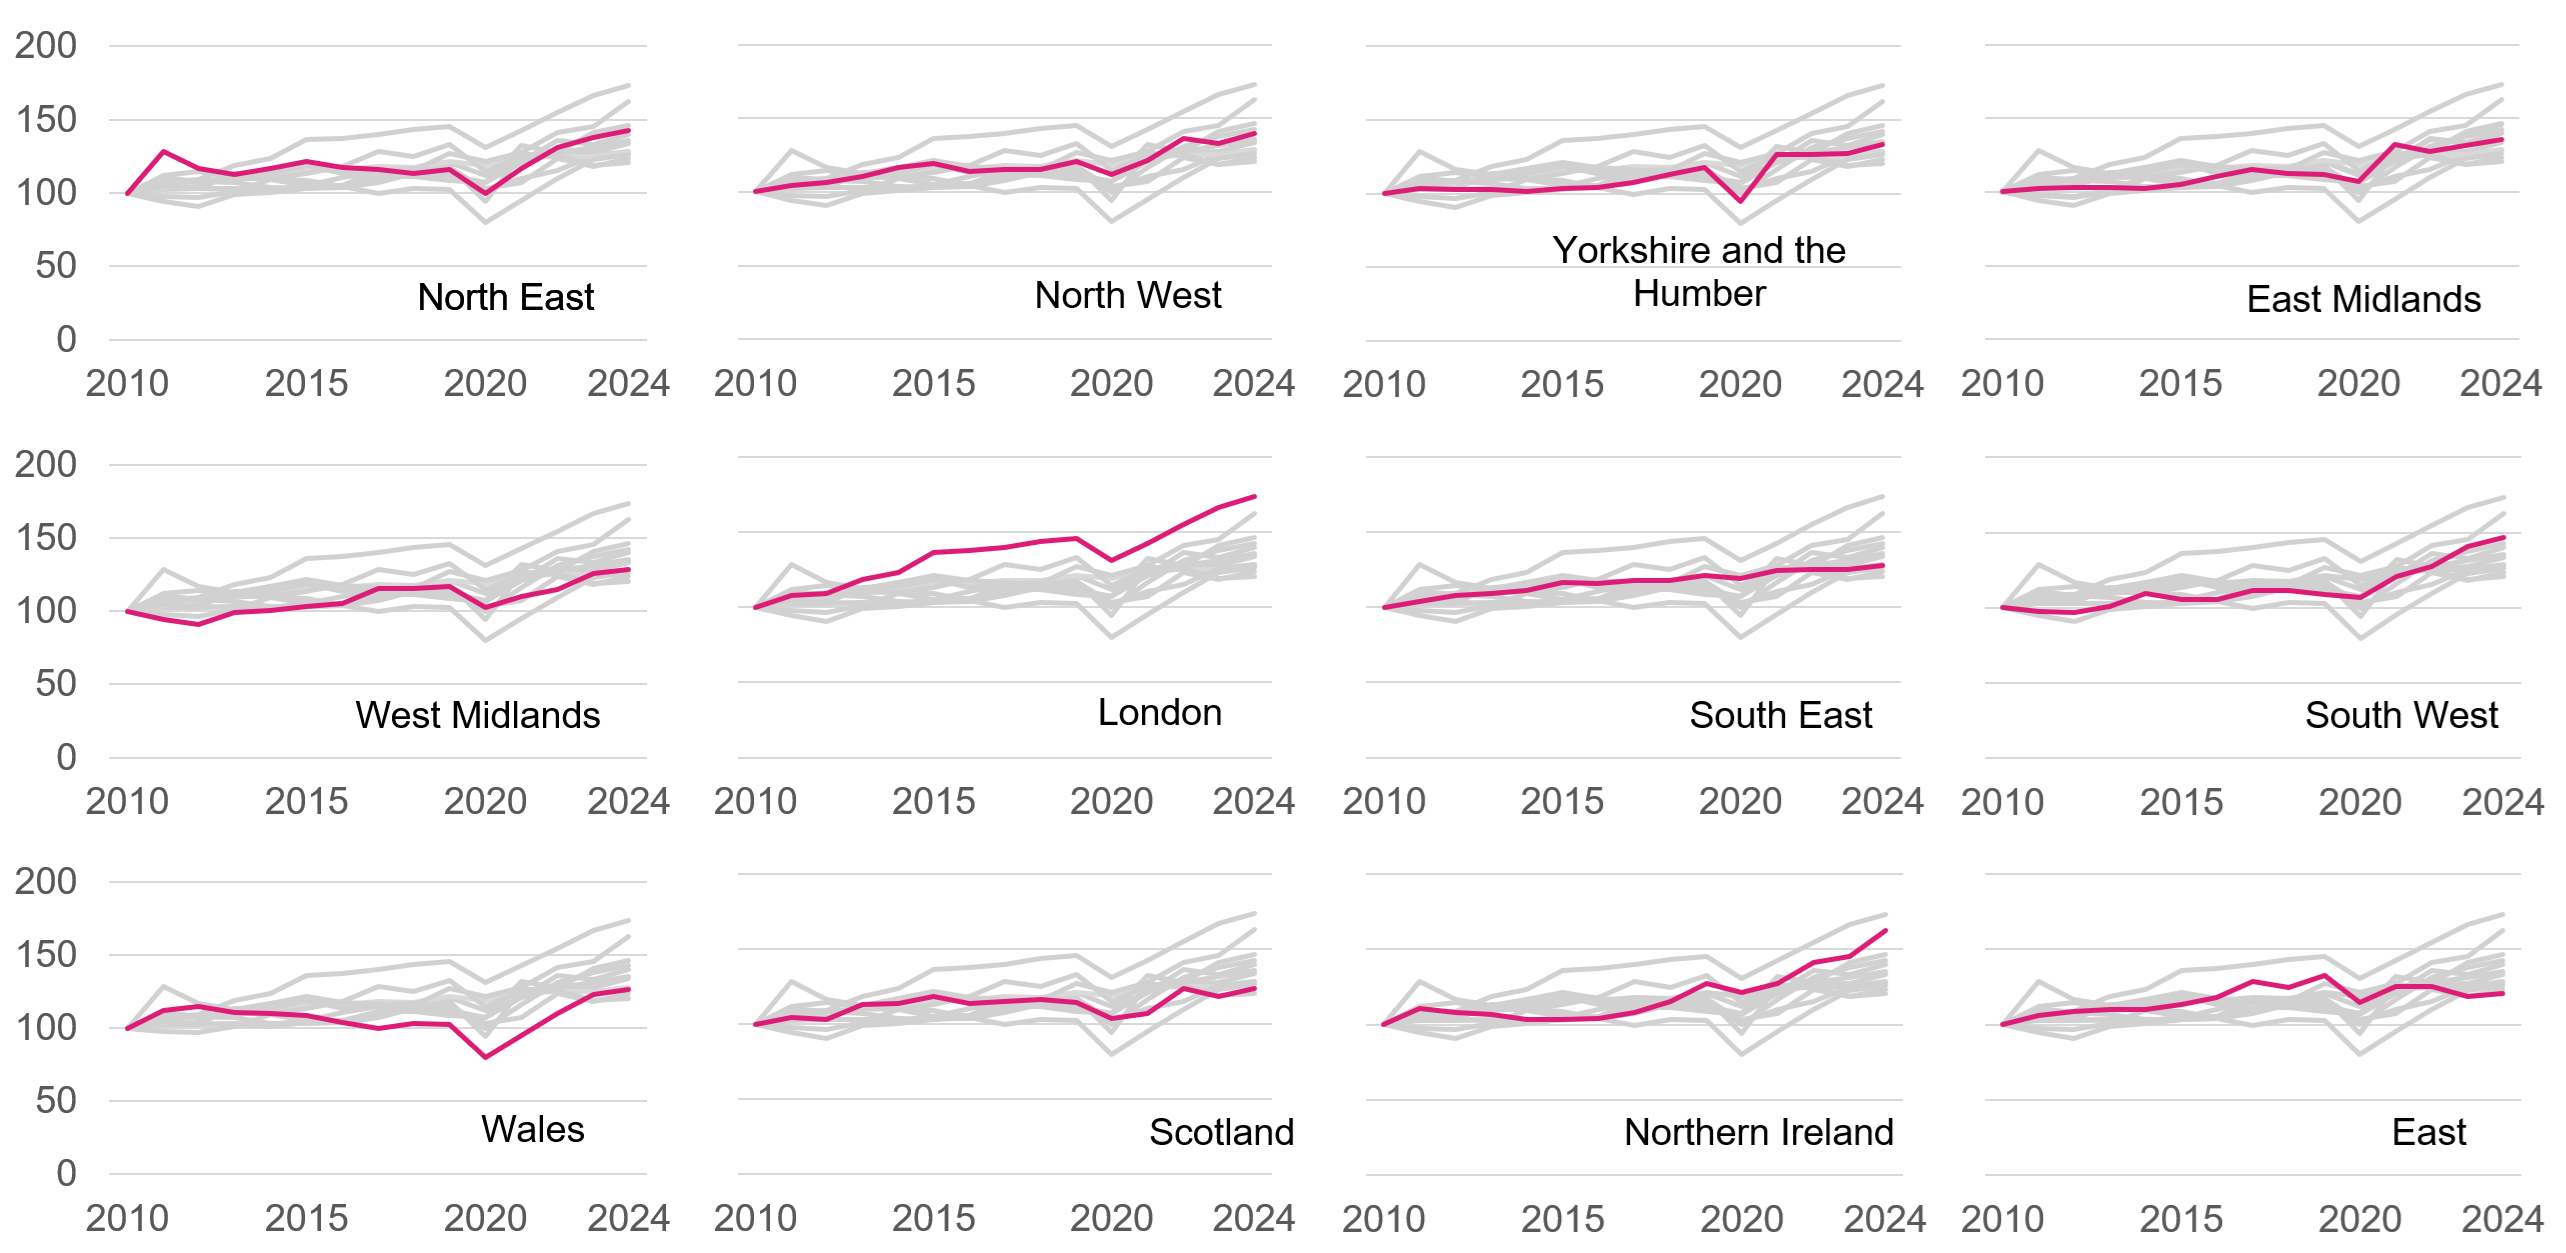
Included DCMS sector GVA grew in all regions from 2023 to 2024, following steady growth in most regions since 2020. The largest absolute increases between 2023 and 2024 were in London, the North West and the South East (at £3.1bn, £0.6bn and £0.6bn respectively). In relative terms, the largest rises in regional GVA in included DCMS sectors were in the Northern Ireland (11.9%), the North West (5.2%) and Yorkshire and The Humber (4.8%).
-
Compared to pre-pandemic levels (2019), included DCMS sectors grew across all regions by 2024, except for the East of England which had a relative fall of 9.3%. The South West GVA grew the most relatively over this period, at 34.8%.
-
Our previous publication reported that GVA for included DCMS sectors fell in all regions between 2022 and 2023. However, the latest revised data now shows that GVA for included DCMS sectors grew in most regions between 2022 and 2023.
Figure 3. Index of regional growth in included DCMS sectors, 2010 to 2024 (2010 = 100)
The regional distribution and growth vary across the individual sectors, as described in the following sections.
2.1 Sector overlap
The DCMS sectors covered in this report are:
-
creative industries
-
cultural sector
-
sport
-
gambling
The data tables also include estimates for the audio visual, computer games and arts and antiques market.
These estimates do not include the digital sector. Following the Machinery of Government (MoG) changes on 21 July 2026, no changes have yet been made to the definitions used in these statistics for DCMS sectors. We will be bringing together the former-DSIT and former-DCMS Economic Estimates series together from December 2026. These estimates do not include the digital sector.
Tourism and civil society are also not included in this publication as they are defined in a different way, and data is not available at a regional level.
In 2024, for DCMS excluding tourism and civil society:
-
84.6% of the DCMS Sector GVA is within the creative industries
-
23.4% of DCMS Sector GVA is within the cultural sector
-
However, 15.9% of DCMS Sector GVA is within both the creative industries and the cultural sector. This illustrates that the cultural sector is almost fully contained within the creative industries (but not vice versa) and these overlaps include activities such as performing arts and radio and television broadcasting.
When calculating the DCMS Sector total, the GVA from industries within the overlap is counted once. Users should be aware that the estimate for ‘All DCMS sectors’ is therefore lower than the sum of the individual sectors.
For more information, Chapter 2 of the technical report visually outlines the overlap between SIC codes in DCMS sectors, but not the value of GVA within these overlaps.
3. Creative industries
London generated around half of GVA for the creative industries in 2024, meaning this sector is much more concentrated in London than the UK economy as a whole. The sector also formed a larger proportion of the local economy of London than the other regions. From 2023 to 2024, creative industries GVA grew in all UK regions except Wales which had a slight decrease of 0.1%.
-
Total UK GVA by the creative industries in 2024 was £145.8 billion, 5.5% of UK GVA.
-
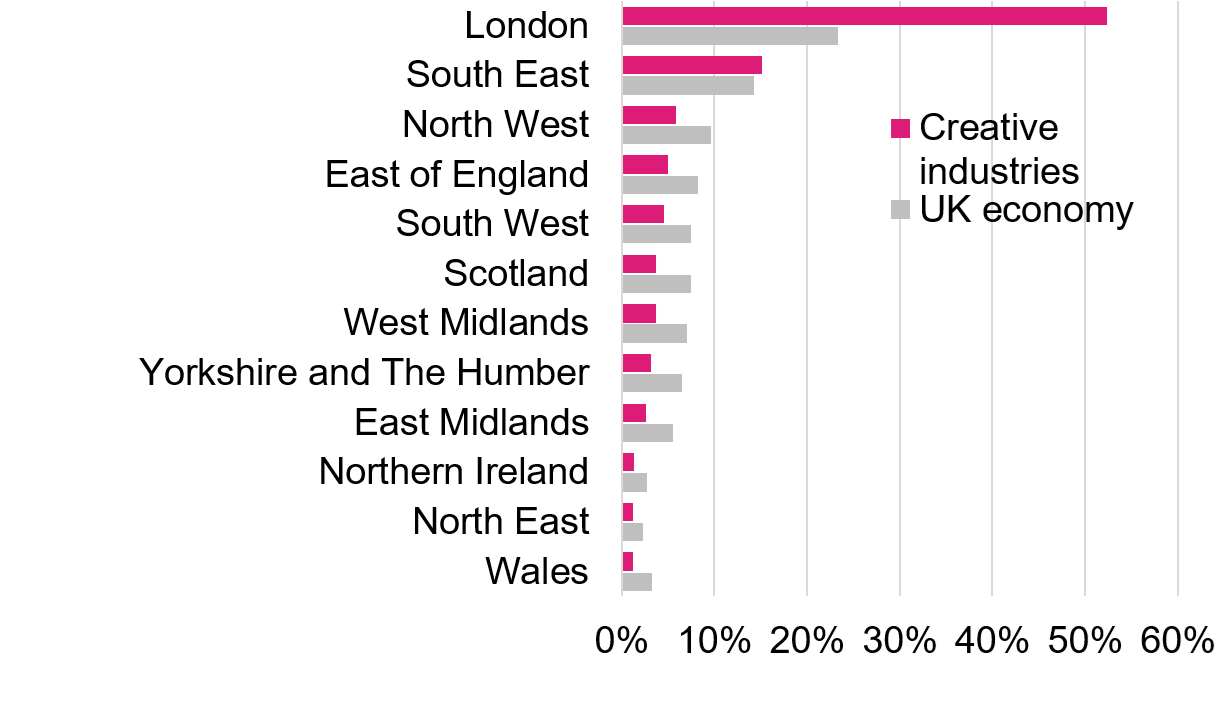
Around half of GVA in the creative industries in 2024 was generated in London (52.4%) followed by the South East (15.2%). For context, 23.4% of overall UK GVA was generated in London and 14.3% in the South East. This means that the creative industries are substantially more concentrated in London than the UK economy as a whole.
Figure 4: Regional Distribution of GVA in the Creative Industries and the Whole UK Economy in 2024
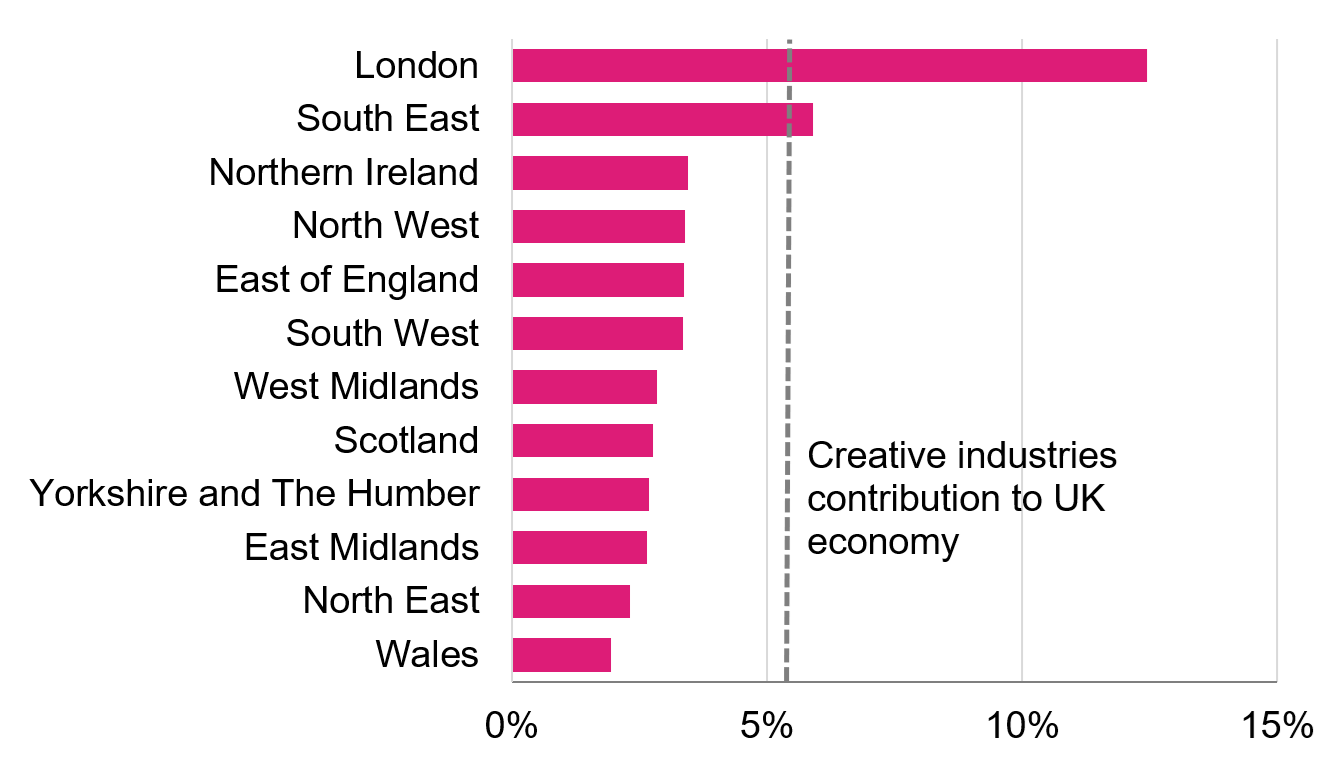
Another way to look at regional GVA is to consider the contribution of the creative industries to regional economies. The largest contributions to the local economy by the creative industries were also in London and the South East, where the sector contributed 12.4% and 5.9% to the regional economy respectively.
Figure 5. Contribution of Creative Industries to Regional Economies as a Percentage, 2024
The following findings report the real-terms growth. All GVA figures that follow are in chained volume measures and adjusted for inflation.
-
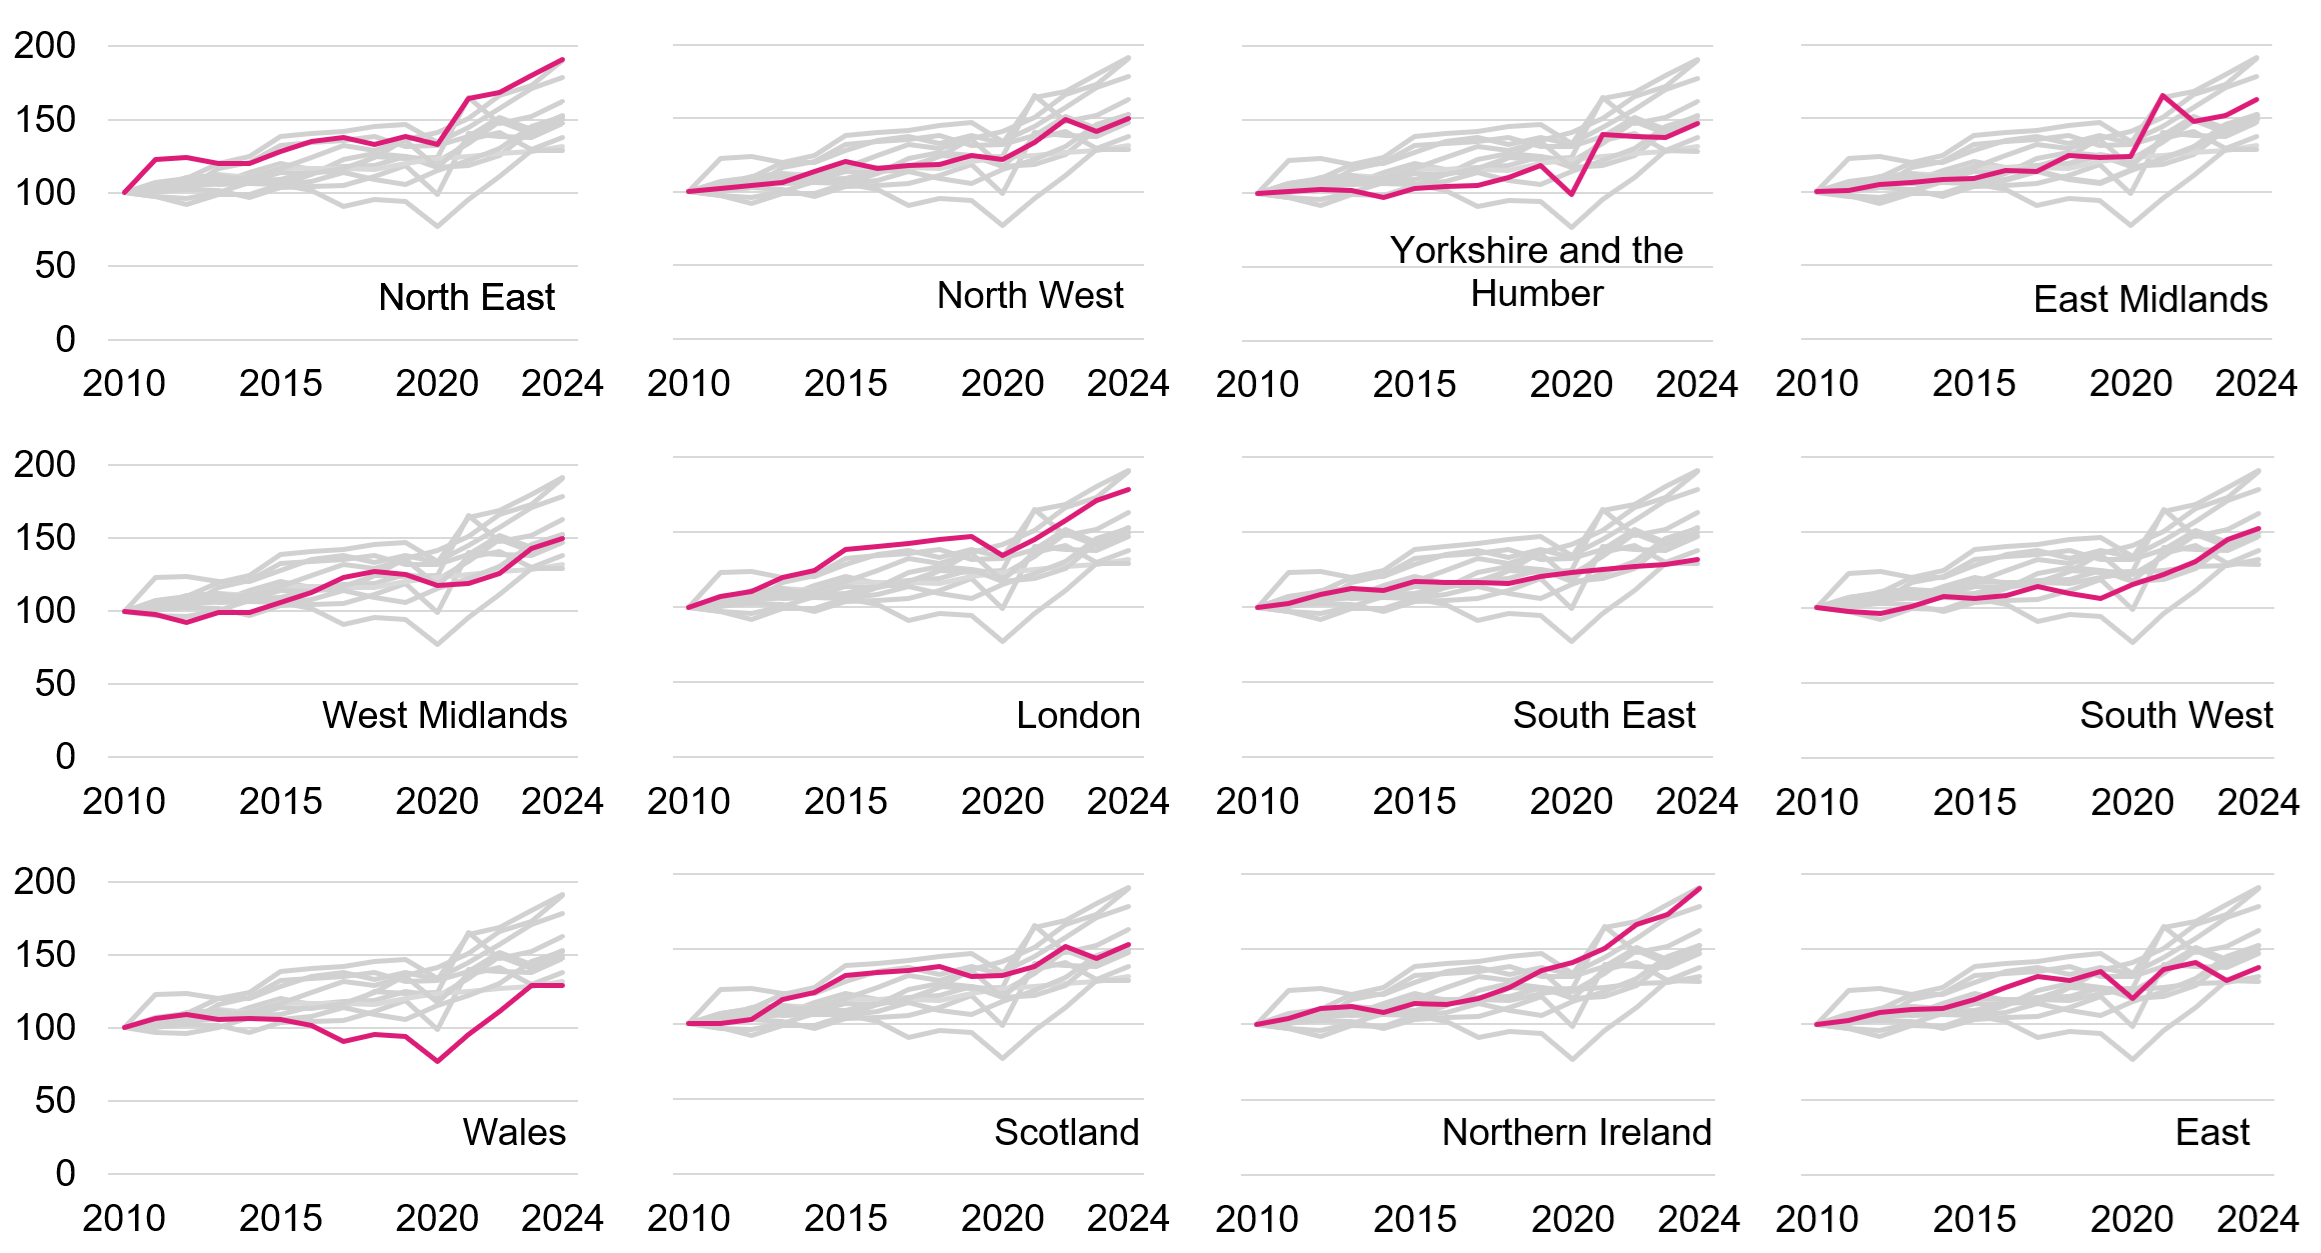
GVA by the creative industries had an overall increase of 4.6% and grew in all regions except Wales (-0.1%) from 2023 to 2024, using GVA adjusted for inflation. Northern Ireland and the East Midlands had the largest growth rates at 10.0% and 7.0% respectively. In absolute terms, London saw the most growth (£3,134 million).
-
Compared to pre-pandemic levels, between 2019 and 2024 creative industries GVA grew by 19.7%. Creative industries GVA in the South West, Northern Ireland, North East, and Wales grew the most relatively over this period, at 43.7%, 39.8%, 38.3% and 36.6% respectively.
Figure 6. Index of regional growth in the Creative Industries, 2010 to 2024 (2010 = 100)
4. Cultural sector
The majority of cultural sector GVA was generated in London in 2024. The sector also formed a larger proportion of the regional economy in London than in the other regions. From 2023 to 2024 cultural sector GVA grew in most regions.
-
Total UK GVA by the cultural sector in 2024 was £40.3 billion, 1.5% of UK GVA.
-
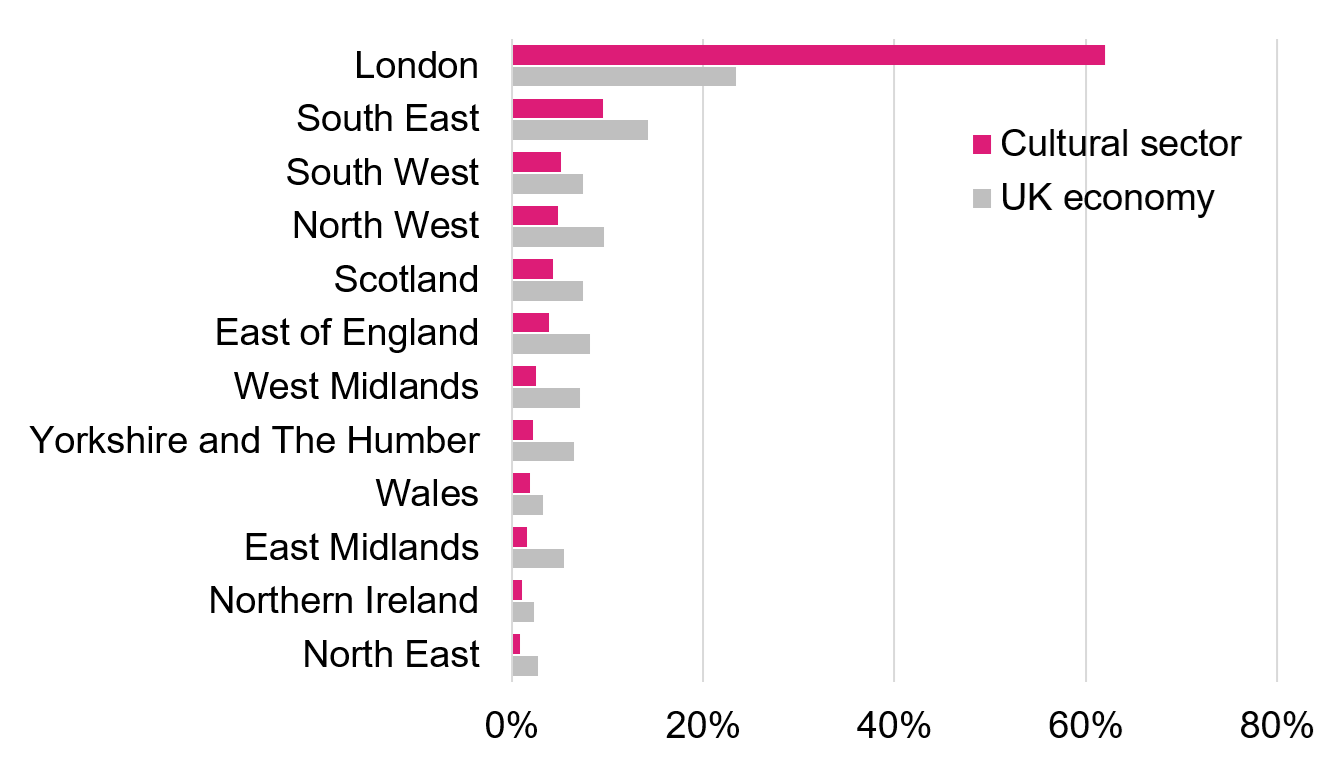
The majority of cultural sector GVA was generated in London (62.0%), followed by the South East (9.5%). For context, 23.4% of overall UK GVA was generated in London and 14.3% in the South East. This means that the cultural sector is substantially more concentrated in London than the UK economy as a whole.
Figure 7: Regional Distribution of GVA in the Cultural Sector and the Whole UK Economy in 2024
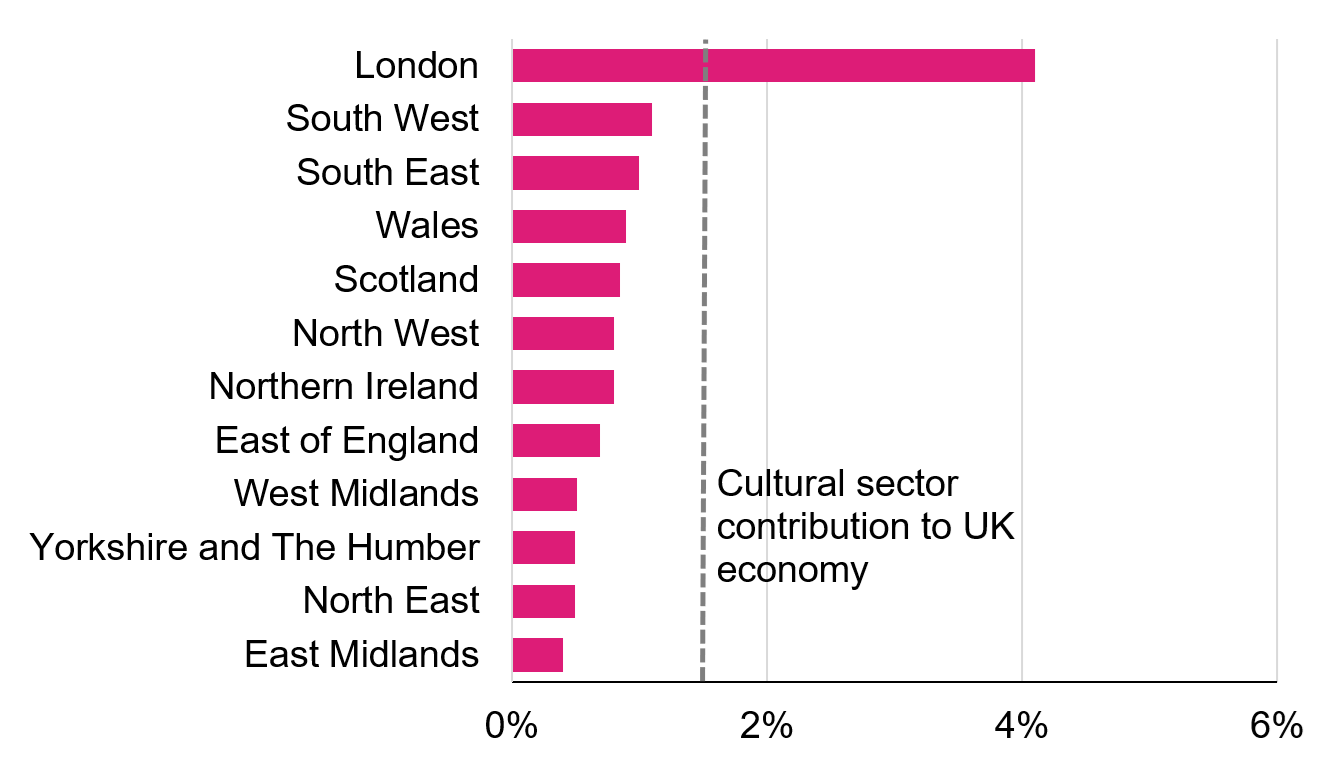
Another way to look at regional GVA is to consider the contribution of the cultural sector to regional economies. The largest contribution to the local economy by the cultural sector was in London at 4.1%, followed by the South West at 1.1%, and South East at 1.0%.
Figure 8. Contribution of the Cultural Sector to Regional Economies as a Percentage, 2024
The following findings report the real-terms growth. All GVA figures that follow are in chained volume measures and adjusted for inflation.
-
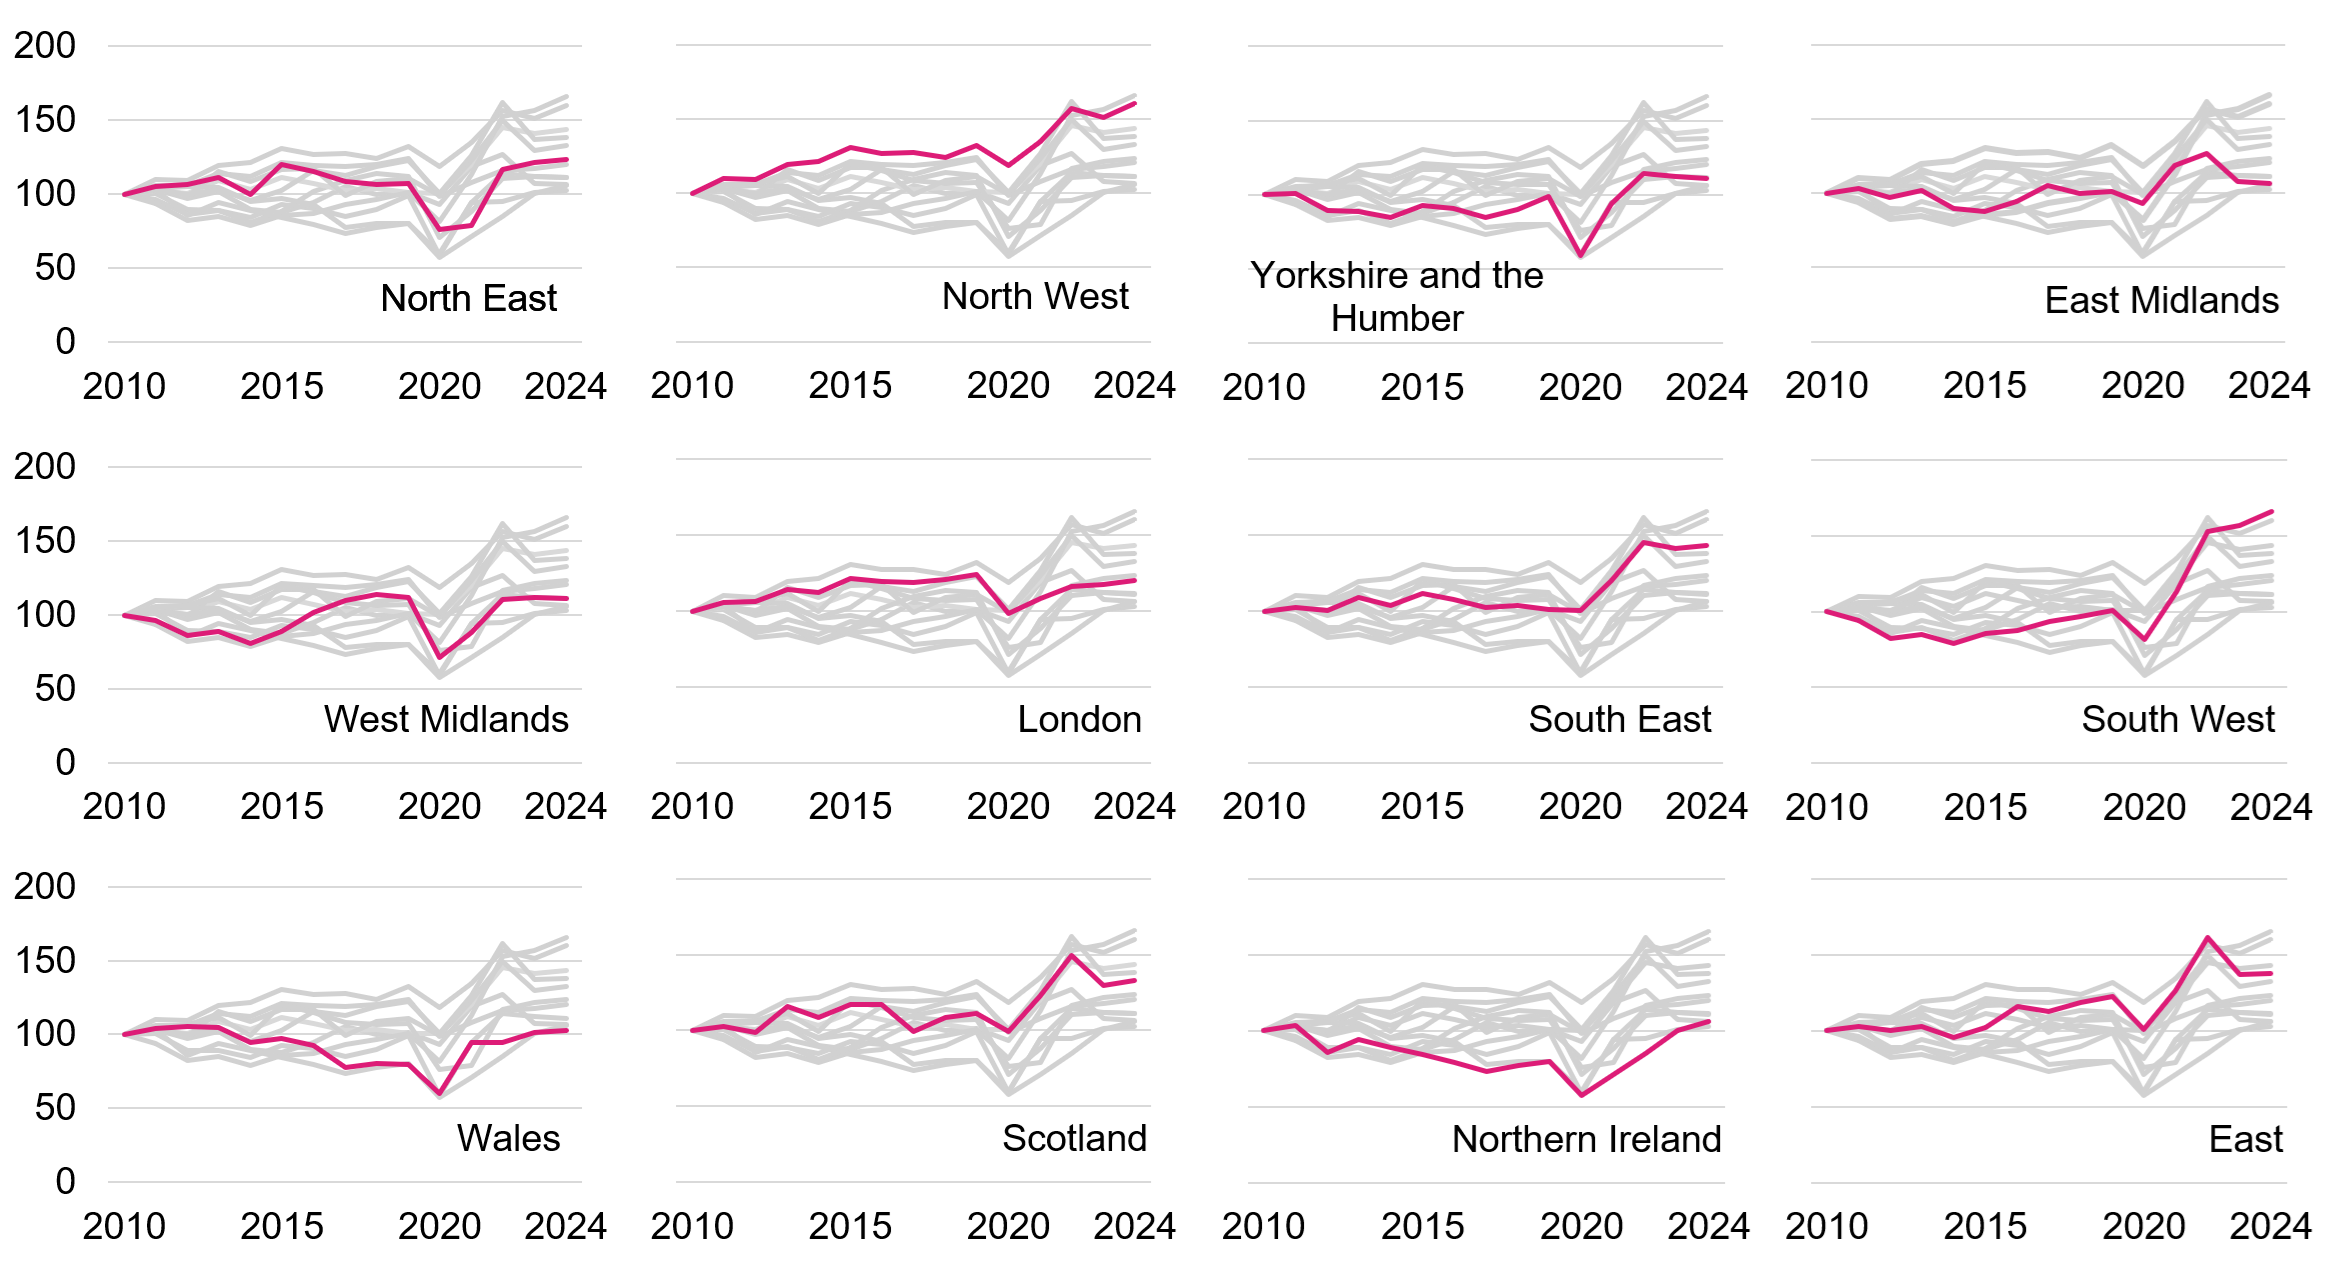
GVA by the cultural sector grew in most regions from 2023 to 2024 with an overall increase of 2.4%. In relative terms, the largest increases from 2023 to 2024 were in North West (6.0%), South West (5.9%), Northern Ireland (5.4%). The region with the largest relative fall in cultural sector GVA from 2023 to 2024 was the East (-1.0%). In absolute terms, London saw the most growth (£545 million).
-
Compared to pre-pandemic levels, between 2019 and 2024 cultural sector GVA grew by 6.4%. This was driven by the South East and South West where cultural sector GVA grew by £1.1bn (+42.1%) and £0.8bn (+64.5%) respectively. London was the only region with a fall in cultural sector GVA over this period (-2.9%).
Figure 9. Index of regional growth in the Cultural Sector, 2010 to 2024 (2010 = 100)
5. Sport sector
The largest regional contributions to sport sector GVA were from London and the South East, but contributions were more evenly spread across regions than overall included DCMS sector GVA in 2024. The sector contributed to all of the regional economies in similar proportions. From 2023 to 2024, sport sector GVA increased in around half of the 12 UK regions, while the remainder saw little change or a decline in GVA.
-
Total UK GVA by the sport sector in 2024 was £20.6 billion, 0.8% of UK GVA.
-
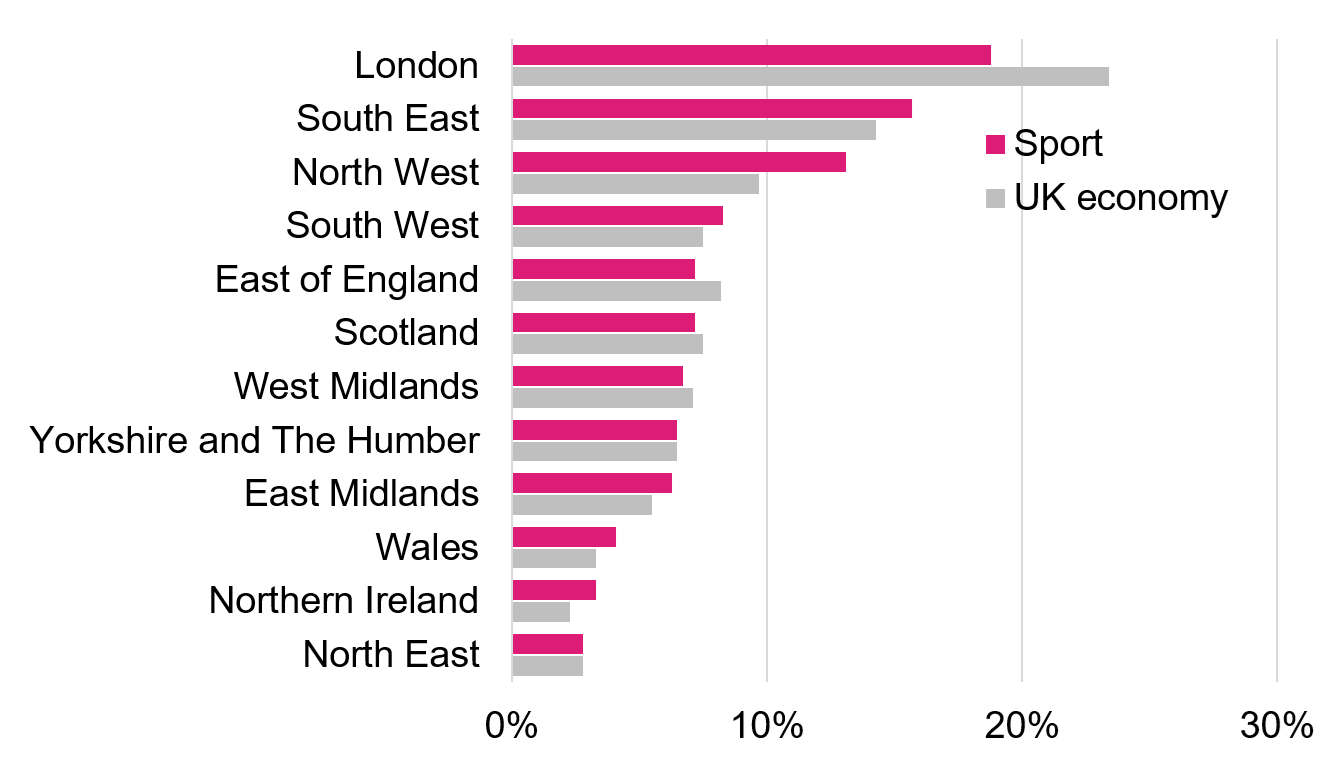
GVA in the sport sector in 2024 was more evenly spread across regions than GVA for the DCMS included sectors as a whole. The largest contribution to sport sector GVA was from London (18.8%), followed by the South East (15.7%) and the North West (13.1%). Sport sector GVA is less concentrated in London than the UK overall (23.4%).
Figure 10: Regional Distribution of GVA in the Sport Sector and the Whole UK Economy in 2024
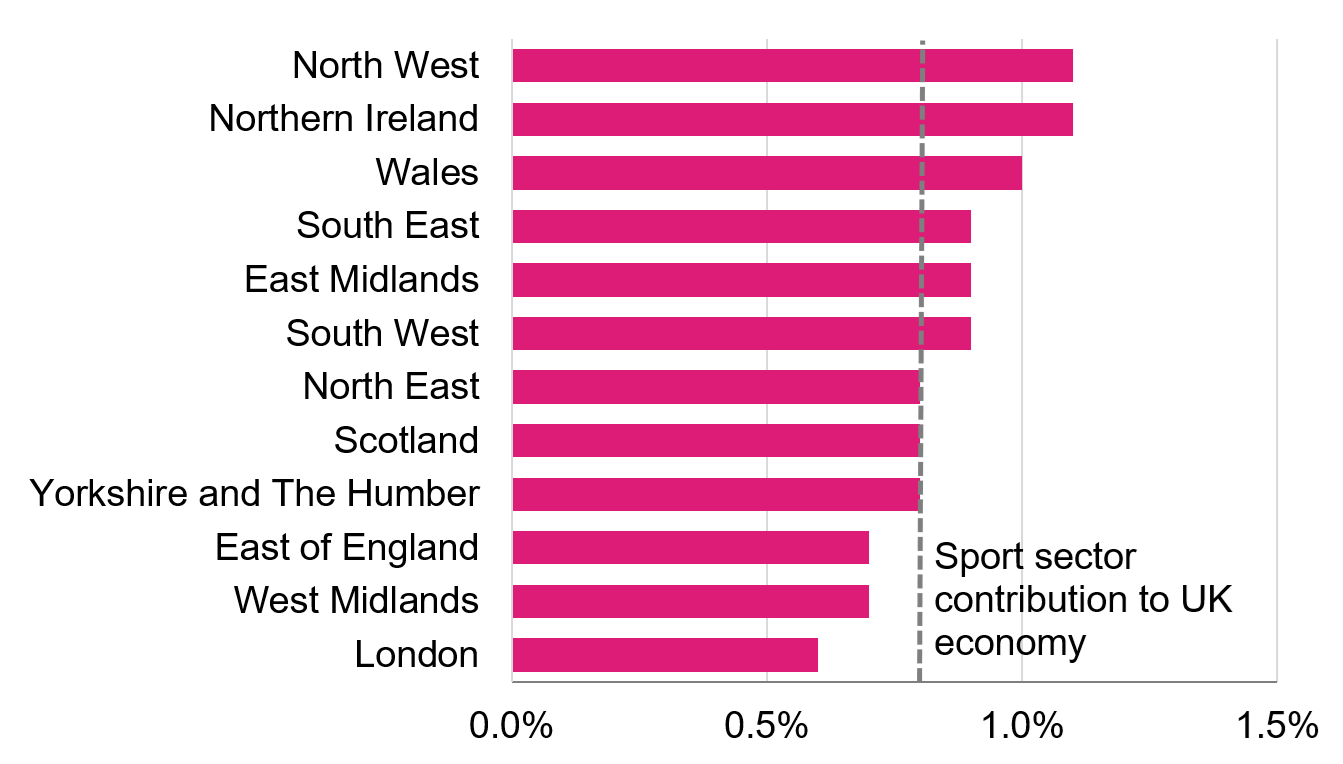
Another way to look at regional GVA is to consider the contribution of the sport sector to regional economies. The sport sector contribution to the regional economy was similar in every region in 2024. The largest contributions to the local economy were the North West and Northern Ireland, both at 1.1%.
Figure 11. Contribution of the Sport Sector to Regional Economies as a Percentage, 2024
The following findings report the real-terms growth. All GVA figures that follow are in chained volume measures and adjusted for inflation.
-
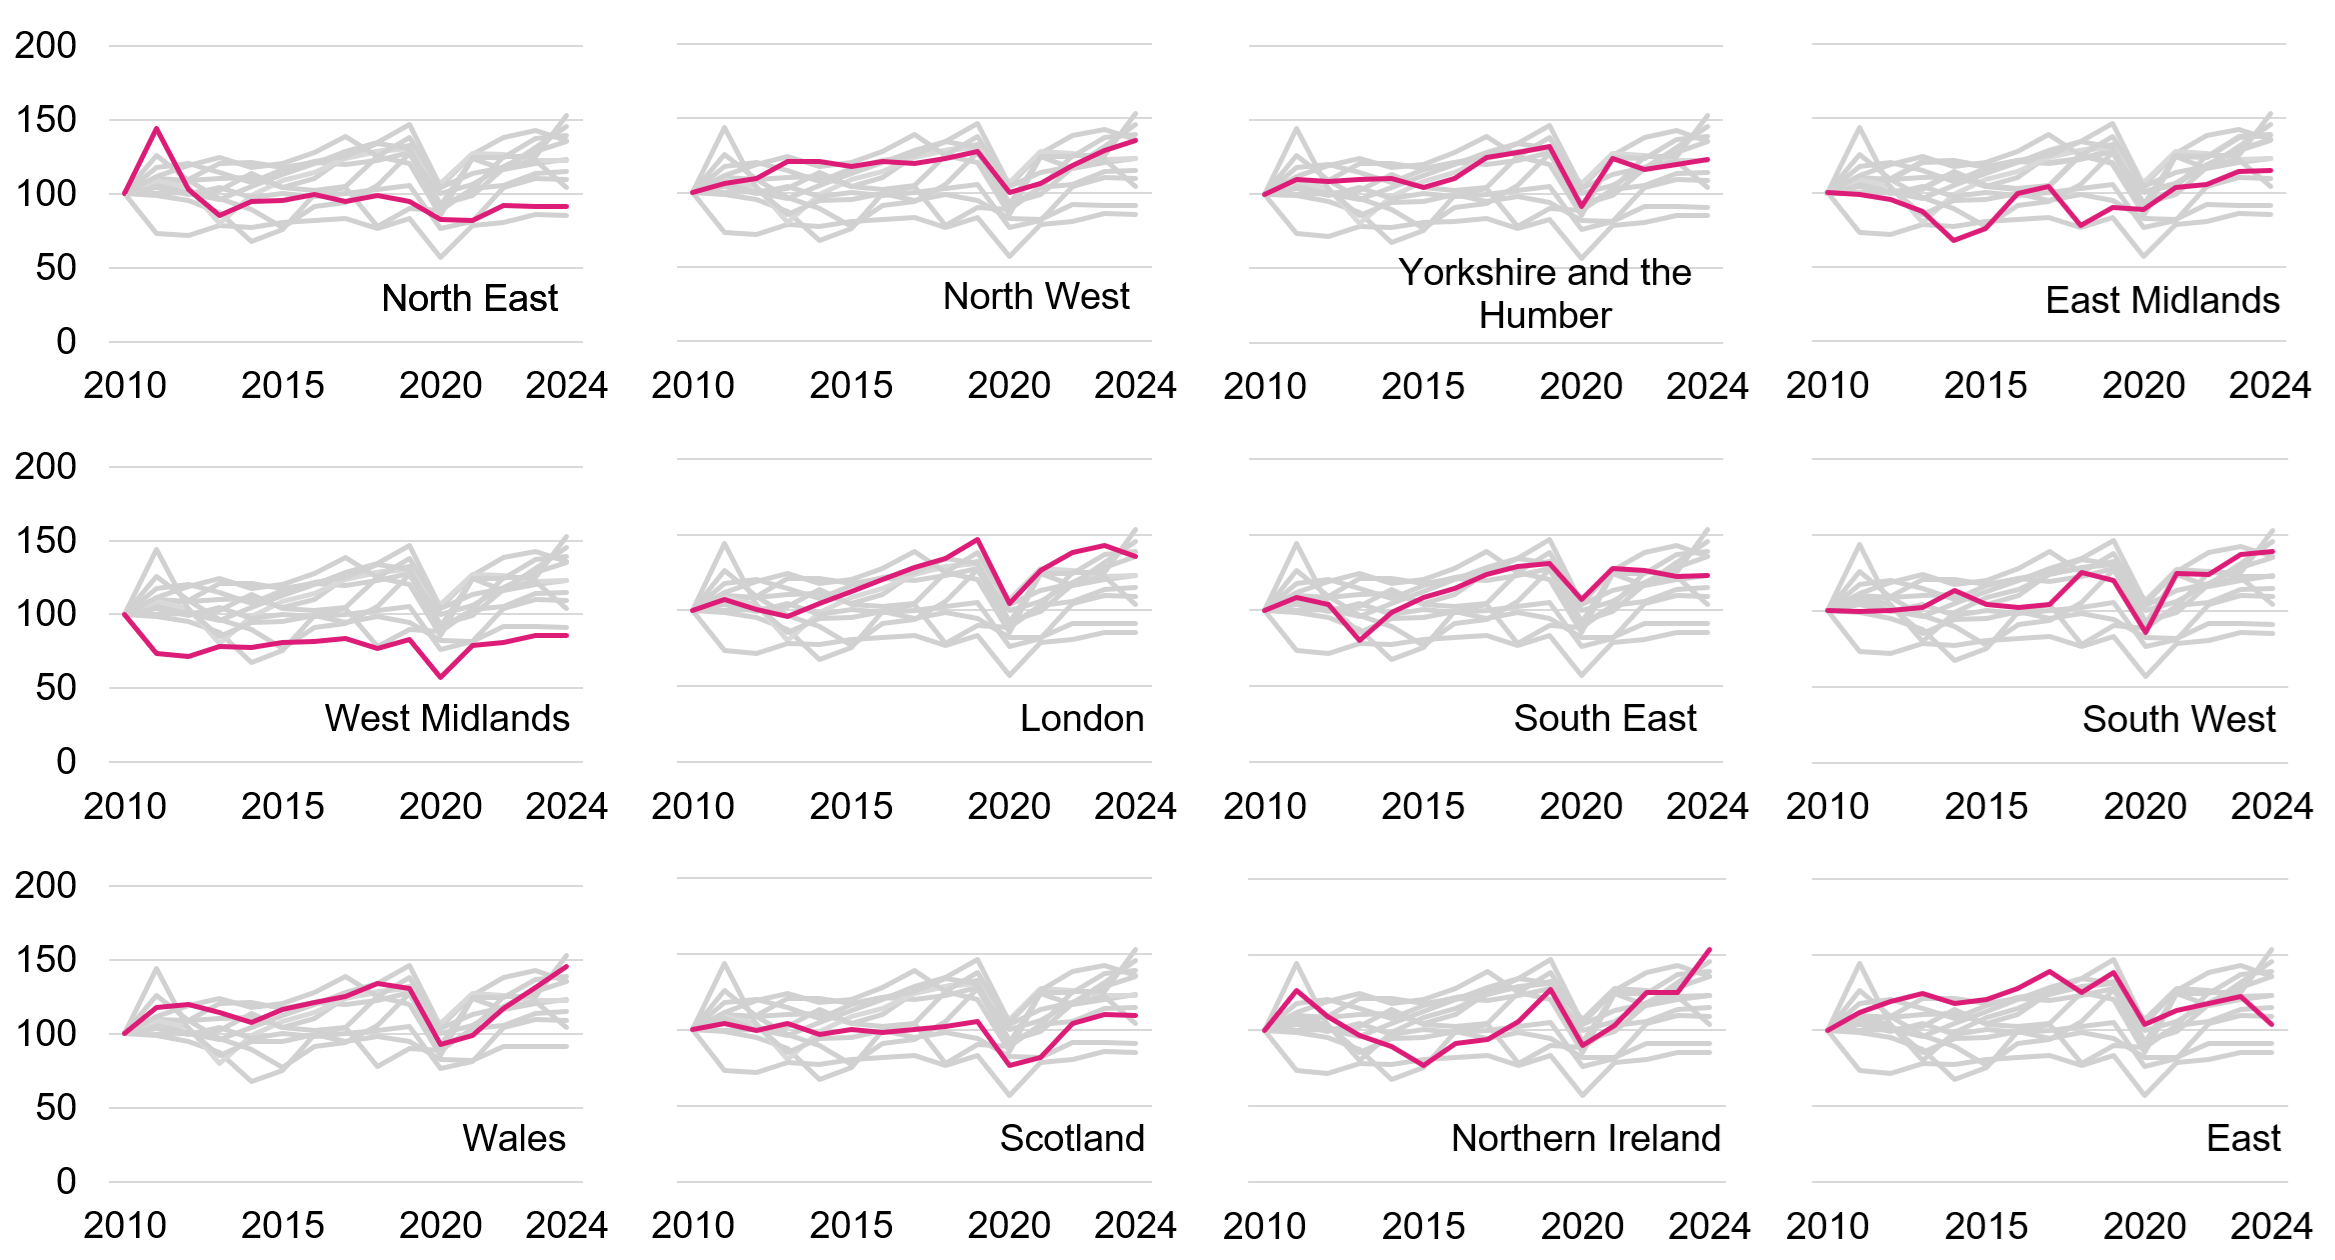
GVA by the sport sector in the UK overall fell by 0.3% between 2023 and 2024. However, this varied by region and sport sector GVA grew in around half of the UK regions between 2023 and 2024. In relative terms, the largest increases from 2023 to 2024 were in the Northern Ireland (22.2%) and Wales (10.9%). The largest relative fall was in the East (-14.8%).
-
Compared to pre-pandemic levels, between 2019 and 2024 sport sector GVA fell by 0.8%. The regions driving this fall were the East and London, which also had the largest relative falls, at -24.4% and -7.3% respectively. The largest relative increase was in the East Midlands at 27.5%.
Figure 12. Index of regional growth in the Sport Sector, 2010 to 2024 (2010 = 100)
6. Gambling sector
The largest regional contributions to gambling sector GVA in 2024 were London, the North West, and the West Midlands. Contributions were more evenly spread across regions than included DCMS sector GVA overall. All regions experienced a fall between 2019 and 2024, except the North East and North West.
-
Total UK GVA by the gambling sector in 2024 was £5.0 billion, 0.2% of UK GVA.
-
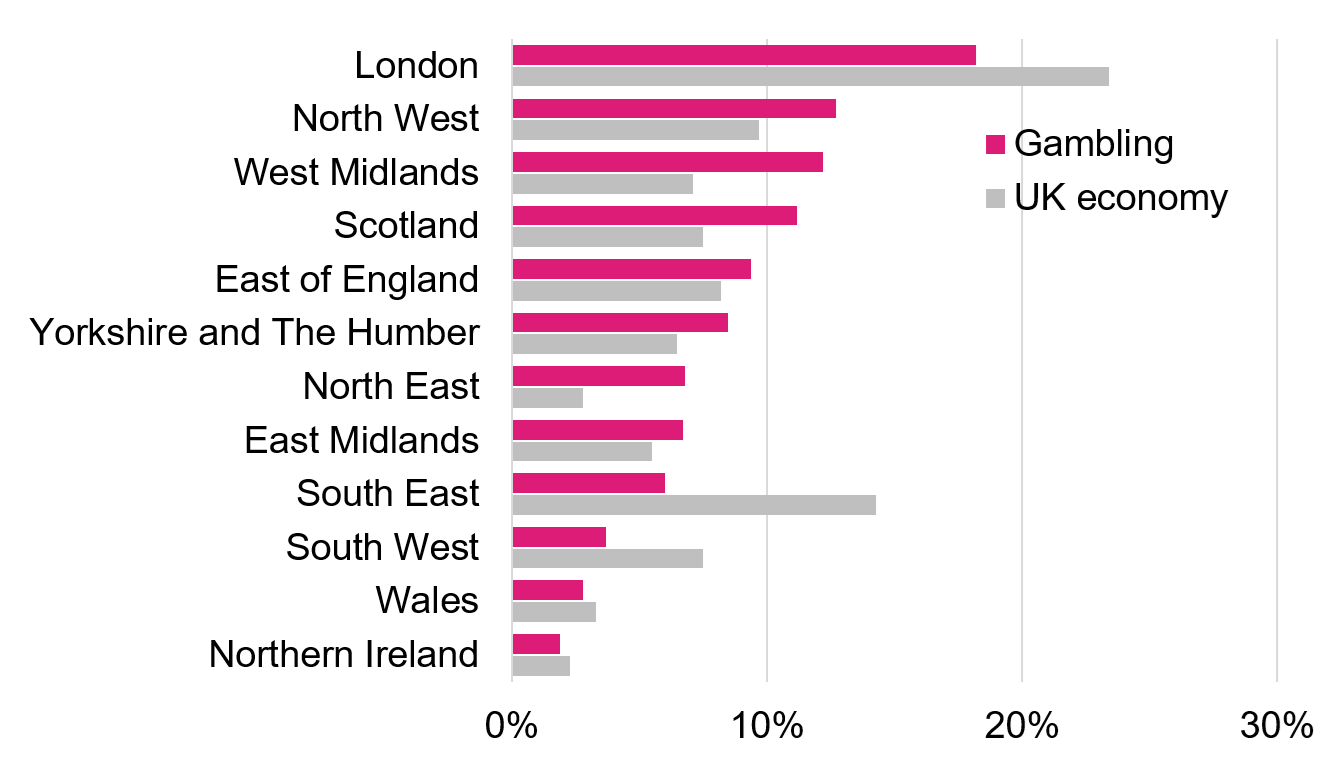
The regions contributing most to gambling sector GVA were London (18.2%), North West (12.7%) and the West Midlands (12.2%). For context, 23.4% of overall UK economy GVA was generated in London, 9.7% in North West and 7.1% in the West Midlands.
Figure 13: Regional Distribution of GVA in the Gambling Sector and the Whole UK Economy in 2024
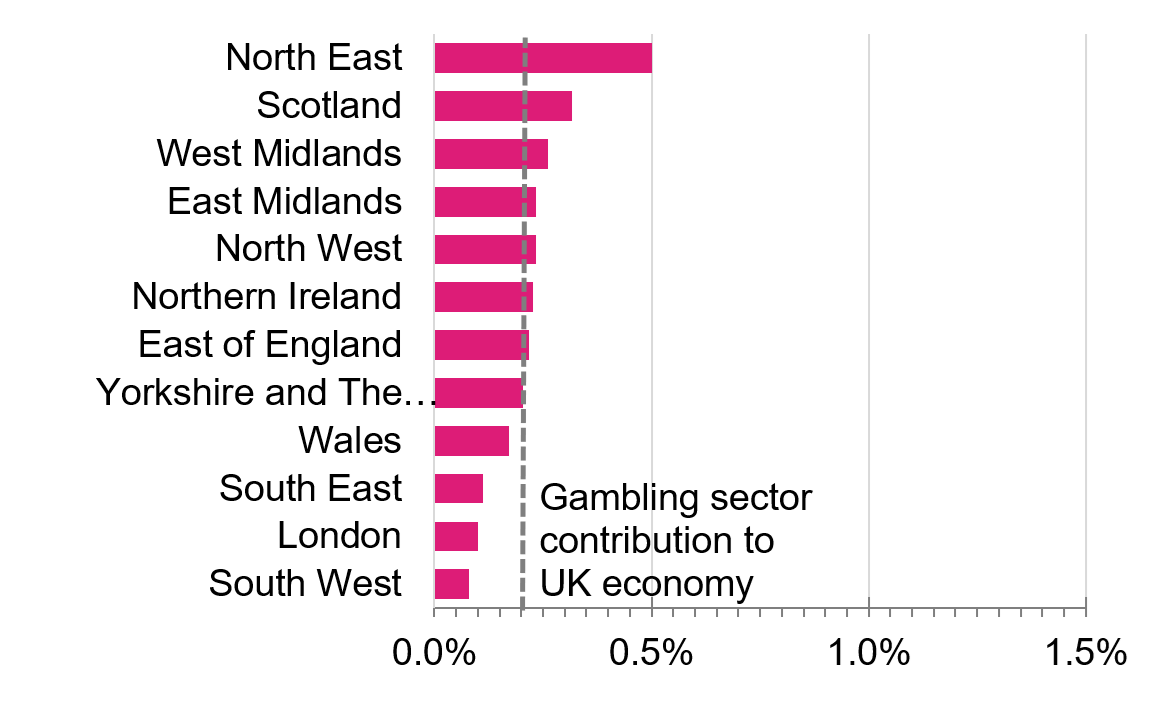
Another way to look at regional GVA is to consider the contribution of the gambling sector to regional economies. The largest contributions to the local economy by the gambling sector were the North East at 0.5%, and the West Midlands and Scotland, both at 0.3%, although contributions are similar across the regions.
Figure 14. Contribution of the Gambling Sector to Regional Economies as a Percentage, 2024
The following findings report the real-terms growth. All GVA figures that follow are in chained volume measures and adjusted for inflation.
-
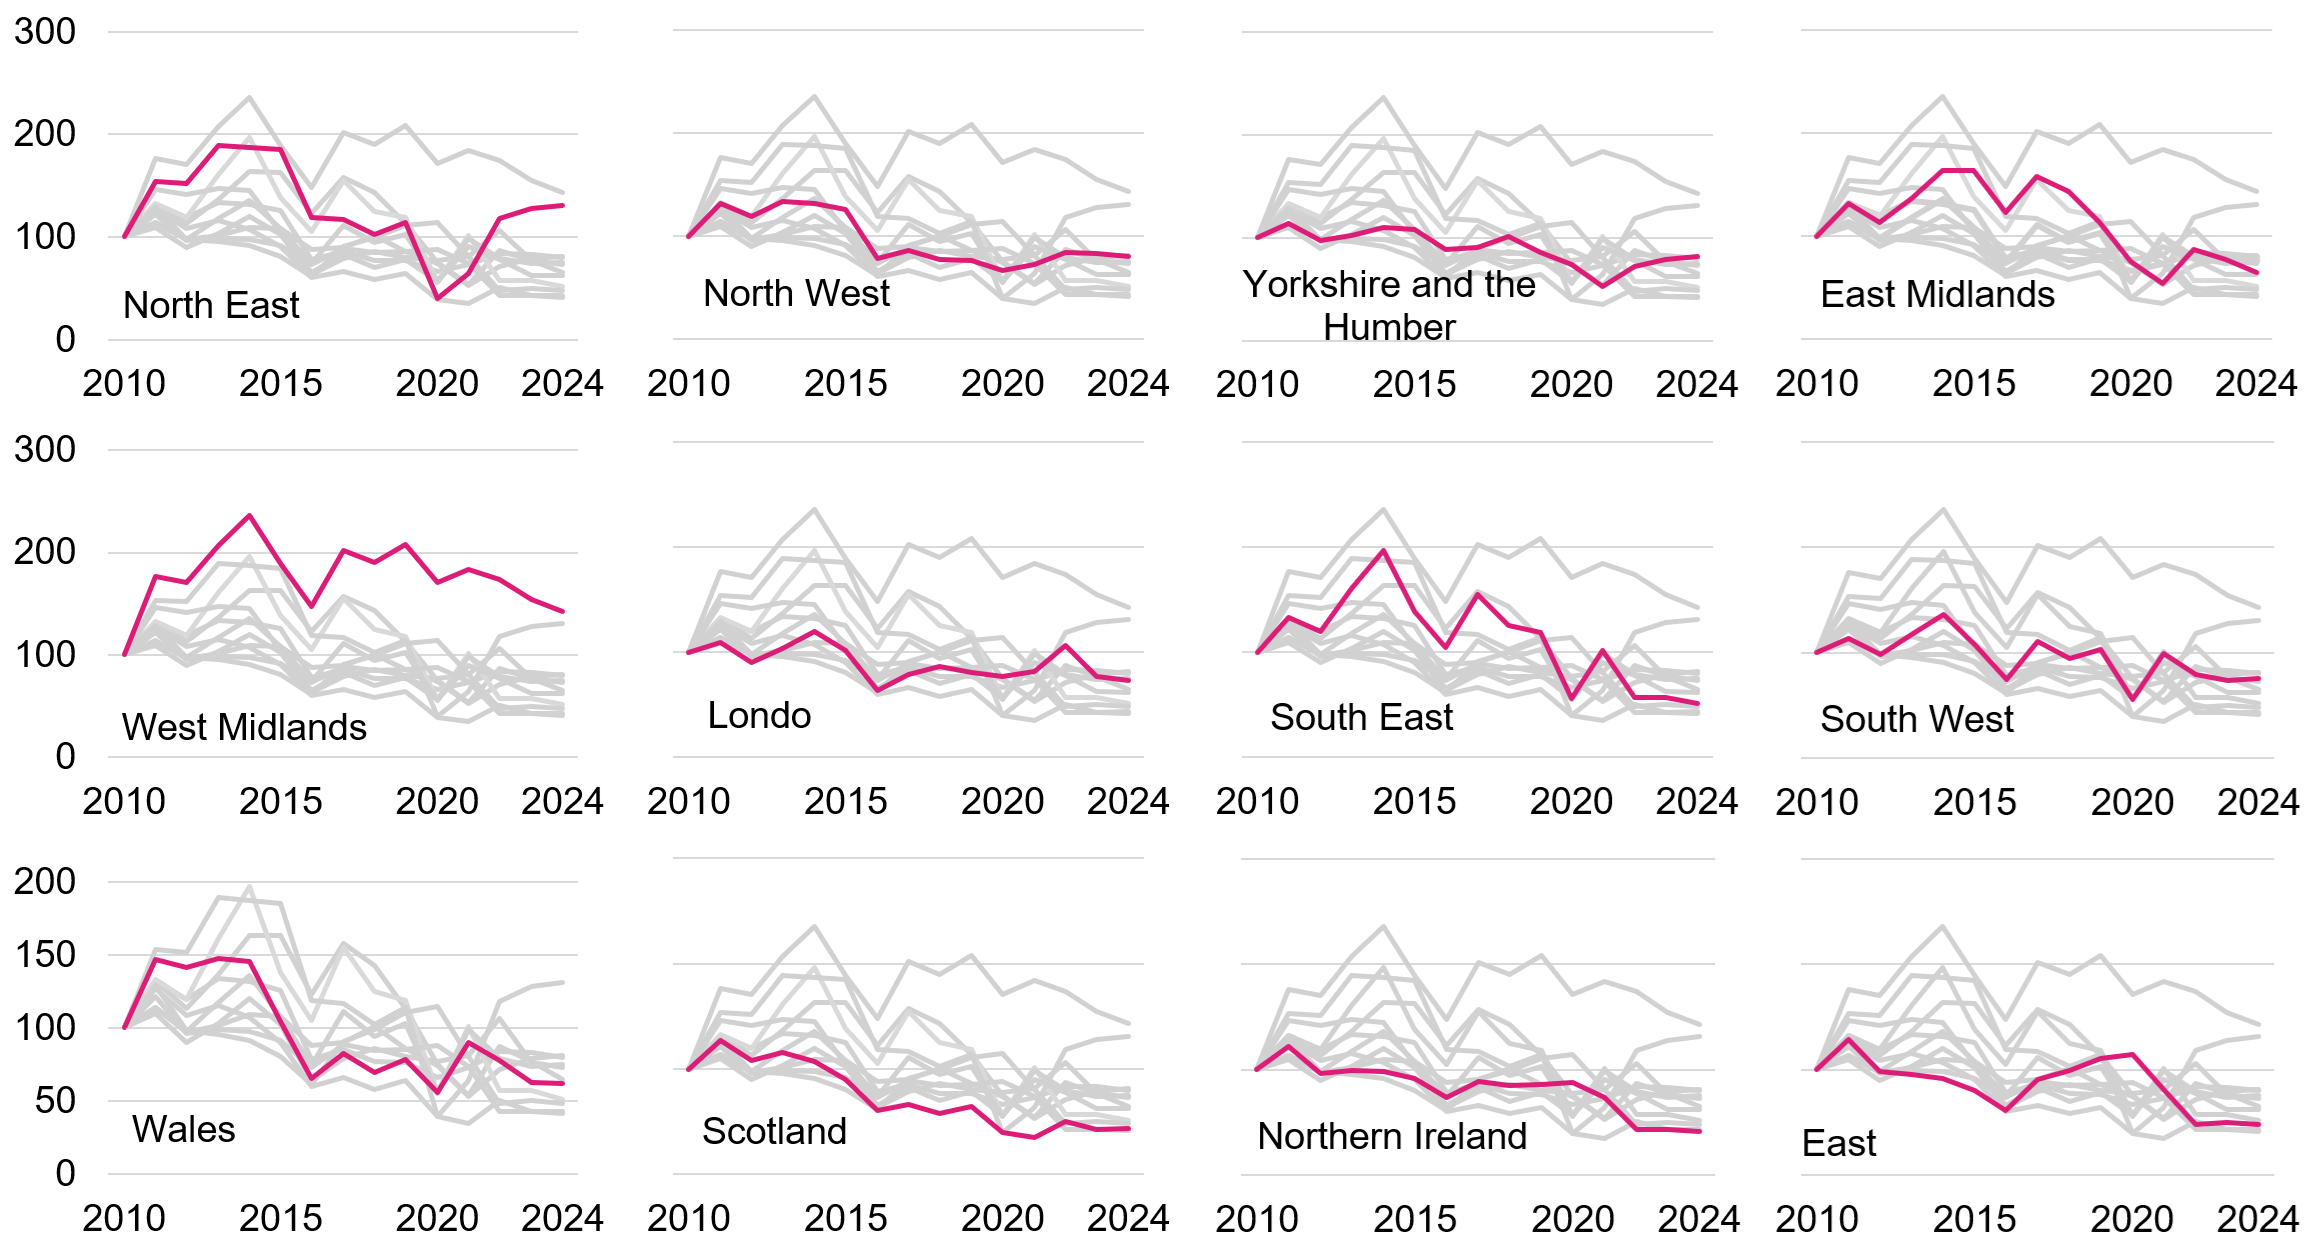
GVA by the gambling sector fell in most regions from 2023 to 2024. Only 4 regions grew during this period. These include Yorkshire and the Humber (2.9%), North East (2.3%), South West (2.0%), and Scotland (0.7%). The largest relative regional falls in gambling GVA were in the East Midlands (-15.7%) and the South East (-10.1%).
-
Compared to pre-pandemic levels, between 2019 and 2024 gambling sector GVA fell by 29.1%. GVA in South East and the East fell the most relatively over this period, at -56.7% and -56.5% respectively, followed by Northern Ireland (-51.7%). Gambling GVA rose in the North East (14.9%), North West (4.3%).
Figure 15. Index of regional growth in the Gambling Sector, 2010 to 2024 (2010 = 100)
7. Further information
GVA is a measure of the increase in the value of the economy due to the production of goods and services. Its relationship to GDP is as follows:
GVA = GDP + Subsidies - Taxes
GVA is measured either at:
-
current basic prices (‘nominal GVA’), which give the best ‘instantaneous’ measure of the value to the economy, but are not adjusted for the effect of inflation.
-
chained volume measures (‘real terms GVA’), where the effect of inflation is removed.
The accompanying data tables consist of current prices and chained volume measures for DCMS sectors and subsectors from 2010 to 2024.
We use current prices to report current sector estimates and chained volume measures for any comparisons over time.
The DCMS sectors covered in this report are:
-
Creative Industries
-
Cultural Sector
-
Gambling
-
Sport
Methodological information on the sector definitions, data sources, derivation of GVA and limitations of the approach can now be found in the accompanying technical report, along with. a summary of alternative economic measures of these sectors that are published elsewhere.
These official statistics were independently reviewed by the Office for Statistics Regulation in June 2019. They comply with the standards of trustworthiness, quality and value in the Code of Practice for Statistics and should be labelled ‘accredited official statistics’. Accredited official statistics are called National Statistics in the Statistics and Registration Service Act 2007.
The responsible statistician for this release is Rachel Moyce. For enquiries on this release, please email evidence@dcms.gov.uk.
For general enquiries contact:
Department for Culture, Media and Sport 100 Parliament Street London SW1A 2BQ
Contact the Department for Digital, Culture, Media and Sport - GOV.UK
For media enquiries contact: 020 8080 3054.