Criminal court statistics quarterly: October to December 2019 (HTML)
Published 26 March 2020
Applies to England and Wales

© Crown copyright 2020
This publication is licensed under the terms of the Open Government Licence v3.0 except where otherwise stated. To view this licence, visit nationalarchives.gov.uk/doc/open-government-licence/version/3 or write to the Information Policy Team, The National Archives, Kew, London TW9 4DU, or email: psi@nationalarchives.gov.uk.
Where we have identified any third party copyright information you will need to obtain permission from the copyright holders concerned.
This publication is available at https://www.gov.uk/government/statistics/criminal-court-statistics-quarterly-october-to-december-2019/criminal-court-statistics-quarterly-october-to-december-2019
We are trialling the publication of this statistical bulletin in HTML format alongside the usual PDF version and we are seeking user feedback on the use of HTML for the publication of statistical bulletins. Please send any comments to: datausers@justice.gov.uk.
Main Points
| Magistrates’ court: receipts and disposals increase slightly | Receipts and disposals increased by 1%, while outstanding cases remained broadly in line with levels seen since Q2 2016. Receipts for indictable only cases increased 4%. |
| Crown Court: increase in receipts, decrease in disposals | The number of receipts increased 10% whilst the number of disposals fell by 8% on the previous year. |
| Crown Court: increase in outstanding | Outstanding cases increased by 13% on the previous year, from 33,113 to 37,434 cases. |
| Average waiting times at the Crown Court continue to fall | The median waiting time reached 5.7 weeks, down just under a week compared to Q4 2018 (6.6 weeks) and less than half of the peak seen in Q2 2015 (13.0 weeks). |
| Time spent from offence to completion increased at magistrates’ courts | For all cases completing at the magistrates’ courts, the median time from offence to completion increased 11%, due to increases from offence to charge/first listing (14%) |
| Fall in time spent ‘at court’ for complete Crown Court cases | Overall timeliness rose due to ‘pre-court’ durations increasing by 46%, whereas time ‘at court’ fell by 12% compared to Q4 2018. |
| Interpreters: completed requests increased | The number of completed requests in Q4 2019 (42,436) increased 8% compared to the previous year, while the success rate remained at 97%. |
The technical guide to ‘Criminal court statistics’ and ‘Language interpreter and translation services in courts and tribunals’ can be found at the links below:
https://www.gov.uk/government/publications/a-guide-to-criminal-court-statistics
https://www.gov.uk/government/statistics/guide-to-language-interpreter-and-translation-services
1. Change to note
COVID-19 and future publications
This release includes all available data series and there has been no direct or indirect impact on the availability or the quailty of the statistics as a result of the coronavirus illness (COVID-19).
However, due to the coronavirus illness the Ministry of Justice anticipate that there might be some changes in terms of our regular statistical production. The current disruption to the UK could affect the quality of some of our statistics, such as lower accuracy, or it could mean there is less detail available, such as fewer local and regional breakdowns. In some cases, the production of some data series may need to be suspended. Alternatively, we may find there are advantages to using other data sources.
Decisions will be made on a case by case basis, taking into account what information is currently relevant given the situation, with the three pillars of the Code of Practice for Statistics (Trustworthiness, Quality and Value) guiding our decisions. Giving everyone access to statistics at the same time remains a fundamental principle of the Code, but where this cannot be maintained we will be open and transparent about this and any other potential effects on our statistics. These decisions will be underpinned by the Office for Statistics Regulation’s guidance on changes to statistical outputs during the coronavirus outbreak.
We will keep you informed as developments unfold. We remain committed to providing the best and most accurate information we can, serving the public good at a time when it is needed the most.
Crown Court system change
Following changes to the adminstrative systems at the Crown Court that completed in September 2019 estimates of outstanding cases, vacated trials and end-to-end timeliness at the Crown Court were not available in the Q3 2019 release.
All previously imputed or suspended estimates have been reintroduced for Q4 2019 and backdated where required.
This follows analysis to better understand the impacts of data system changes on the published measures and necessary remedial works to amend methods as detailed below.
For further information please see the Guide to Criminal Court Statistics.
-
Outstanding cases: Changes have been made to the way that the underlying data is sourced, however the methodology used to estimate this figure is consistent with the previous published series.
-
Vacated trials: Published estimates for Q2 and Q3 2019 have been included and accurately combine data from both the CREST and Xhibit systems. Data for Q4 2019 is entirely sourced from the Xhibit system and is on the same basis as the published series.
-
End-to-end timeliness: The system change has necessitated changes to the underlying record-level Crown Court data that is used as the basis for the creation of the linked timeliness data.
The analysis to review the existing file production has provided opportunities to improve the reliability of the measure, including:
-
more defendants being accurately carried through into the estimates;
-
the removal of a small number of duplicate records at the magistrates’ courts;
-
the revision of Automated Case Track Management (ATCM) cases at the magistrates’ courts to reflect data as at February 2020.
As a result of these improvements and the resources required to reproduce a back series of timeliness estimates, there is a break in series from 2018 for published timeliness estimates at the Crown Court (Tables T4, T7) and ‘All Courts’ (Tables T5, T6). Small revisions have been made to all magistrates’ courts data (Tables T1-T3), however the series remains consistent.
It is our intention to investigate the most efficient and effective way to fully backdate the series and maintain our high professional standards and ensuring that accurate, consistent series are available to all. Further updates regarding the availability of a consistent back series will be fed into the next release in June 2020.
Further information relating to the series break and the extent of the observed change can be found in the published tables and Guide to Criminal Court Statistics.
Failure to appear warrants
This is the second publication of a new series on Failure to Appear (FTA) warrants issued in magistrates’ courts. These are published as experimental statistics, developed alongside colleagues in Her Majesty’s Courts and Tribunal Service (HMCTS) in response to user demand and will be subject to further development, in line with users’ views. Supporting guidance and further information relating to the FTA collection can be found at the link below:
https://www.gov.uk/government/collections/criminal-court-statistics
Feedback is sought regarding the experimental FTA statistics and can be directed to: HMCTS_Analysis_and@Justice.gov.uk
2. Criminal cases in the magistrates’ courts
Magistrates’ courts caseload has shown small increases compared to the previous year and in line with levels seen in 2017
Magistrates’ court receipts and disposals have both increased over the last year, by 1%. The volume of outstanding cases is in line with levels seen since Q2 2016.
Figure 1: Magistrates’ courts caseload, Q2 2012 – Q4 2019 (Source: Table M1)
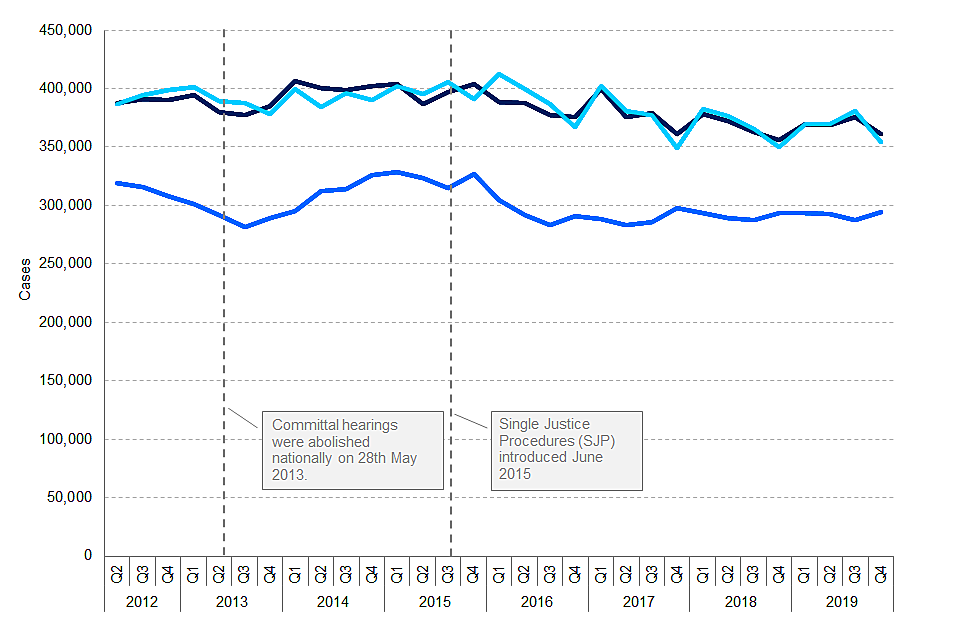
Figure 1: Magistrates’ courts caseload, Q2 2012 – Q4 2019 (Source: Table M1)
Magistrates’ court caseload
The magistrates’ court workload tended to fall between 2016 and 2018, however since a series low in Q4 2018 the volume of receipts and disposals have tended to increase. This is largely due to consistent increases in summary motoring receipts, up 9% on Q4 2018.
Quarterly receipts for ‘trial cases’ (triable-either-way and indictable cases) have fallen from a peak in Q3 2013 (109,194 cases) to a series low (72,242) in the latest quarter, down 2% on Q4 2018. This is largely due to falls seen in triable-either-way case receipts (down 3%), whereas indictable trial receipts have increased by 4% compared Q4 2018.
Trial efficiency
The total number of trials in magistrates’ courts has tended to fall since the quarterly series began in Q1 2010. In the latest quarter, there were 24,657 trials, down 14% on Q4 2018.
Of these trials, the proportion that are effective gradually increased between 2003 and 2015, after which the proportion has remained stable, ranging between 45% and 48%. The proportion of trials that were ineffective has seen the inverse of this - falling between 2003 and 2015, after which it levelled out at around 16% up to the current quarter. The proportion of trials that crack has remained stable, ranging between 37% and 39%.
3. Criminal cases in the Crown Court
The Crown Court workload has increased in 2019, with receipts and outstanding cases increasing back to levels seen in 2017.
In Q4 2019 there were 10% more receipts and 8% fewer disposals compared to Q4 2018. The volume of outstanding cases increased by 13% compared to the previous year, from 33,113 in 2018 to 37,434 in 2019.
Figure 2: Crown Court caseload, Q1 2009 – Q4 2019 (Source: Table C1)
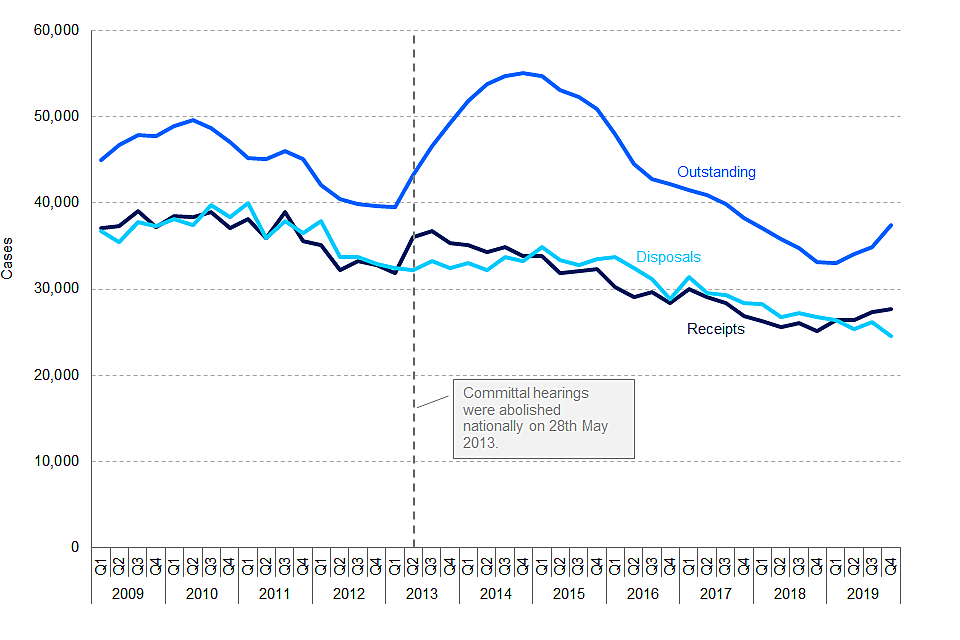
Figure 2: Crown Court caseload, Q1 2009 – Q4 2019 (Source: Table C1)
Crown court caseload (Table C1)
Compared to the previous year, the volume of cases received into the Crown Court has increased by 10% to 27,663 in Q4 2019, while disposals decreased by 8% to 24,565.
The recent growth in receipts follows an increase across 2019 in the number of indictable only cases being dealt with at the magistrates’ court.
Following the abolition of committal hearings in May 2013, triable-either-way cases could be sent from the magistrates’ courts to the Crown Court more quickly. The effect of this procedural change can be seen in the increase in receipts in Q2 2013 - which pushed receipts above disposals for around two years and saw outstanding cases increase. Since 2015 until recently, the volume of disposals has been higher than receipts and as a result outstanding cases fell, initially sharply. Case receipts and disposals have been stabilising over the past few years and are now at very similar volumes, however, since Q1 2019 receipts have consistently overtaken disposals for the first time since the end of 2014.
At the end of December 2019 there were 37,434 cases outstanding at the Crown Court, an increase of 13% on the previous year and the highest level seen since Q4 2017. The majority of the increase is due to triable-either-way cases, up 22% to 18,325 in Q4 2019.
- An annual increase in receipts for trial cases can be seen for all but one offence group (robbery). Sexual offence and drug offence receipts have increased from series lows in 2018, rising by 20% and 26% respectively when compared to Q4 2018 but well below series peaks.
Figure 3a: Receipts for trial cases by selected offence group, Q1 2010 – Q4 2019 (Source: cc_rdos_tool)
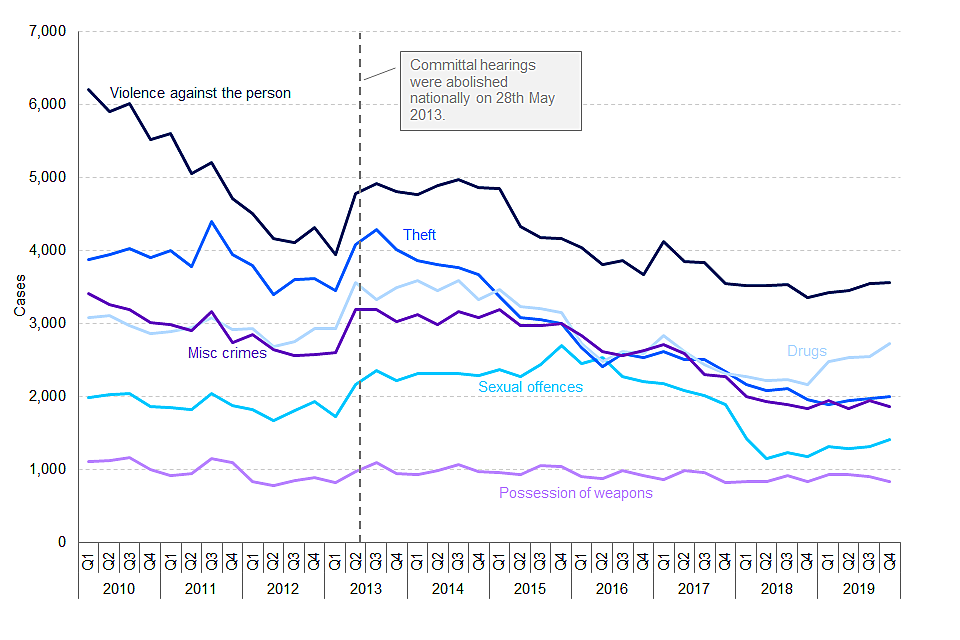
Figure 3a: Receipts for trial cases by selected offence group, Q1 2010 – Q4 2019 (Source: cc_rdos_tool)
Figure 3b: Disposals for trial cases by selected offence group, Q1 2010 – Q4 2019 (Source: cc_rdos_tool)
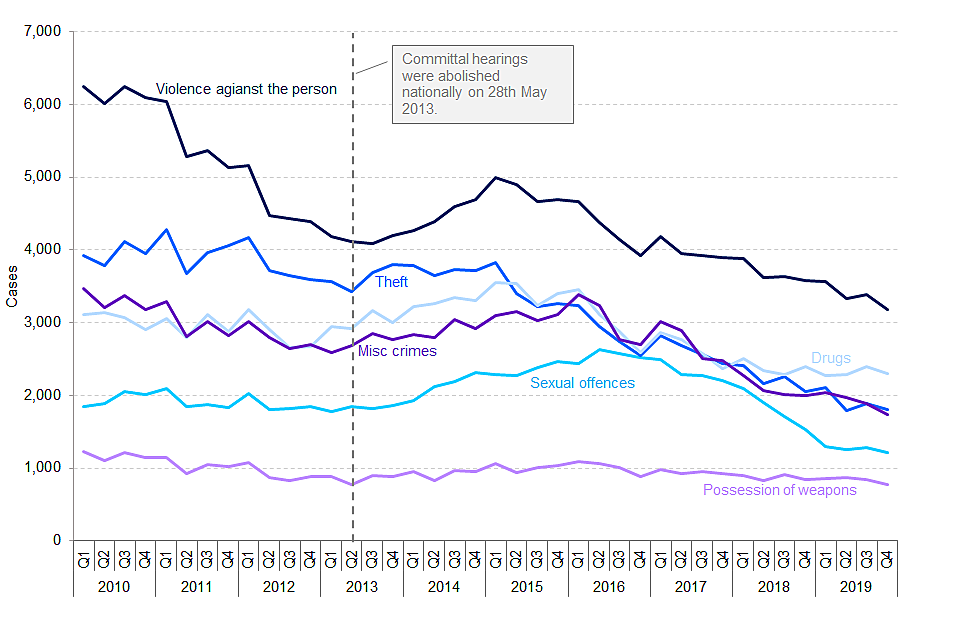
Figure 3: Disposals for trial cases by selected offence group, Q1 2010 – Q4 2019 (Source: cc_rdos_tool)
-
Conversely, an annual decrease in trial case disposals can be seen for the majority of offence groups, with the largest absolute falls seen in violence against the person and sexual offences. There is some expected ‘lag’ in the system as cases take time to reach disposal following receipt. This is evident for violence against the person and sexual offence case trends where an increase in receipts is followed by a more gradual, steady rise in disposals over a longer period as cases complete.
-
An annual increase in outstanding trial cases can be seen across all offence groups to varying degrees, with the largest rise seen for drug offences which increased by 32% (from 3,419 in Q4 2018 to 4,511 in Q4 2019). Violence against the person offences continued to be the largest offence group, accounting for 25% of all outstanding trial cases.
Trial efficiency
The proportion of both effective and cracked trials fell when compared to the previous year, down to 48% and 33% respectively. As a result, the proportion of ineffective trials at the Crown Court increased by 6 percentage points to reach a series peak of 19% in Q4 2019.
The increase in ineffective trials is largely due to the courts ‘overlisting cases’ to ensure that if court time becomes available it is filled (e.g. ‘Overlisting (insufficient cases drop out/floater/backer not reached)’). This increased from 161 in Q4 2018 to 265 in Q4 2019 - accounting for 26% of all ineffective trials in Q4 2019.
As the volume of ineffective trials has increased (up 17%) the number of vacated trials has tended to fall, down 19% on the previous year (from 3,367 to 2,741).
Guilty plea rates
For defendants dealt with in trial cases at the Crown Court, the guilty plea rate[footnote 1] remained broadly in line with that seen in the previous year at 68%.
-
Of those entering a guilty plea, the majority continue to enter a plea ‘prior to trial’ (63%), in line with proportions seen over the last three years.
-
Where entering a guilty plea before trial, close to three-quarters enter a plea after one hearing (72%) – this has increased by 5 percentage points compared to the previous year and is the highest proportion seen since Q2 2010.
The largest increase (9 percentage point) in guilty plea rate was seen for sexual offences, up to 43% in Q3 2019, however it remains the offence group with the lowest guilty plea rate.
Average waiting and hearing time at the Crown Court
Overall, the median average waiting time[footnote 2] for defendants at the Crown Court continued to fall, reaching a series low of 5.4 weeks in Q3 2019 and 5.7 weeks in Q4 2019. This is a decrease of 13% compared to the same quarter in 2018 (6.6 weeks) and has more than halved since the series peak in Q2 2015 (13.0 weeks).
The median waiting time for defendants dealt with in trial cases has decreased by 16% to 12.4 weeks compared to the previous year.
-
Decreases in waiting times can be seen across most offence groups compared to the previous year, particularly for ‘miscellaneous crimes against society’ (down 50%), ‘public order offences’ (down 36%) and ‘drug offences’ (down 32%).
-
Sexual offences (22.4 weeks), fraud offences (21.1) and violence against the person (19.7) continued to have the highest trial waiting times.
The median hearing time[footnote 3] for trial cases has remained stable at around 1.3 hours. The average hearing time has changed very little across the series, ranging from 0.9 to 1.5 hours across the series. For trials where a not guilty plea was entered, the median hearing time has remained stable at around 8 hours, this follows steady increases between 2010 and 2016.
4. Timeliness
For cases completing at the magistrates’ court, the average number of days from offence to completion increased due to increases from offence to charge.
In Q4 2019, the median number of days from offence to completion for cases completing at the magistrates’ courts (excluding those sent to the Crown Court) was 168 days, up 11% on the previous year (152 days).
End to end timeliness data is created by matching magistrates’ courts and Crown Court records to estimate the time taken from the date an alleged offence was committed to the date of a final decision at court.
The increase in offence to completion for cases completing at the magistrates’ courts can be attributed largely to increases in time spent prior to reaching court – with offence to charge/first listing increasing by 14%. The average time spent at court remained broadly stable with 74% of cases completing at the first hearing.
Figure 4: Average number of days from offence to completion for cases completing at the magistrates’ courts (excluding committals) by stage, Q2 2010 – Q4 2019 (Source: Table T3)
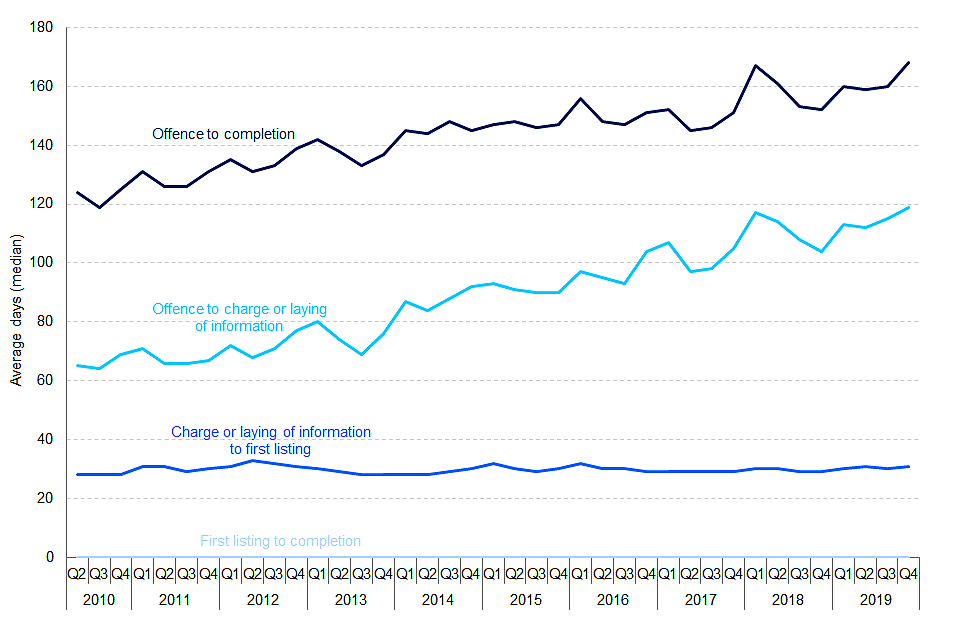
Figure 4: Average number of days from offence to completion for cases completing at the magistrates’ courts (excluding committals) by stage, Q2 2010 – Q4 2019 (Source: Table T3)
Introduced in June 2015 under the Criminal Justice and Courts Act 2015, Single Justice Procedure (SJP) notices allow cases involving adults charged with summary offences to be dealt with in a single magistrates’ sitting without a prosecutor or defendant being present.
The number of SJP cases have increased each year since implementation in 2015 and levelled off since Q3 2018 at around 59% of all completions at the magistrates’ courts. The median time taken from offence to completion for SJP cases in Q4 2019 increased by 6% compared to the previous year, due in part to a 7% increase in time from offence to charge/first listing.
For cases completing at the Crown Court, the average number of days from offence to completion increased due to increases from offence to charge.
In Q4 2019, the median number of days from offence to completion for cases completing at the Crown Court was 275 days, up 7% on the previous year (256 days).
‘Pre-court’ time refers to the duration in days from committing an offence to the first listing of a case in court – therefore it includes the period before the offence is reported to and recorded by the police/authority. Across all cases dealt with at the Crown Court, the median time spent ‘pre-court’ increased by 46% in the latest quarter (to 115 days) compared to the previous year (79 days).
The increase in ‘pre-court’ time was true for all but one offence group (fraud) when compared to the previous year. The largest increase was seen for sexual offences, with average ‘pre-court’ time increased by over 100 days (from 318 days in Q4 2018 to 421 days in Q4 2019).
The time taken for police to reach a charge/summons outcome has increased[footnote 4], however more historical offences being dealt with at court has been an important factor in the increase in ‘pre-court’ time.
Figure 5: Average number of days from offence to completion for cases completing at the Crown Court by stage, Q2 2010 – Q4 2019 (Source: Table T4)
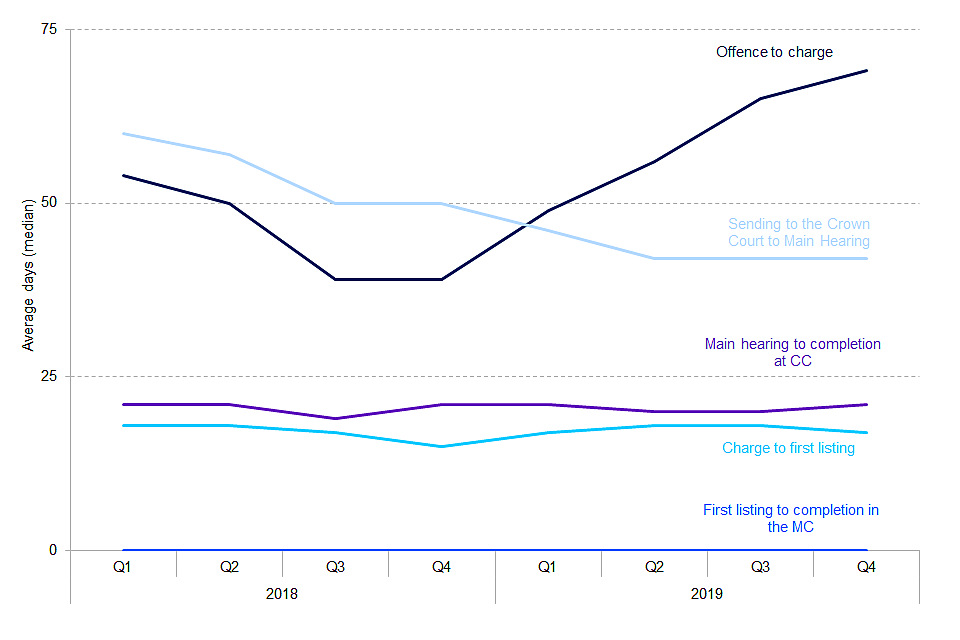
Figure 5: Average number of days from offence to completion for cases completing at the Crown Court by stage, Q2 2010 – Q4 2019 (Source: Table T4)
‘At court’ time refers to the duration in days from the first listing of a case at the magistrates’ courts through to it’s completion at the Crown Court regardless of the outcome (e.g. includes both acquittals and convictions).
In the latest quarter, the median number of days taken from first listing in the magistrates’ court to completion in the Crown Court (‘at court’) was 126 days, a decrease of 12% compared to the same quarter in the previous year (143 days).
- This fall can be attributed to a reduction in the time taken from ‘sending to the Crown Court to the main hearing’, decreasing 16% from 50 to 42 days since Q4 2018.
5. Enforcement of financial impositions
Total financial impositions fell slightly in Q4 2019
Total financial impositions increased by 8% in Q4 2019 to £155.6m compared with the previous year – this is due to an 11% increase in fines. The total value of outstanding financial impositions continued to rise, reaching £1.21 billion in Q4 2019.
Figure 6: HMCTS management information: Financial impositions by imposition type, England and Wales, Q2 2011 – Q4 2019 (Source: Table A2)
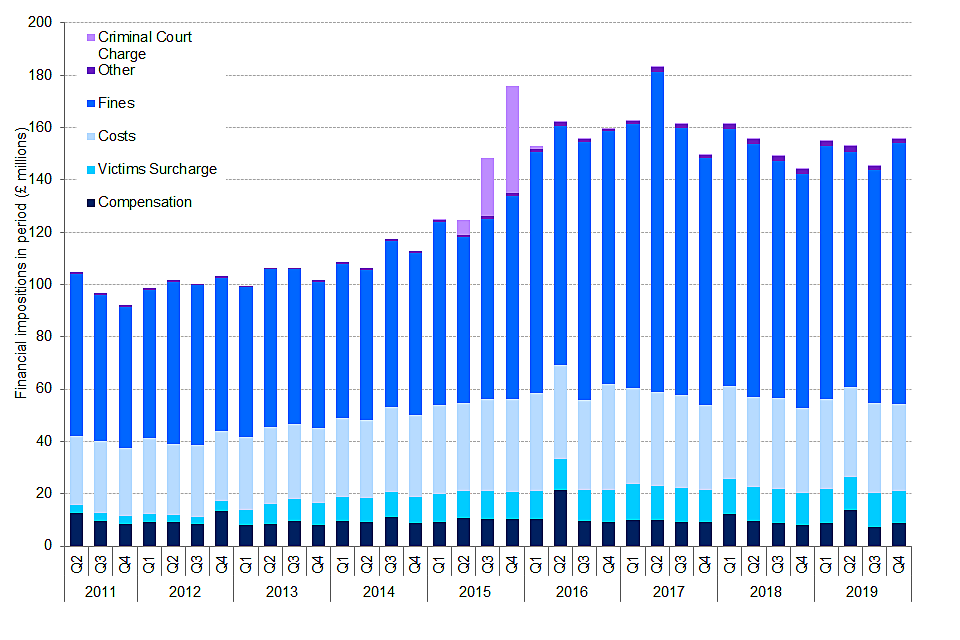
Figure 6: HMCTS management information: Financial impositions by imposition type, England and Wales, Q2 2011 – Q4 2019 (Source: Table A2)
Financial impositions and amounts paid by imposition type
The overall value of impositions increased by around £11.4m on the previous year due largely to increases in fines:
- The value of total fines imposed jumped by £10.2m, up 11% compared to the previous year.
Financial impositions for compensation, victim surcharge and costs all showed modest increases of 5%, 2% and 3% respectively compared to the previous year.
Outstanding financial impositions
In Q4 2019, the total value of financial impositions outstanding in England and Wales was £1.21 billion, up 10% on the previous year and 1% on the previous quarter.
The amount of outstanding financial impositions has doubled since the start of 2015 (£571m). A change in policy regarding the collection of financial impositions is partially behind this cumulative increase – unpaid accounts are no longer routinely closed and therefore, more outstanding impositions are carried over from previous periods.
6. Experimental Statistics – language interpreter and translation services
The number of completed language service requests has increased and the success rate[footnote 6] remained broadly stable[footnote 7]
The success rate of requests remained stable at 97%, whereas the number of completed language service requests has increased by 8% compared to Q4 2018.
Completed service requests
The overall number of requests in Q4 2019 (42,436) has increased by 8% since Q4 2018, maintaining higher levels seen during 2019, following the highest volume of quarterly completed requests under the new contract in Q4 2019 (since Q4 2016).
Criminal court requests continue to account for the largest proportion of completed language service requests (42% in Q4 2019). There have been increases in completed requests for all requester types: criminal (9%), civil and family (9%) and tribunals (2%) completed requests compared to Q4 2018.
Figure 7: Number of completed language service requests and overall success rate, Q1 2013 – Q4 2019 (Source: Table L1)
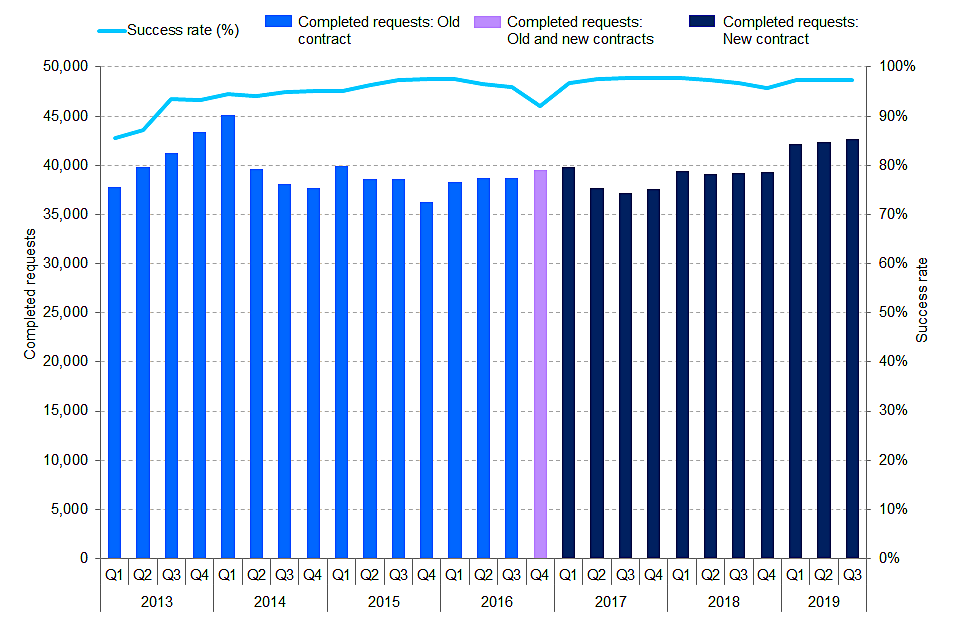
Figure 7: Number of completed language service requests and overall success rate, Q1 2013 – Q4 2019 (Source: Table L1)
Success rate
The overall success rate of requests has remained broadly stable since 2017, at 97%. The success rate for non-DPSI[footnote 8] languages has remained the lowest of all service types since Q4 2016 and in Q4 2019 it was 86%, compared to 98% for standard languages and 95% for special services.
Complaints and complaint rate
The number of complaints (456) has increased compared to Q4 2018 (343) but is down on the previous quarter (507). Despite the increase in the number of complaints, the complaint rate remained stable at 1%.
Tribunals continue to be the largest contributing requester type receiving complaints (44%) despite only accounting for 29% of total service requests in Q4 2019.
In Q4 2019, ‘no interpreter available’ was the largest complaint category, accounting for 33% of complaints, followed by ‘operational issues’ (25%) and ‘interpreter did not attend’ (15%).
‘Off-contract’ requests
The number of off-contract requests in Q4 2019 (684) decreased, down 12% compared to the same quarter of the previous year (709). This fall follows the highest level of ‘off-contract’ requests in the previous quarter since the introduction of the new contract in Q3 2019.
Just under two thirds (63%) of ‘off contract’ requests were made by tribunal courts. The changing trend over the last year continues to be mostly attributed to the changes in the number of requests involving immigration tribunals.
Figure 8: Completed ‘off-contract’[footnote 9] language service requests by requestor type, Q1 2014 – Q4 2019 (Source: Table L3)
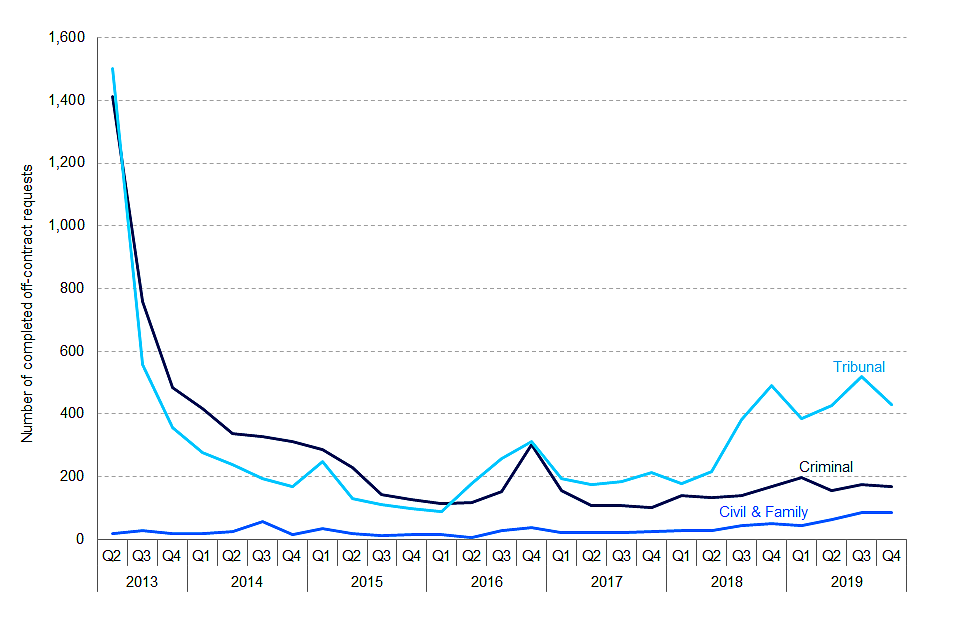
Figure 8: Completed ‘off-contract’9 language service requests by requestor type, Q1 2014 – Q4 2019 (Source: Table L3)
Further information on criminal courts data
The latest data presented in this publication are provisional. Final data for each calendar year is published in June, following further data cleaning and the incorporation of additional cases not available in our original extracts.
Accompanying files
As well as the bulletin, the following products are published as part of this release:
-
Two technical guides providing background information and standalone quality guide.
-
A set of overview tables, covering each section of this bulletin.
-
Pivot tools and underlying data which feature further breakdowns of published data.
National Statistics status
National Statistics status means that official statistics meet the highest standards of trustworthiness, quality and public value. This bulletin recently underwent a compliance check with the Office for Statistics Regulation and retained its National Statistics status in January 2019[footnote 10]. All official statistics should comply with all aspects of the Code of Practice for Statistics. They are awarded National Statistics status following an assessment by the Authority’s regulatory arm which considers whether the statistics meet the highest standards of Code compliance, including the value they add to public decisions and debate. It is the Ministry of Justice’s responsibility to maintain compliance with the standards expected for National Statistics. If we become concerned about whether these statistics are still meeting the appropriate standards, we will discuss any concerns with the Authority promptly. National Statistics status can be removed at any point when the highest standards are not maintained, and reinstated when standards are restored.
Experimental Statistics status
Experimental statistics are produced under the remit of the Code of Practice for Statistics. They are also produced impartially and are free from political influence[footnote 11].
Contact
Press enquiries should be directed to the Ministry of Justice press office:
Tel: 020 3334 3536
Email: newsdesk@justice.gsi.gov.uk
Other enquiries about these statistics should be directed to the Justice Statistics Analytical Services division of the Ministry of Justice:
Damon Wingfield, Responsible Statistician and Head of Criminal Justice System Statistics
Ministry of Justice, 3rd Floor, 10 South Colonnade, London, E14 4PU
Email: statistics.enquiries@justice.gsi.gov.uk
Next update: 25th June 2020
URL: https://www.gov.uk/government/statistics/criminal-justice-system-statistics-quarterly-december-2018
© Crown copyright Produced by the Ministry of Justice
Alternative formats are available on request from statistics.enquiries@justice.gsi.gov.uk
-
Guilty plea rate is the number of defendants pleading guilty to all counts as a proportion of all those with a plea. ↩
-
The waiting time is the duration in weeks between a case being committed to the court and the first main hearing. A value is determined for each defendant dealt with during the period and averages calculated. ↩
-
The average hearing time is calculated as the total sum of all hearings in all cases divided by the number of cases - this represents the average time of all hearings combined in a case rather than a single hearing. ↩
-
https://www.gov.uk/government/collections/crime-outcomes-in-england-and-wales-statistics ↩
-
The statistics under the new contracts are ‘Experimental Statistics’ – the series remains in the testing phase and is not yet fully developed. ↩
-
The number of requests that were fulfilled divided by the total fulfilled and unfulfilled (excludes cancellations). ↩
-
These figures relate to the ‘new contract’, comprising of data from two separate suppliers, thebigword Group Ltd for face to face interpretation and Clarion UK Ltd for non-spoken languages (special services). ↩
-
The Diploma in Public Service Interpreting (DPSI) is a standard qualification required of interpreter; languages covered by it are termed ‘Standard’ languages. Those not covered in the DPSI require separate qualifications and are termed ‘non-DPSI’ languages. ↩
-
‘Off-contract’ request are language service requests fulfilled directly by the Ministry of Justice out of or ‘off’ the language service contracts currently in place. This occurs when a contractor (thebigword group Ltd or Clarion UK Ltd) has been unable to fulfil a booking. As the process for recording off-contract requests has not changed between contracts, they remain official statistics and are not experimental. ↩
-
https://www.statisticsauthority.gov.uk/correspondence/compliance-check-on-court-statistics/ ↩
-
https://www.statisticsauthority.gov.uk/monitoring-and-assessment/code-of-practice/ ↩