Crime outcomes in England and Wales 2020 to 2021
Published 22 July 2021
Applies to England and Wales

© Crown copyright 2021
This publication is licensed under the terms of the Open Government Licence v3.0 except where otherwise stated. To view this licence, visit nationalarchives.gov.uk/doc/open-government-licence/version/3 or write to the Information Policy Team, The National Archives, Kew, London TW9 4DU, or email: psi@nationalarchives.gov.uk.
Where we have identified any third party copyright information you will need to obtain permission from the copyright holders concerned.
This publication is available at https://www.gov.uk/government/statistics/crime-outcomes-in-england-and-wales-2020-to-2021/crime-outcomes-in-england-and-wales-2020-to-2021
Frequency of release: Annual
Forthcoming release: Research and statistics
Home Office responsible statistician: John Flatley
Press enquires: pressoffice@homeoffice.gov.uk
020 7035 3535
Public enquires: crimeandpolicestats@homeoffice.gov.uk
Crime Outcomes, England and Wales, Year ending March 2021
This bulletin reports on case outcomes that police forces have assigned to notifiable offences recorded by the police in England and Wales between 1st April 2020 and 31st March 2021.
Key results
Police recorded crime figures for the year ending March 2021 have been significantly affected by the coronavirus (COVID-19) pandemic. Across the whole year ending year March 2021, there was a 13% fall in total police recorded crime (excluding fraud). The scale of reduction varied by crime type with the largest falls seen in theft (down 32%) with smaller falls in sexual offences (down 10%) and no change in violence against the person offences (0%). There was a large increase in drug offences 13% compared with the previous year.
The suppression of normal crime levels makes meaningful comparisons with the previous 12-month period challenging.
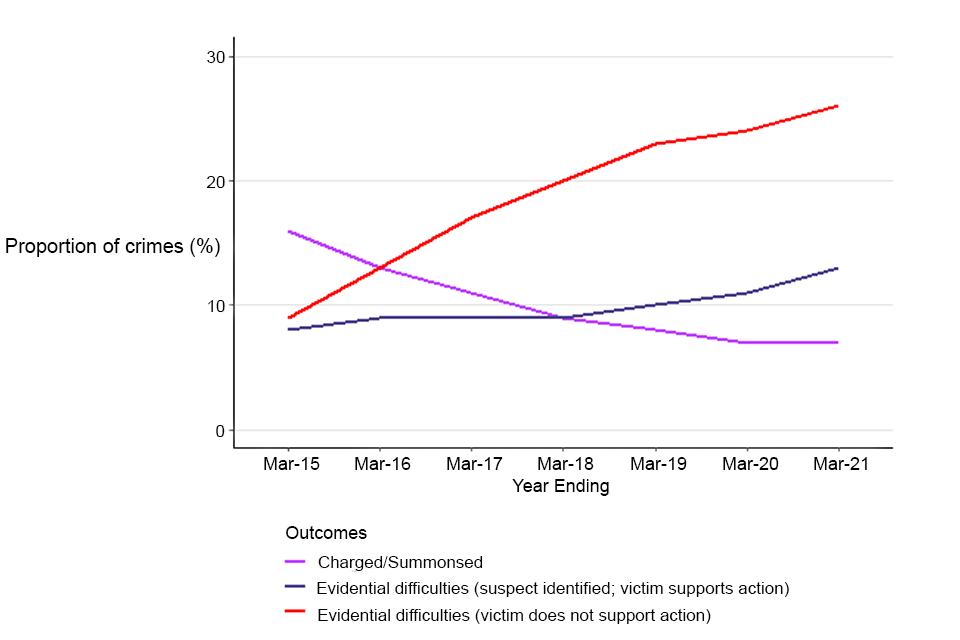
Compared with the previous year, the proportion of crimes recorded during year ending March 2021 that resulted in a charge and or summons in the same year stayed broadly the same (7%). This halted a previous downward trend seen since the year ending March 2015 when 16% of crimes were resolved with a charge and or summons. The proportion of offences that were closed as a result of “evidential difficulties” increased from 35% to 40%, compared with the previous year. This continued the rising proportion of crimes closed with this outcome which has been on the increase since year ending March 2015 (when it was 17%). These trends are likely to reflect improved crime recording processes as well as a more complex crime caseload being dealt with by the police.
Proportion of crimes resulting in charged and or summons or evidential difficulties outcome, year end March 2015 – March 2021, England and Wales.
Executive Summary
Overview
This bulletin is based on the full police recorded crime outcomes framework introduced in April 2014. Under this framework, every notifiable crime recorded by the police will be assigned a case outcome including those still under investigation. The data presented in this report provide a snapshot, at the time of analysis, of the current case status of offences recorded during year ending March 2021. The outcomes of some cases, especially those recorded towards the end of the financial year, may be subsequently revised as investigations are completed or fresh lines of enquiry become available. Data covers all those offences recorded in England and Wales by the territorial police forces (except Greater Manchester Police who have been unable to provide data from July 2019 to December 2019) and the British Transport Police.
Key Findings
-
the number of crimes recorded by the police decreased during the pandemic compared with the previous year (down 10%) and volume of outcomes assigned (down by 14%)
-
compared with the previous year, the proportion of crimes resulting in a charge and or summons stayed broadly the same; this halted a previous downward trend seen since the introduction of the Outcomes framework in year ending March 2015, when 16% of crimes were resolved with a charge and or summons
-
during the pandemic, there were increases in the proportion of cases closed with out of court disposals; this was more evident for informal (up from 2.4% to 3.0%) than formal out of court disposals (up from 1.3% to 1.4%)
-
the proportion of offences that were closed as a result of “evidential difficulties” increased from 35% to 40% compared with the previous year; this was a continuation of previous trends, with increases in the proportion of cases closed this way having risen from 17% in the year ending March 2015; these trends are likely to reflect improved crime recording processes by the police and a more complex crime caseload; in the most recent year, a lengthening of the criminal justice process as a result of the Covid-19 pandemic has been suggested [footnote 1] as a reason why more victims have been withdrawing from cases
-
Police forces closed just over a third (36%) of offences with no suspect identified, around 7 percentage points lower than last year; this fall was driven by a large reduction in the volume of theft (down 32%) and, to a lesser degree, criminal damage and arson offences (down 15%); these offence groups account for the majority of all crimes closed with this outcome; for example: 74% of theft and 60% of criminal damage and arson offences closed in this way
As in previous years, the length of time it took police forces to assign an investigative outcome to a crime varied by both the type of offence and the type of outcome.
-
overall, an (median) average of 11 days was taken from the date the crime was recorded to assign the outcome, this was an increase of 1 day compared with the previous year; the median days for an outcome to be assigned has increased for the last 4 years, up from 6 days in March 2018; there are likely to be a range of factors behind the rise including an increasing volume of offences and complexity of caseloads being dealt with by the police
-
for the charge outcome, the median days rose from 33 days in March 2020 to 43 days in March 2021; this rose across all offence groups but was highest for sexual offences, (which increased by 53 days to 286), followed by robbery (up by 17 days to 86 days) and then violence against the person (up by 12 days to 46 days)
-
for rape offences, the median days to charge and or summons increased by 70 days to 465 days; there was also a rise in the median day to close rape cases with evidential difficulties (suspect identified; victim supports action) by 9 days; the effect of pandemic is likely to be factor in these increases as indicated in a recent HMICFRS report that ‘Police forces delayed sending some cases to the CPS because they were unable to obtain relevant information from other agencies; for example, in some domestic abuse cases, the police were unable to obtain paperwork from family law courts; one force told us that several cases were put on hold for over three months[footnote 2]
-
theft offences and criminal damage and arson continued to take the fewest number of days to be assigned an outcome (median of 3 and 4 days respectively); the time taken to assign an outcome decreased by a day for theft offences and stayed the same for criminal damage and arson compared with the previous year; this reflected the high proportion of such offences which were closed without a suspect being identified
-
the median length of time for investigations to be closed with no suspect identified for all offences was 2 days, one less than the previous year.
1 Introduction
Overview
This bulletin reports on investigative case outcomes that have been assigned to notifiable offences recorded by the police in England and Wales. It covers all territorial police forces, except Greater Manchester Police who have not been able to provide outcomes data to the Home Office for July 2019 to March 2020, and the British Transport Police. In April 2013, the Home Office introduced the new crime outcomes framework, replacing a more narrow focused one based on ‘detections’. This new framework provides greater transparency on how all notifiable crimes recorded by the police are dealt with. The previous ‘detections’ framework gave only a partial picture of the work police do to investigate and resolve such crimes. A narrow focus on “detections” was previously linked to police performance targets. This was thought to have risked driving perverse crime recording decisions[footnote 3]. It may also have undermined the victim-focused approach set out in the National Crime Recording Standard.[footnote 4] As well as this annual publication, the Home Office also publishes quarterly outcomes tables without commentary. These are published at the Crime outcomes in England and Wales statistics collection. For more detailed background on the outcomes framework and how it was developed, see Annex A6: Crime Outcomes Data Quality.
The Full Outcomes Framework
Since its introduction in April 2014, the framework has developed to cover a broader range of outcome types for police forces to use. Detailed descriptions of each outcome type can be found in the Technical Annex. The data presented in this report provide a snapshot, at the time of analysis, of the current case status of offences recorded during year ending March 2021. The outcomes of some cases, especially those recorded towards the end of the financial year, may be subsequently revised once investigations have been completed or new lines of enquiry open. While all crimes will eventually have an outcome, this may take considerable time for some offences. At any given point, police forces will be undertaking crime investigations to which they will not yet have assigned a final outcome. Police forces will therefore submit revised data to the Home Office as investigations are completed and some data previously published will be revised in subsequent releases.
Outcome Groupings in this Bulletin
Some of the tables and charts in this bulletin show grouped outcomes to simplify presentation. For transparency, Open Data tables are also published that show the full range of police outcomes. These are accessible from the Police recorded crime and outcomes open data tables.
For statistical purposes, all recorded crimes are assigned one outcome type please refer to General Rules Section H of the Home Office Counting Rules for information on recording outcomes.
Table 1.1 shows the grouping of outcomes used in this report. These take account of user feedback following a consultation in 2014.
Table 1.1: Grouping the Outcomes Framework from April 2013 Onwards (Outcomes 1-22)
| Outcome Group | Outcome Types |
|---|---|
| charged and or summonsed | 1 |
| Taken into consideration | 4 |
| Out-of-court (formal) | 2, 3, 6 |
| Out-of-court (informal) | 7, 8 |
| Prosecution prevented or not in the public interest | 5, 9, 10, 11, 12, 13, 17 |
| Evidential difficulties (suspect identified; victim supports action) | 15 |
| Evidential difficulties (victim does not support action) | 14, 16 |
| Investigation complete – no suspect identified | 18 |
| Action undertaken by another body/agency (from April 2015) | 20 |
| Further investigation to support formal action not in the public interest (police decision) (from January 2016) | 21 |
| Diversionary, educational or intervention activity, resulting from the crime report, has been undertaken and it is not in the public interest to take any further action (voluntary from April 2019) | 22 |
Note: outcome 19 not shown as this applies to fraud offences recorded by the National Fraud Intelligence Bureau only which are reported on separately (see section 4).
See technical annex A6.5 for detailed descriptions of each outcome type.
Supplementary Data Tables
The chapters in this bulletin discuss key topics of interest in the outcomes data. Data presented in these chapters as both charts and tables are available online via bulletin tables published on the Home Office website.
In addition to the tables found in a main bulletin, a number of supplementary tables are available here which provide additional data on the topics discussed, plus data on areas not covered. Data on transferred and cancelled records, and “old-style” outcomes are also published.
Outcomes for Offences Recorded in Quarter (New Style)
This is the principle method used to present data in this bulletin; it looks at outcomes for offences recorded in the same period (referred to as “Recorded in Quarter” in linked data tables) in which the offence was recorded. It allows the distribution of outcomes to be shown for individual crimes that were recorded and given an outcome in the same time period. However, as some crime types take longer to investigate than others the final outcome may not be available for a proportion of offences at the time of the first release of data for a given time period.
Outcomes Recorded in Quarter (Old Style)
This measure relates to outcomes recorded in a particular year regardless of when the associated crime was recorded, that is it will include outcomes for cases recorded in a previous year. Ratios can be calculated showing the number of outcomes recorded in the year as a proportion of all crimes recorded in the same year. This is how rates were presented before it was possible to link individual crimes with their outcomes.
This approach provides a fuller measure of police activity in relation to crime in a given year. However, comparing the number of outcomes with the number of recorded offences in this way should be done with caution since rates could appear to change from one year simply because of a changing balance between crimes and outcomes recorded over time. For example, some crime types could show a rate of over 100 per cent against a particular outcome, which is sometimes the case for relatively low volume crimes.
Data Availability
Due to issues following a migration to a new force crime record management system, Greater Manchester Police (GMP) have been unable to provide the Home Office with crime and outcome data for July 2019 to March 2020. Therefore, all results in this bulletin exclude GMP as like for like comparisons cannot be made between year ending March 2020 and year ending March 2021.
2 Outcomes assigned to offences (excluding Fraud and Computer Misuse Act offences) recorded in the year ending 31st March 2021
Key Changes
-
the number of recorded crimes resolved via a charge and or summons fell by 35,705 (from 350,863 to 315,158, a 10% fall); the represented 7% of crimes recorded in the same period, the same level as the previous year and halting the downward trend since the year ending March 2015 (when the comparable figure was 16%)
-
the proportion of investigations closed where the victim did not support further action rose from 24% the previous year to 26% in the latest one
-
the most common reason for a case being closed was due to no suspect being identified, in 36% of crimes recorded over the past year; this is lower than the previous year (43% in March 2020) and reflects the changing crime mix as a result of the pandemic; theft and criminal damage and arson account for the majority of cases closed with this outcome, these offences fell during the pandemic by 32% and 16% respectively
-
theft and criminal damage and arson cases also had the smallest proportion of offences not assigned an outcome within the same year (4.6% and 4.5% respectively); the large fall in the volume of such offences recorded has driven the slight rise in the proportion of all offences not assigned an outcome at the year-end (up from 7% last year to 8% this year)
This chapter covers how the police have dealt with crimes recorded in the year ending March 2021. It should be noted that not all offences recorded in that year had been assigned an outcome at the time this analysis was undertaken. A complete picture of how crimes have been resolved by the police will become available in updated tables which are published on a quarterly basis. This results in the proportions of offences in outcome groups changing. For example, the proportion of offences in the Year to March 2020 receiving an outcome of charged and or summonsed was 7% when first published in July 2020 but the latest update shows this has increased to 8%. However, to allow like for like comparisons in this bulletin we report on trend data as first published.
Since April 2011 the recording of fraud and computer misuse act (CMA) offences has been centralised via Action Fraud (the UK’s national fraud and cyber-crime reporting centre) and managed by the National Fraud Intelligence Bureau (NFIB) at the City of London Police. The analysis presented in Chapters 2 and 3 is restricted to those offences initially recorded by the territorial forces and BTP and therefore exclude fraud and CMA offences. From the data supplied to the Home Office by the NFIB, it is not currently possible to link individual outcomes to offences at record level. Therefore, the outcomes shown in Chapter 4 are presented on an “old style” basis and not directly comparable with other offences.
When comparing crime outcomes data over time it is important to consider the broader context. Police recorded crime figures for the year ending March 2021 have been significantly affected by the coronavirus (COVID-19) pandemic. Across the whole year ending year to March 2021, there was a 13% fall in total PRC (down from 5.0 million in the previous year to 4.3 million offences) excluding fraud. The reductions in PRC were driven by falls in acquisitive crimes such as burglary, theft of and from vehicle offences and shoplifting. These falls were most marked in the April to June 2020 quarter with for example (compared with April to June 2019) burglary down 36%, vehicles offences down 37% and shoplifting by 52%.
The suppression of normal crime levels makes meaningful comparisons with the previous 12-month period challenging as the crime mix in year ending March 2021 differs from the previous year.
Just under 3 out of 10 of all police recorded crimes (excluding fraud) in the latest year comprised theft offences (28%) down from 36% in the previous year. This was mainly driven by changes in levels of crime due to the pandemic. In contrast, the proportion of all crimes recorded as violence against the person (up from 33% to 39%) and drug offences (up from 3% to 5%) rose during the last year.
Furthermore, in 2014, HM Inspectorate of Constabulary Fire and Rescue Services (HMICFRS) published a critical report on crime recording which revealed significant under-recording of crimes that had been reported by victims to the police. This has been followed by a programme of rolling inspections of forces to examine compliance with the Home Office’s National Crime Recording Standards. This has led to improved compliance and increased caseloads as more reports of crimes are (correctly) recorded than in previous years. The HMICFRS has estimated in their recent State of Policing report that, compared with their findings from their 2014 inspection, better compliance with recording standards meant police forces recorded around 570,000 more crimes during 2019.
In addition to improvements in recording, the Office for National Statistics has commented that some of the increases in recorded crime are likely to reflect genuine changes in society. These include more criminality and a greater willingness of some victims to come forward to report crimes to the police than has happened in the past. As a result, since 2013/14 the volume of the crime caseload being dealt with by the police has grown. In addition, the crime mix has also changed with rising proportions of more complex offences like sexual abuse, child abuse and domestic abuse. The increasing volume of digital evidence (which may require more intensive work to investigate) across a wide spectrum of offences from harassment to sexual offences is also thought to have added to the investigative demands on the police. There is also evidence to suggest that the pandemic has disrupted investigative processes and makes for additional difficulties in comparing the distribution of outcomes this year compared with previous ones.
In recent years, it has been reported that forces have sought to manage demand and this may be reflected in forces adopting local policies to prioritise the use of investigative resources. These factors are likely to have an impact on the distribution of outcomes over time and across forces.
Variation in how Cases were Closed by Outcome Type
Table 2.1 summarises outcomes given to all crimes recorded in the year to March 2021 at the time that data was finalised for analysis (June 2021). It also shows how this compares with outcomes given to crimes recorded in the previous year. For comparability, we present outcomes for the year to March 2020 as they appeared when first published in July 2020 [footnote 5]. Some of the key points (see figure 2.1 and table 2.2) were:
-
as in previous years, the most common reason for a case being closed was no suspect having been identified; however, the proportion of all cases closed in this way fell from 43% in March 2020 to 36% in March 2021 which is likely to reflect the changing crime mix as a result of the pandemic
-
The number of charge and or summons fell from 350,863 to 315,158, but the proportion rose slightly from 7% to 7.3%; this halted a downward trend that started in the year ending March 2015, when the comparable proportion was 15.5%
-
during the pandemic, there were increases in the proportion of cases closed with out of court disposals; this was more evident for informal (up from 2.4% to 3.0%) than formal out of court disposals (up from 1.3% to 1.4%)
-
there were increases in the proportion of cases closed due to evidential difficulties; for those where the victim supported action and a suspect was identified this increased from 11% to 13%
-
for cases closed due to evidential difficulties where the victim did not support further action, the proportion increased from 24% to 26%; this was driven by an increase where a suspect was identified (which rose from 20% to 22%); in contrast, the proportion of offences closed where the suspect was not identified remained the same (5%); a recent report Impact of the pandemic on the Criminal Justice System suggested that victims were withdrawing from investigations due to the lengthening of the criminal justice process due to disruption caused by the Covid-19 pandemic
-
theft and criminal damage and arson cases also had the smallest proportion of offences not assigned an outcome within the same year (4.6% and 4.5% respectively); the large fall in the volume of such offences recorded has driven the slight rise in the proportion of all offences not assigned an outcome at the year-end (up from 7% last year to 8% this year)
Table 2.1: Outcomes assigned to offences recorded in the year ending March 2020 and March 2021 (as first published), by outcome type and group, England and Wales
| Outcome number | Outcome type/group | Volume year to March 2020 (2,3) | Volume year to March 2021 (2,3,4) | % Year to March 2020 (2,3) | % Year to March 2021 (3,4) |
|---|---|---|---|---|---|
| 1 | Charged and or summonses | 350,863 | 315,158 | 7.0% | 7.3% |
| 4 | Taken into consideration5 | 3,747 | 1,829 | 0.1% | 0.0% |
| Out-of-court (formal) | 65,207 | 61,911 | 1.3% | 1.4% | |
| 2 | Caution - youths | 6,940 | 5,350 | 0.1% | 0.1% |
| 3 | Caution - adults | 47,555 | 44,368 | 1.0% | 1.0% |
| 6 | Penalty Notices for Disorder | 10,712 | 12,193 | 0.2% | 0.3% |
| Out-of-court (informal) | 119,990 | 130,715 | 2.4% | 3.0% | |
| 7 | Cannabis/Khat warning | 16,521 | 14,010 | 0.3% | 0.3% |
| 8 | Community resolution | 103,469 | 116,705 | 2.1% | 2.7% |
| Prosecution prevented or not in the public interest | 74,399 | 66,133 | 1.5% | 1.5% | |
| 5 | Offender died | 1,057 | 1,003 | 0.0% | 0.0% |
| 9 | Not in public interest (CPS) | 1,749 | 1,930 | 0.0% | 0.0% |
| 10 | Not in public interest (Police) | 31,187 | 28,627 | 0.6% | 0.7% |
| 11 | Prosecution prevented - suspect under age | 6,975 | 5,895 | 0.1% | 0.1% |
| 12 | Prosecution prevented - suspect too ill | 12,676 | 14,381 | 0.3% | 0.3% |
| 13 | Prosecution prevented - victim/key witness dead/too ill | 10,012 | 2,375 | 0.2% | 0.1% |
| 17 | Prosecution time limit expired | 10,743 | 11,922 | 0.2% | 0.3% |
| 15 | Evidential difficulties (suspect identified; victim supports action) | 530,431 | 572,559 | 10.6% | 13.2% |
| Evidential difficulties (victim does not support action) | 1,212,039 | 1,142,355 | 24.2% | 26.3% | |
| 14 | Evidential difficulties: suspect not identified; victim does not support further action | 237,947 | 195,567 | 4.8% | 4.5% |
| 16 | Evidential difficulties: suspect identified; victim does not support further action | 974,092 | 946,788 | 19.5% | 21.8% |
| 18 | Investigation complete - no suspect identified | 2,155,723 | 1,579,481 | 43.1% | 36.4% |
| 20 | Action undertaken by another body/agency | 59,441 | 50,396 | 1.2% | 1.2% |
| 21 | Further investigation to support formal action not in the public interest6 | 61,871 | 51,370 | 1.2% | 1.2% |
| 22 | Diversionary, educational or intervention activity, resulting from the crime report, has been undertaken and it is not in the public interest to take any further action7 | 4,088 | 20,057 | 0.1% | 0.5% |
| Total offences assigned an outcome (type 1-18, 20-22) | 4,637,799 | 3,991,964 | 92.7% | 92.1% | |
| Offences not yet assigned an outcome | 365,758 | 344,679 | 7.3% | 7.9% | |
| Total offences 1,5 | 5,003,557 | 4,336,643 | 100.0% | 100.0% |
Notes 1. Year to March 2020 and year to March 2021 exclude fraud offences. Fraud offences are now recorded by the National Fraud Intelligence Bureau (NFIB) rather than police forces. Outcome 19 not shown as this applies only to fraud offences recorded by the NFIB.
-
Proportions show the percentage of crimes recorded in the year receiving each outcome.
-
Proportions as at the time data were provided to the Home Office.
-
Based on data from all 43 forces. Following the implementation of a new IT system in July 2019, Greater Manchester Police have been unable to supply data from July 2019 to March 2020.
-
Offences asked to be taken in to consideration by a court (TICs).
-
Outcome 21 was introduced from January 2016 on a voluntary basis and became mandatory from April 2016.
-
Outcome 22 was introduced on a voluntary basis from April 2019
How Outcomes Varied by Offence Group
As in previous years, how crimes were resolved varied considerably by the type of crime and is likely to reflect a range of factors including the nature of the offence, differing police priorities and the varying challenges in gathering evidence. For example, it will generally be far more difficult to identify a suspect for a criminal damage offence that was not witnessed or caught on CCTV, than for a drug possession offence where the police apprehended the offender at the time the crime came to their attention. Similarly, an offence where substantial forensic evidence exists will be easier to proceed to charge than one where such evidence does not. The willingness of victims or witnesses to engage with the police can also vary by type of offence. Related to this is the length of time that an offence requires to investigate. Both can impact on the distribution of outcomes. For example, a fairly large proportion of sexual offences recorded during year ending March 2021 had not yet been assigned an outcome (26%) when the latest analysis was undertaken. This, and the relatively high proportion of such cases closed with evidential difficulties, reflect challenges associated with investigating such crimes, such as related to evidence and/or support of the victim. The variation in outcomes across offence groups is highlighted by the differences in the four offences illustrated in Figure 2.1 (a fuller breakdown of can be found in Table 2.2).
While 66% of drug offences resulted in either a charge and or summons or an out of court disposal, the other three offences illustrated in Figure 2.1 had much lower rates of such outcomes. For example, robbery had a much higher proportion of offences resulting in no suspect being identified (49%). This is to be expected given the nature of the offence as victims of robbery may not be able to provide much information about offenders and there may not be as good evidence available to identify a suspect, for example because of absence of CCTV or other witness evidence. Offences involving violence against the person or sexual offences continued to be much more likely to have an outcome of evidential difficulties recorded compared with others such as drug or theft offences.
Figure 2.1: Outcome proportions by outcome group and offence group, for year ending March 2021, England and Wales
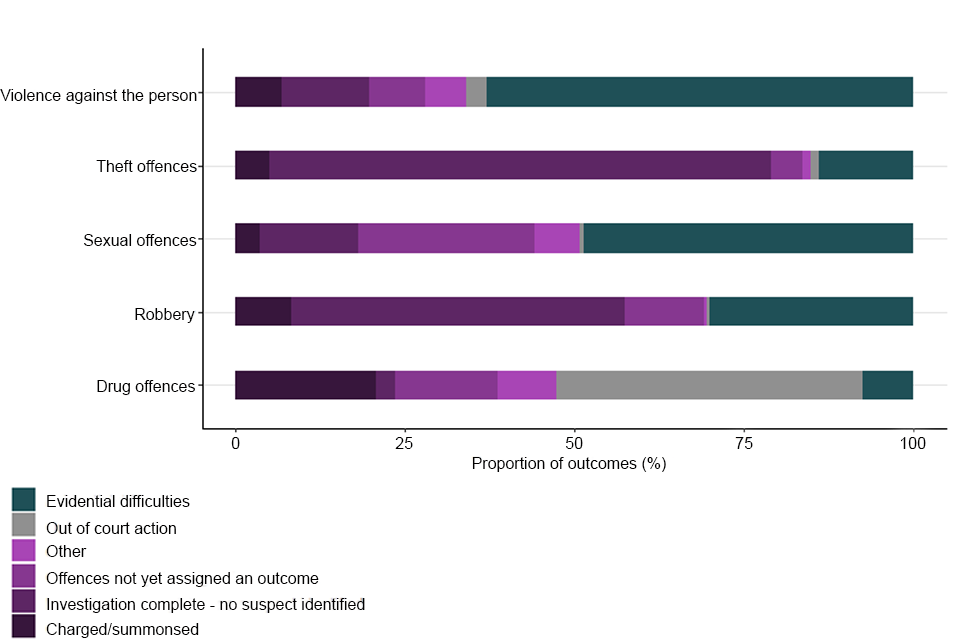
Drug offences
-
around 66% of drug offences received either a charge and or summons (21%) or an out-of-court disposal (45%) outcome, such as cautions and Community Resolutions; these disposals are typically used for dealing with less serious offences, but the suspect must admit guilt for the out-of-court outcome to be applied
-
compared with other offence groups, a smaller proportion of offences were closed due to no suspect being identified (3%), to be expected given the nature of the offence
-
within the overall category of drug offences there was a difference between how possession of cannabis and other drugs were resolved [footnote 6]; cannabis possession had a lower charge and or summons rate (15%) than other drug possession offences (37%); this reflects that possessions of small amounts of cannabis will often be dealt with by out of court action; this is shown by the 61% of Cannabis offences assigned such outcomes, compared with offences involving other drugs possessions where 25% received out of court actions
-
the last year saw a small rise in drug offences dealt with by Community Resolutions or Cannabis and or Khat Warnings which from 32% in March 2020 to 34% in March 2021; this was driven by changes in drug possession offences where those dealt with by Community Resolutions or Cannabis and or Khat Warnings rose from 39% year to March 2020 to 41% year to March 2021; the rise in such outcomes was smaller for drug trafficking offences where the equivalent proportions rose from 2.2% to 2.9%
-
when making comparisons at Police Force Area level, it should also be noted that police forces have differing approaches to the use of out -of court outcomes for drug offences; for example, Lancashire Constabulary, Leicestershire Police Force, Metropolitan Police Service and Staffordshire Police Force do not use cannabis and or khat warnings for possession of cannabis offences, instead preferring the use of Community Resolutions.
Sexual offences were:
-
most likely to have not yet been assigned an outcome (26%) reflecting the greater complexity and the extended time required to investigate such offences compared with most other crime types (see chapter 3)
-
this also contributed to the apparently low proportion of sexual offences with a charge and or summons (3.5%) at the time the data was finalized for analysis; the charge and or summons has risen slightly compared with the previous year (3.2% in the year ending March 2020); other contributory factors included a higher than average proportion of cases assigned to one of the evidential difficulties’ categories; for example, two in five rape offences (42%) were closed because the victim did not support further police action against a suspect
-
conversely, given the nature of the crime, sexual offences had much lower level of suspects not identified (14% compared with an average of 36% for all offences)
Violence against the person is a broad offence group covering a wide spectrum of offending from homicide and serious violent crime through to lower harm and less serious common assault. It also includes offences involving emotional rather than physical abuse, such as harassment and stalking.
-
generally, Violence against the person offences were most likely to result in victims not supporting police action (44%) and 19% were closed due to evidential difficulties with victim supporting action
-
outcomes also varied within this offence group by the type of offence, for example the charge and or summons rate for violence with injury offences was 3 percentage points higher than that for violence without injury (10% and 7% respectively); most of this difference was accounted for by victims of assault without injury not supporting police action; more serious offences received a higher charged and or summonsed rate with for example, 55% of homicide offences having received a charge and or summonsed outcome; homicide offences also frequently involve longer investigations and this was reflected in the fact that 40% of those offences recorded in year ending March 2021 having not yet received an outcome.
Table 2.2: Outcomes assigned to offences recorded in the year ending March 2021 1, by outcome group and offence group, England and Wales
| Outcome group | Violence against the person | Sexual offences | Robbery | Theft Offences | Criminal damage and arson | Drug offences | Possession of weapons offences | Public order offences | Misc. crimes against society |
|---|---|---|---|---|---|---|---|---|---|
| Charged and or summonsed | 6.8% | 3.5% | 8.2% | 5.0% | 5.4% | 20.7% | 35.4% | 8.4% | 12.3% |
| Taken into consideration (TICs)2 | 0.0% | 0.0% | 0.0% | 0.1% | 0.0% | 0.0% | 0.0% | 0.0% | 0.0% |
| Out-of-court (formal)3 | 1.2% | 0.3% | 0.2% | 0.4% | 1.4% | 11.3% | 5.1% | 1.3% | 1.0% |
| Out-of-court (informal)4 | 1.8% | 0.2% | 0.2% | 0.9% | 2.1% | 34.0% | 3.1% | 2.1% | 1.4% |
| Prosecution prevented or not in the public interest 5 | 2.2% | 2.0% | 0.2% | 0.4% | 0.9% | 3.0% | 3.3% | 1.8% | 2.5% |
| Evidential difficulties (suspect identified; victim supports action) | 19.0% | 15.4% | 8.5% | 5.7% | 8.0% | 6.9% | 18.6% | 18.3% | 17.8% |
| Evidential difficulties (victim does not support action) 6 | 43.9% | 33.3% | 21.5% | 8.3% | 17.0% | 0.7% | 7.4% | 31.6% | 21.6% |
| Investigation complete - no suspect identified | 12.8% | 14.4% | 49.2% | 73.9% | 59.5% | 2.7% | 9.3% | 27.0% | 15.8% |
| Action undertaken by another body/agency | 2.2% | 3.0% | 0.1% | 0.1% | 0.2% | 0.2% | 0.5% | 0.4% | 3.5% |
| Further investigation to support formal action not in the public interest 7 | 1.1% | 1.3% | 0.1% | 0.6% | 0.6% | 2.9% | 2.8% | 1.8% | 6.7% |
| Diversionary, educational or intervention activity, resulting from the crime report, has been undertaken and it is not in the public interest to take any further action 8 | 0.6% | 0.3% | 0.1% | 0.1% | 0.3% | 2.5% | 0.7% | 0.4% | 0.7% |
| Offences not yet assigned an outcome | 8.4% | 26.2% | 11.8% | 4.6% | 4.5% | 15.2% | 13.6% | 7.0% | 16.8% |
Notes: 1. Year to March 2021 data exclude fraud offences. Fraud offences are now recorded by the National Fraud Intelligence Bureau (NFIB) rather than police forces.
-
Offences asked to be taken into consideration by a court (TICs).
-
Includes caution - adults; caution - youths; Penalty Notices for Disorder.
-
Includes cannabis and or khat warnings and community resolutions.
-
Includes not in the public interest (CPS); Not in public interest (Police); Offender Died; Prosecution prevented (suspect under age; suspect too ill; victim/key witness dead/too ill); Prosecution time limit expired.
-
Includes evidential difficulties where the suspect was/was not identified, and the victim does not support further action.
-
Outcome 21 (Further investigation to support formal action not in the public interest) was introduced from January 2016 on a voluntary basis and became mandatory from April 2016.
-
Outcome 22 was introduced on a voluntary basis from April 2019.
-
Proportions show the percentage of crimes recorded in the year receiving each outcome.
-
Based on data from all 43 forces. Following the implementation of a new IT system in July 2019, Greater Manchester Police have been unable to supply data for July 2019 to March 2020.
Longer Term Trends in how Crimes Resolved
Since the introduction of the crime outcomes framework there has been a downward trend in the proportion of offences having a charge and or summons applied within the same year that the crime was recorded (falling from 16% in the year ending March 2015 to 7% in the year ending March 2021). There has also been a growing proportion of cases recorded where victims did not support police action (up from 9% to 26% over the same period). These two trends are likely to have been influenced by the changing caseload and crime mix being dealt with by the police. On-going work to improve crime recording by police forces has both increased the volume forces are dealing with and changed the crime mix to include more complex cases, such as sexual offences and domestic abuse, which can be more challenging to resolve. At the same time, police forces have increasingly been prioritising their investigative resource. A more detailed time series of outcomes since the new framework was introduced for the year end March 2014.
3 The Time Gap Between Offences Being Recorded and Outcomes Being Assigned
Key Results
-
overall, an (median) average of 11 days was taken from the date the crime was recorded to assign the outcome; this was an increase of 1 day compared with the previous year; the median days for an outcome to be assigned has increased for the last 4 years, for example up from 6 days in the year ending March 2018; there are likely to be a range of factors behind the rise including increasing volume of offences and complexity of caseloads being dealt with by the police
-
for the charge outcome, the median days rose from 33 days in March 2020 to 43 days in March 2021; this rose across all offence groups but was highest for sexual offences, (which increased by 53 days to 286), followed by robbery (up by 17 days to 86 days) and then violence against the person (up by 12 days to 46 days)
-
for most offences the median number of days for outcomes to be assigned was similar to the previous year except for robbery (42 days) which increased by 14 days in the year to March 2021 compared with the previous year; anecdotal evidence from forces suggests disruption to investigative processes arising from the Covid-19 pandemic may be a factor behind this rise; the median days for robbery closed with no suspect identified also increased from 19 days in year to March 2020 to 35 days in March 2021 driving up the overall average
This section explores the variation in the time that has elapsed from the initial recording of crime to the point at which an outcome has been finalised. This is based on the dates entered on a police force’s crime record management system (RMS).
In contrast with previous sections, the data presented in this chapter cover all outcomes recorded in the year ending March 2021 regardless of when the offence was initially recorded to give a more complete picture. Time, in days, is presented by median average as this measure is less susceptible to being skewed by a small number of unusually high or low values. It should be noted that this measure will not always reflect the actual time taken to deal with an individual case since, for example, there may be a delay between an offender being charged and the force crime RMS being updated.
Timeliness by Offence and Outcome Type
In the year ending March 2021, it took a median of 11 days to assign an outcome to an offence. Nearly half (42%) of all outcomes were assigned within five days of recording the offence and about two-thirds (65%) within 30 days. This was similar to the previous year when 43% of all outcomes were assigned within five days of recording the offence and 67% within 30 days.
The proportion of cases taking over 100 days to assign an outcome has risen from 13% in the year ending March 2020 to 16% in the year ending March 2021.
Analysis of all crime types masks significant variation which is visible through more insightful analysis that breaks down by offence and outcome type.
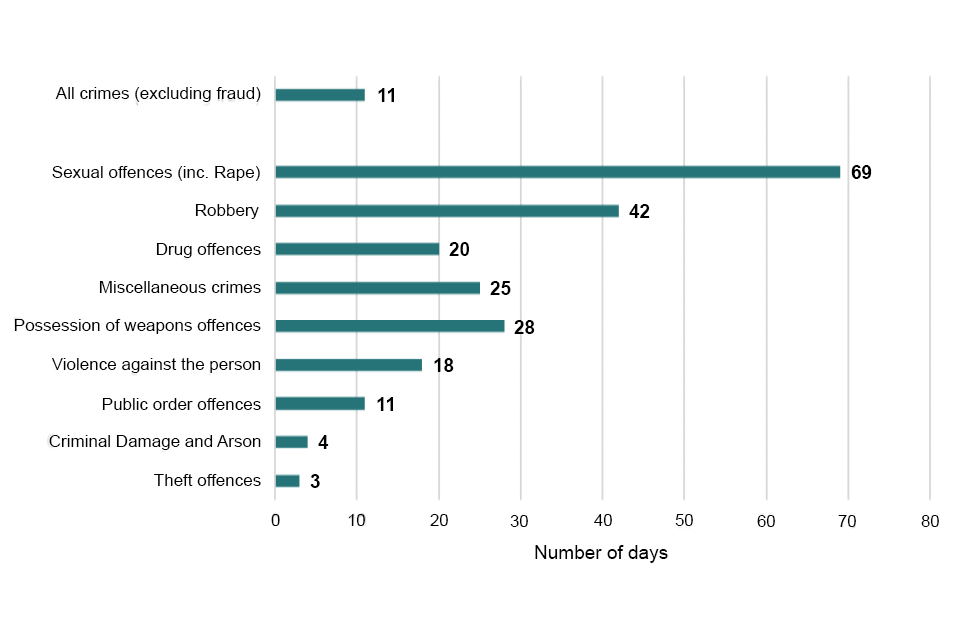
Figure 3.1: The time taken (median days) for outcomes to be assigned for offences broken down by offence groups, Year ending March 2021, England and Wales
Source: Home Office Data Hub
Table 3.1 shows the median length of time to assign an outcome by offence type for the last five years. Since 2018 the median days to assign an outcome has been increasing from 6 days to 9 days in the year ending March 2019, to 10 days in the year ending March 2020 and 11 days in the year ending March 2021.
This upward trend is likely to reflect a range of factors including most recently the impact of the Covid-19 pandemic. There was a 10% fall in crime recorded by the police following the first national lockdown in March last year which was largely driven by a sharp reduction in theft offences (down 32%). Theft offences are more likely to have lower prioritisation of investigative resources and this is reflected in a low median number of days to an outcome (3 days). This was driven by the fact that around three in four (74%) of theft offences were closed with no suspect identified at a median of 1 day.
In contrast, during the last year the volume of violence against the person and sexual offences showed little change or lower reductions (0% and down 10% respectively). These offences tend to be given higher priority for investigative resource and will have a high number of median days until an outcome is assigned.
The median days to assign an outcome for ‘Drug offences’ decreased to 20 days in year ending March 2021 from 26 days the previous year. At the same time the number of drug offences has risen by 13% from around 177,000 to just under 200,000 offences. The national trend was driven by the Metropolitan Police Service and reflected more proactive policing, including stop and searches, in high-crime hotspots as the police had increased capacity following marked reductions in the normal demands in the first quarter of the national lockdown in 2020.
Drug possessions, which make up 80% of all drug offences, saw a fall in median days to assign outcomes by 6 days from 20 days in the year ending March 2020 to 14 days in the latest year.
However, the median days to assign a charge for all drug offences increased by 11 days to 52 days. Some forces in the past have reported a backlog of forensic examinations including analysis of items such as mobile phones to ascertain evidence of drug dealing. This is likely to have also contributed to the increase in median days. Furthermore, some forces have cited the pandemic has made this worse.
Table 3.1: The difference in the average (median) length of time taken to assign an outcome between the year ending March 2016 and the year ending March 2021, by offence type
| Y.e. March 2016 (1) | Y.e. March 2017 (1) | Y.e. March 2018 (1) | Y.e. March 2019 (1) | Y.e. March 2020 (1) | Y.e. March 2021 (2) | Difference between y.e March 2020 and y.e March 2021 | |
|---|---|---|---|---|---|---|---|
| Violence against the person | 17 | 17 | 15 | 18 | 18 | 18 | 0 |
| Sexual offences | 80 | 79 | 73 | 77 | 66 | 69 | 3 |
| of which: Rape | 138 | 144 | 129 | 126 | 98 | 97 | -1 |
| Robbery | 34 | 31 | 23 | 24 | 28 | 42 | 14 |
| Theft offences | 7 | 4 | 2 | 2 | 4 | 3 | -1 |
| Criminal Damage and Arson | 4 | 3 | 2 | 3 | 4 | 4 | 0 |
| Drug offences | 10 | 13 | 14 | 21 | 26 | 20 | -6 |
| Possession of weapons offences | 9 | 13 | 13 | 18 | 25 | 28 | 3 |
| Public order offences | 16 | 13 | 8 | 12 | 12 | 11 | -1 |
| Miscellaneous crimes | 20 | 20 | 19 | 24 | 25 | 25 | 0 |
| All crimes (excluding fraud) | 11 | 8 | 6 | 9 | 10 | 11 | 1 |
Source: Home Office Data Hub
-
Median Days for Y.E March 2016 to Y.E March 2019 are as first published.
-
Only includes data for forces who send offence-level data to the Home Office Data Hub
Table 3.1 also shows:
-
overall, theft and criminal damage and arson offences took the least time to assign an outcome; a median of 3 and 4 days respectively; criminal damage and arson outcome times reflected the nature of these types of offence, whereby police identify offenders immediately, or evidence to locate a suspect is unavailable (e.g. no CCTV)
-
the median days to assign an outcome for ‘Possession of weapons offences’ also steadily increased in recent years rising to 28 days for the year ending March 2021 from 9 days (year ending March 2016); however, the increase in the latest year (3 days) was lower than seen in the previous two years; this general rise could be a result of an increase in number of offences recorded which, over the last year, rose by 68% (to 40,862 offences); some forces in the past have cited that increases in backlogs for forensic submission such as when the weapon has been seized along with illegal drugs have been a factor in recent years
Figure 3.2: The difference in the average (median) length of time taken to assign an outcome between the year ending March 2016 and the year ending March 2021, by outcome group
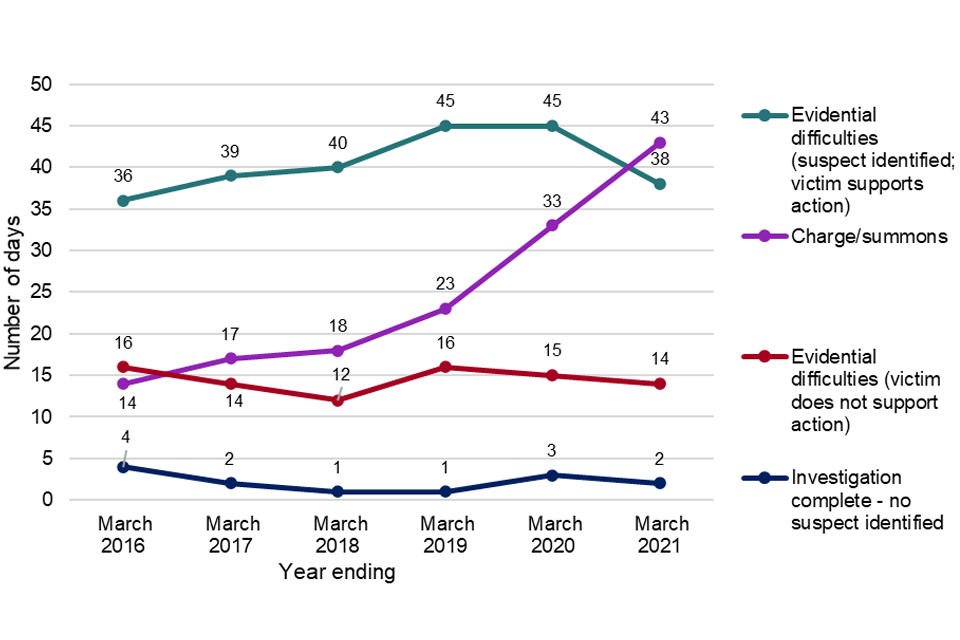
Figure 3.2 shows the average length of time to assign outcomes by type of outcome and how this has changed over the past five years.
-
the time taken to charge has gradually been increasing from 14 days in the year ending March 2016 to 43 days in the year ending March 2021
-
the median number of days for a charge outcome went up for all offence groups from the year ending March 2020 to year end March 2021; for example, the length of time for charges to be assigned for sexual offences increased by 53 days (from 233 days in March 2020 to 286 days in March 2021); there was a smaller rise for violence against the person offences which rose from 34 to 46 days
-
there has been evidence that during the pandemic forces have delayed sending some cases to the CPS because they were unable to obtain relevant information from other agencies; for example, in some domestic abuse cases, the police were unable to obtain paperwork from family law courts; additionally, in a recent HMICFRS inspection it was noted that “one force told us that several cases were put on hold for over three months’
-
the number of days to assign outcome of ‘evidential difficulties (victim does supports action)’decreased by 7 days from 45 days in the year ending March 2020 to 38 in the year ending March 2021; there was a smaller reduction in cases where the victim does not support action where the median days fell by 1 day to 14 days
-
the median length of time for investigations to be closed with no suspect identified for all offences was 2 days, a day less than the previous year but similar seen in previous years
-
as in previous years, sexual offences took much longer to have outcomes assigned than other offence types, reflecting the fact they are generally more challenging to investigate; the median was 69 days, with 41 per cent taking over 100 days
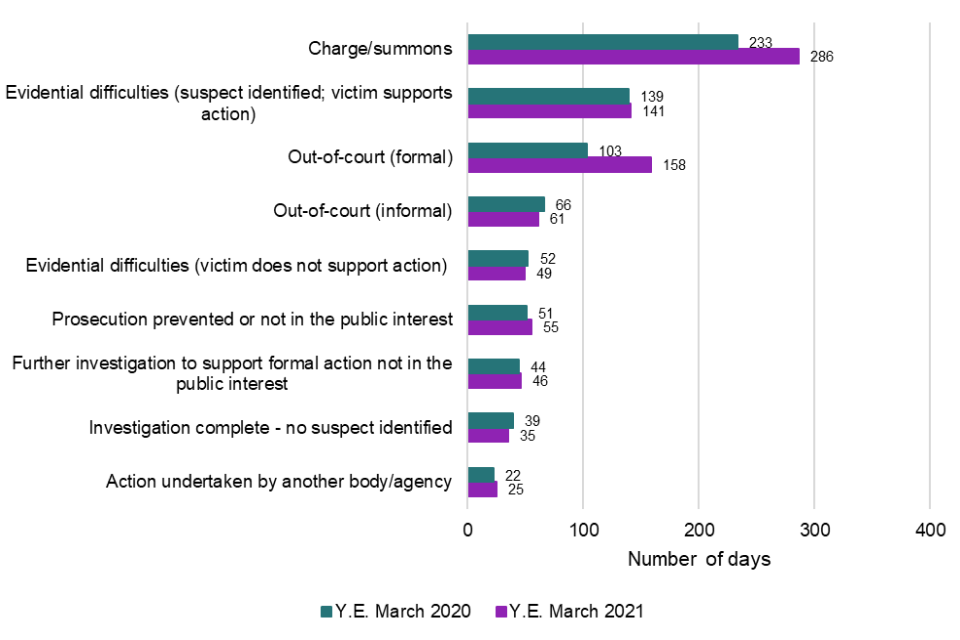
For rape offences, the median average for an outcome to be assigned was 97 days, with nearly half (49%) in year ending March 2021 taking over 100 days, this is similar to the previous year. The length of time reflects the sensitive nature and complexity of investigating such offences. A detailed breakdown of the amount of time for all sexual offences to receive an outcome by the type of outcome applied is presented in Figure 3.3.
This shows that, despite the median number of days for an outcome to be assigned having increased by 3 days, this masks variation between different outcomes.
-
charges and summons for sexual offences took the longest amount of time to be assigned, at a median of 286 days up from 233 days the previous year; while 72% of sexual offences resulting in a charge closed after 100 days of investigating, a small proportion (18%) took under 30 days
-
the median number of days for sexual offences cases closed due to evidential difficulties where victim supported action increased to 141 days from 139 the previous year, in contrast, cases closed with evidential difficulties where the victim did not support action saw a fall in median days to outcome from 52 days in year ending March 2020 to 49 days in year ending March 2021
Figure 3.3 The time taken (median days) for sexual offences to receive an outcome, broken down by the type of outcome, for year ending March 2020 and 2021, England and Wales
Length of Time Taken to Assign Outcome by Outcome Types
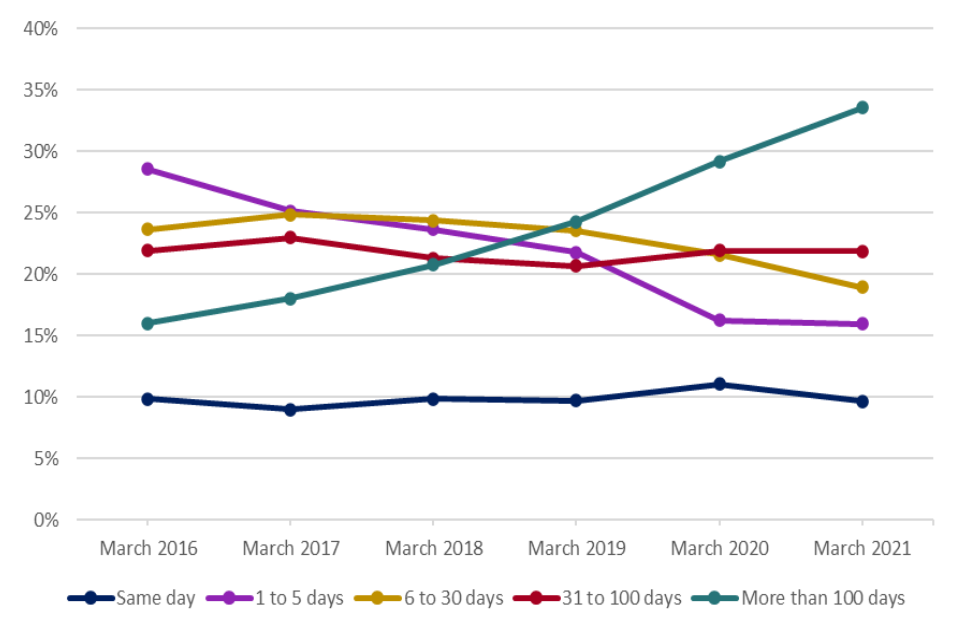
Around four in ten (42%) of all outcomes were assigned within five days of recording the offence, and about two-thirds (65%) within 30 days. The proportion of cases taking over 100 days to assign an outcome increased from 13% to 16% Table 3.2 below shows how this varied by offence group.
Table 3.2 Timeliness: The length of time between offences and outcomes being recorded for outcomes recorded in the year ending March 2021, by offence type, England and Wales
| Same day | 1 to 5 days | 6 to 30 days | 31 to 100 days | More than 100 days | |
|---|---|---|---|---|---|
| Violence against the person | 12% | 22% | 26% | 23% | 17% |
| Sexual offences | 5% | 10% | 19% | 25% | 41% |
| of which: Rape | 3% | 8% | 16% | 24% | 49% |
| Robbery | 4% | 16% | 22% | 29% | 29% |
| Theft offences | 29% | 27% | 18% | 15% | 12% |
| Criminal Damage and Arson | 30% | 24% | 20% | 16% | 10% |
| Drug offences | 11% | 23% | 23% | 19% | 25% |
| Possession of weapons offences | 11% | 19% | 22% | 23% | 26% |
| Public order offences | 15% | 25% | 25% | 21% | 14% |
| Miscellaneous crimes | 13% | 18% | 22% | 20% | 26% |
| All offence types | 19% | 23% | 22% | 20% | 16% |
Source: Home Office Data Hub
Over the last five years the number of offences taking over 100 days to charge has increased, see Figure 3.4. For the year ending March 2021, 34% of all offences with an outcome of charge and or summons took over 100 days to close, compared with 16% for the year ending March 2016, an 18-percentage point increase.
Figure 3.4: The length of time between offences and outcomes being recorded for charge and or summons in the year ending March 2016 to March 2021, England and Wales
Source: Home Office Data Hub
Drug offences took longer to close than many other crime types, with just under a quarter of offences closing after 100 day, which is lower than March 2020 here 28% of all drug offences took over 100 days to close. Of those drug offences which resulted in a charge, 40% took over 100 days to close in the year ending March 2021 which was an increase from 36% for the year ending March 2020.
Possession of weapons also took longer to close with 26% taking over 100 days, a rise of 3 percentage points compared with the previous year. Just over a third of all possession of weapons offences (35%) were closed with a charge and or summons, similar to the previous year (also 35%). Some forces have cited administrative issues and delays in digital forensics causing a backlog in cases. Furthermore, these cases require CPS approval to charge which has the potential to lead to delays.
In contrast for the year ending March 2021, nearly one out of every three theft and criminal damage and arson offences were closed on the same day (see table 3.2). This was similar to the previous year when 27% and 30% closed on the same day respectively.
Key question – How has the COVID-19 Pandemic changed the overall time taken for charge outcomes to be assigned to crimes changed?
For the charge outcome, the median days rose from 33 days in March 2020 to 43 days in March 2021. This rose across all offence groups but was highest for sexual offences, (which increased by 53 days to 286), followed by robbery (up by 17 days to 86 days) and then violence against the person (up by 12 days to 46 days).
Possible reasons for this rise have been outlined in an HMICFRS inspection of policing of the pandemic which noted:
‘Police forces delayed sending some cases to the CPS because they were unable to obtain relevant information from other agencies. For example, in some domestic abuse cases, the police were unable to obtain paperwork from family law courts. One force told us that several cases were put on hold for over three months, including an alleged child rape.
Forces told us of an inconsistent response from the CPS about charging decisions. Although many forces said that CPS services were largely unaffected, others reported the withdrawal of CPS direct advice (for cases other than remand cases). This caused delays in decision-making, exposing victims to greater risk and leaving suspects on bail for longer.
The wider concern for policing was that CPS lawyers advised more frequently that OOCD, rather than charging, was a more suitable disposal option. This caused problems and disagreements when the police considered that a charge was more appropriate given the nature of the offence.’
It also found that
‘Some police investigations were delayed due to restrictions placed on visiting prisons. Investigations, particularly in serious and complex cases, were probably hindered because police officers were unable to interview prisoners being held on remand.’
4 Experimental Statistics: Outcomes Assigned to Fraud and Computer Misuse Act (CMA) Offences
Key Results
-
the total number of fraud offences assigned an outcome increased from 50,088 to 51,870 in the year ending March 2021 while the total number of Computer Misuse Act (CMA) offences assigned an outcome increased from 4,482 to 7,613
-
the number of fraud offences disseminated to forces decreased by 6% (from 26,301 to 24,805) and, while relatively low in volume, the number of CMA offences referred to forces increased by 20% (from 3,334 to 3,991)
-
an 11% fall (down from 5,431 to 4,853) was seen in the number of disseminated fraud cases that resulted in a ‘charge and or summons’ (equivalent to 20% of all disseminated cases and around 1% of all recorded fraud offences)
-
there was a small volume decrease in CMA disseminated cases that resulted in a ‘charge and or summons’ (down to 71 from 110): this was equivalent to 2% of all disseminated cases and 0.2% of all recorded CMA offences
4.1 Introduction
Action Fraud are the UK’s national fraud and cybercrime reporting centre, having taken over the recording of fraud offences from individual police forces on a rolling basis from March 2013. More information on the recording of fraud and CMA offences can be found in the crime statistics user guide.
Action Fraud reports are reviewed by the National Fraud Intelligence Bureau (NFIB), based at the City of London Police, who are responsible for allocating offences to forces for them to investigate (these are known as a ‘dissemination package’). Each dissemination package can be made up of any number of offences, from one to hundreds. This depends on the size of the suspected fraud network, as many similar crimes may be linked together if investigators believe one suspect or set of suspects is responsible for a number of different offences. Also an offence can be included in more than one dissemination, if it links to multiple crime networks. However, each offence only receives one final outcome.
The police recorded crime series, published by the Office for National Statistics (ONS), also incorporates offences reported to the NFIB by two fraud prevention industry bodies: Cifas and UK Finance. Figures for these fraud bodies have been included in fraud and total counts only as neither industry body collects or provides reports relating to CMA offences.
The disseminations and outcomes dataset provided by the NFIB continues to be subject to development and quality assurance and so these statistics should still be treated as experimental. The outcomes presented in this chapter differ to other crime types as they are based on the old-style outcomes, i.e. the number of outcomes recorded within a year regardless of when the offence occurred.
In October 2018, Action Fraud launched a new fraud and cybercrime reporting service with the intention of being able to provide information on outcomes against fraud offences recorded in the year. However, due to various technical and administrative issues with the new system, provision of these data has not yet been possible.
Outcomes data for the year to March 2020 are based on updated data we have received from NFIB. For the year ending March 2021, revised figures will be published next year, as additional outcomes records are added to the system over the coming months. Disseminations data for the year ending March 2020 have been revised since previously published, as new information became available. For both outcomes and disseminations, where comparisons are made to last year’s data, these are based on the revised data.
For further information on NFIB’s outcomes recording process please see the Technical Annex Section.
4.2 Fraud and Computer Misuse Disseminations and Outcomes in the Year Ending March 2021 - Headline Findings
The findings from the disseminations and outcomes data for the year ending March 2021 are presented below. Since last year, fraud and CMA offences have been presented separately (previously these were combined). This gives greater clarity to the outcomes for these offences which, while often related, differ in their nature and investigation.
Table 4.1 shows the number of unique fraud and CMA offences sent to police forces for investigation. By way of context, these are presented alongside the total number of fraud and CMA offences recorded in the years ending March 2020 and March 2021.
While there was a larger volume of fraud offences reported to NFIB, compared with the previous year, only a small proportion of them were disseminated to police forces for further investigation (3% in the latest year compared with 4% in the year ending March 2020). In contrast, as seen last year, there was a much smaller volume of CMA offences reported to the NFIB but a relatively larger proportion disseminated to forces for investigation (13% both in the year ending March 2020 and March 2021).
In volume terms, there was a 6% fall in the volume of fraud offences disseminated to forces in the latest year. This contrasts with the number of CMA offences that were disseminated to forces for investigation in the latest year (up by 20%).
Table 4.1: Number of fraud and CMA offences and disseminations, year ending March 2020 and year ending March 2021 (Experimental Statistics)1,2,3
| Year ending Mar 2020 (3) | Year ending Mar 2020 (3) | Year ending Mar 2020 (3) | Year ending Mar 2021 | Year ending Mar 2021 | Year ending Mar 2021 | % change between y.e. Mar 2020 and y.e. Mar 2021 | % change between y.e. Mar 2020 and y.e. Mar 2021 | % change between y.e. Mar 2020 and y.e. Mar 2021 | |
|---|---|---|---|---|---|---|---|---|---|
| Fraud | CMA | Total | Fraud | CMA | Total | Fraud | CMA | Total | |
| Total number of offences: | 748,321 | 26,215 | 774,536 | 806,637 | 30,467 | 837,104 | 8% | 16% | 8% |
| Number recorded by Action Fraud | 312,035 | 26,215 | 338,250 | 398,022 | 30,467 | 428,489 | 28% | 16% | 27% |
| Number recorded by Cifas6 | 334,297 | - | 334,297 | 310,495 | - | 310,495 | -7% | NA% | -7% |
| Number recorded by UK Finance4,6 | 101,989 | - | 101,989 | 98,119.7 | - | 98,119.7 | -4% | NA% | -4% |
| Total number of unique offences within disseminations5 | 26,301 | 3,334 | 29,635 | 24,805 | 3,991 | 28,796 | -6% | 20% | -3% |
- Caution should be taken when comparing data for fraud offences and disseminations. Data presented are for offences and disseminations recorded within the year. Offences which are disseminated will not necessarily be disseminated in the year the offence was recorded.
- These data are Experimental Statistics, which means that caution should be taken when interpreting the figures.
- Recorded fraud and CMA offences for the year ending March 2020 will not match previously published figures due to data revisions we have received.
- For the year ending March 2021, a small portion of the records supplied to the National Fraud Intelligence Bureau (NFIB) by UK Finance have not been successfully ingested by the NFIB systems due to validation errors. The NFIB is working with UK Finance to ensure that all records are successfully processed.
- Some offences can be included in more than one dissemination or can be disseminated to a force in multiple months. This number reflects the total number of unique offences that have been disseminated to forces for further investigation, and offences which are part of two or more dissemination packages are only counted once.
- Cifas and UK Finance do not report CMA fraud types.
4.3 Outcomes Recorded Against Fraud and Computer Misuse Offences by Outcome Type
Table 4.2 shows the number of outcomes recorded by the police against fraud and CMA offences in the year ending March 2021, by outcome type. These are presented alongside the total number of fraud and CMA offences disseminated to the police and the total number of recorded fraud and CMA offences for the latest and the previous year. The figures presented here differ from the method used in Chapter 2 for all other recorded crime since it is not currently possible to link individual crime records to their outcomes for fraud and CMA offences.
It is important to note that the number of outcomes will not necessarily correspond to the number of disseminations in a given year since investigations can extend beyond the year in which they were initially sent to forces for investigation before they are complete. A number of offences disseminated to the police in the year ending March 2021 remain under investigation.
Table 4.2: Number of fraud and CMA outcomes recorded in the year ending March 2020 and the year ending March 2021 by outcome type (Experimental Statistics)2
| Year ending Mar 2020 (6) | Year ending Mar 2020 (6) | Year ending Mar 2020 (6) | Year ending Mar 2021 | Year ending Mar 2021 | Year ending Mar 2021 | % change between y.e. Mar 2020 and y.e. Mar 2021 | % change between y.e. Mar 2020 and y.e. Mar 2021 | % change between y.e. Mar 2020 and y.e. Mar 2021 | ||
|---|---|---|---|---|---|---|---|---|---|---|
| Outcome type/group 5 | Fraud | CMA | Total 3,6 | Fraud | CMA | Total3,6 | Fraud | CMA | Total | |
| Charged and or summonsed | 5,431 | 110 | 5,541 | 4,853 | 71 | 4,924 | -11% | -36% | -11% | |
| Taken Into Consideration 1 | 138 | 1 | 139 | 102 | - | 102 | -26% | N/A | -27% | |
| Out-of-court (formal) | 568 | 46 | 614 | 591 | 32 | 623 | 4% | -30% | 1% | |
| Caution - youths | 57 | 13 | 70 | 28 | 1 | 29 | -51% | N/A | -59% | |
| Caution - youths | 509 | 33 | 542 | 558 | 31 | 589 | 10% | - | 9% | |
| Penalty Notices for Disorder | 2 | - | 2 | 5 | - | 5 | - | - | - | - |
| Out-of-court (informal) | 461 | 34 | 495 | 443 | 19 | 462 | -4% | - | -7% | |
| Cannabis/Khat warning 4 | - | - | - | - | - | - | - | - | - | |
| Community resolution | 461 | 34 | 495 | 443 | 19 | 462 | -4% | - | -7% | |
| Prosecution prevented or not in the public interest | 1,077 | 23 | 1,100 | 805 | 39 | 844 | -25% | - | -23% | |
| Offender died | 25 | - | 25 | 22 | 2 | 24 | - | - | - | - |
| Not in public interest (CPS) | 212 | 1 | 213 | 118 | 5 | 123 | -44% | - | -42% | |
| Not in public interest (Police) | 695 | 22 | 717 | 457 | 23 | 480 | -34% | - | -33% | |
| Prosecution prevented - suspect under age | 3 | - | 3 | 8 | - | 8 | - | - | - | |
| Prosecution prevented - suspect too ill | 17 | - | 17 | 18 | - | 18 | - | - | - | |
| Prosecution prevented - victim/key witness dead/too ill | 118 | - | 118 | 165 | 3 | 168 | 40% | - | 42% | |
| Prosecution time limit expired | 7 | - | 7 | 17 | 6 | 23 | - | N/A | - | |
| Evidential difficulties (suspect identified; victim supports action) | 12,108 | 431 | 12,539 | 11,491 | 740 | 12,231 | -5% | 72% | -2% | |
| Evidential difficulties (victim does not support action) | 6,849 | 958 | 7,807 | 7,668 | 1,175 | 8,843 | 12% | 23% | 13% | |
| Evidential difficulties: suspect not identified; victim does not support further action | 1,737 | 442 | 2,179 | 2,194 | 659 | 2,853 | 26% | 49% | 31% | |
| Evidential difficulties: suspect identified; victim does not support further action | 5,112 | 516 | 5,628 | 5,474 | 516 | 5,990 | 7% | 0% | 6% | |
| **Investigation complete - no suspect identified ** | 18,744 | 2,703 | 21,447 | 22,420 | 5,238 | 27,658 | 20% | 94% | 29% | |
| Action undertaken by another body/agency | 1,885 | 82 | 1,967 | 1,571 | 143 | 1,714 | -17% | 74% | -13% | |
| Further investigation to support formal action not in the public interest | 2,746 | 86 | 2,832 | 1,790 | 117 | 1,907 | -35% | 36% | -33% | |
| Disruption activity undertaken NIPI to take further action7 | 81 | 8 | 89 | 136 | 39 | 175 | 68% | * | 97% | |
| Total number of outcomes | 50,088 | 4,482 | 54,570 | 51,870 | 7,613 | 59,483 | 4% | 70% | 9% | |
| Total number of unique offences within dissemination | 26,301 | 3,334 | 29,635 | 24,805 | 3,991 | 28,796 | -6% | 20% | -3% | |
| Total recorded offences | 748,321 | 26,215 | 774,536 | 806,637 | 30,467 | 837,104 | 8% | 16% | 8% |
- Offences asked to be taken into consideration by a court (TICs).
- These data are Experimental Statistics, which mean that caution should be taken when interpreting the figures.
- Offences recorded by Action Fraud, Cifas and UK Finance with outcomes recorded by NFIB in the year ending March 2020 or the year ending March 2021.
- Outcome 7 does not apply to fraud offences.
- The Home Office does not currently collect data on outcome 19 from the NFIB.
- Following updates from forces, figures for March 2020 have been revised from last year’s publication.
- Outcome 22 was introduced in April 2019 and this is the first year it has been presented for fraud and CMA offences. This was previously a voluntary outcome type for police forces to record. *an asterisk indicates that percentage changes have been suppressed for cases under 50
Table 4.2 shows:
-
compared with other crime types (reported in Chapter 2), a relatively low proportion of recorded fraud and CMA offences were subject to investigative outcomes since such a small percentage of cases were disseminated to police forces for investigation
-
between the year ending March 2020 and March 2021, a 6% decrease was seen in the number of fraud offences disseminated to police forces (down by 1,496 offences), compared with a 20% increase in CMA disseminations (up by 657 offences); however, it should be noted that CMA volume increases were relatively small (from 3,334 in year ending March 2020 to 3,991 in year ending March 2021)
-
over the same period, fraud outcomes increased by 4% (up by 1,782 outcomes), compared with a 70% increase in CMA outcomes (up by 3,131 outcomes)
-
the number of disseminated fraud offences that resulted in a ‘charge and or summons’ outcome fell by 11% (from 5,431 to 4,853); to put this in context, the number of ‘charge and or summons’ outcomes was equivalent to 20% of the volume of offences disseminated to forces for further investigation and around 1% of all recorded fraud offences
-
in the same period, the number of CMA offences that received a ‘charge and or summons’ outcome decreased by 35% (from 110 to 71 outcomes); this was equivalent to 2% of all CMA offences disseminated to forces for investigation and less than half percent (0.2%) of all recorded CMA offences
-
for both fraud and CMA offences there was an increase in the proportion of cases closed with an outcome of ‘Investigation complete: no suspect identified’ (up 20% for fraud and 94% for CMA); the number of CMA offences that received this outcome increased from 2,703 in year to March ‘20 to 5,238 in the year to March ‘21 accounting for 60% and 69% of all CMA outcomes respectively; this outcome type accounted for 43% of all fraud outcomes
4.4 Disseminations and Outcomes by Police Force Area
Tables 4.3.1 and 4.3.2 show fraud and CMA disseminations and outcomes data for the years ending March 2020 and March 2021 by Police Force Area (PFA).
As previously mentioned, it is important to note that the number of outcomes will not necessarily correspond to the number of disseminations in a given year. Caution should be taken when comparing the number of outcomes to disseminated offences as investigations can take months or longer to complete or the offence could have occurred in a previous year.
Table 4.3.1: Fraud and Computer Misuse Act (CMA) offences disseminated to forces 2, by Police Force Area, years ending March 2020 and March 2021 (Experimental Statistics) 1
| Police Force | Year ending Mar 2020 (3) | Year ending Mar 2020 (3) | Year ending Mar 2020 (3) | Year ending Mar 2021 | Year ending Mar 2021 | Year ending Mar 2021 | %Change Total |
|---|---|---|---|---|---|---|---|
| Fraud | CMA | Total 3,4 | Fraud | CMA | Total 3,4 | %Change Total | |
| Avon and Somerset | 332 | 60 | 392 | 1,544 | 69 | 1,613 | 311% |
| Bedfordshire | 239 | 57 | 296 | 550 | 57 | 607 | 105% |
| Cambridgeshire | 167 | 35 | 202 | 179 | 40 | 219 | 8% |
| Cheshire | 211 | 73 | 284 | 340 | 146 | 486 | 71% |
| City of London | 525 | 35 | 560 | 366 | 36 | 402 | -28% |
| Cleveland | 222 | 26 | 248 | 84 | 13 | 97 | -61% |
| Cumbria | 83 | 46 | 129 | 48 | 41 | 89 | -31% |
| Derbyshire | 165 | 43 | 208 | 302 | 33 | 335 | 61% |
| Devon and Cornwall | 446 | 104 | 550 | 337 | 86 | 423 | -23% |
| Dorset | 202 | 78 | 280 | 240 | 62 | 302 | 8% |
| Durham | 42 | 20 | 62 | 182 | 33 | 215 | 247% |
| Essex | 1,096 | 130 | 1,226 | 565 | 137 | 702 | -43% |
| Gloucestershire | 76 | 31 | 107 | 122 | 26 | 148 | 38% |
| Greater Manchester | 1,478 | 157 | 1,635 | 1,290 | 113 | 1,403 | -14% |
| Hampshire | 295 | 121 | 416 | 309 | 151 | 460 | 11% |
| Hertfordshire | 291 | 60 | 351 | 431 | 149 | 580 | 65% |
| Humberside | 245 | 108 | 353 | 198 | 85 | 283 | -20% |
| Kent | 527 | 145 | 672 | 843 | 148 | 991 | 47% |
| Lancashire | 390 | 79 | 469 | 639 | 96 | 735 | 57% |
| Leicestershire | 1,419 | 44 | 1,463 | 540 | 46 | 586 | -60% |
| Lincolnshire | 246 | 30 | 276 | 240 | 63 | 303 | 10% |
| Merseyside | 312 | 70 | 382 | 341 | 58 | 399 | 4% |
| Metropolitan | 10,561 | 504 | 11,065 | 8,935 | 758 | 9,693 | -12% |
| Norfolk | 140 | 28 | 168 | 246 | 25 | 271 | 61% |
| North Yorkshire | 109 | 23 | 132 | 89 | 27 | 116 | -12% |
| Northamptonshire | 367 | 86 | 453 | 189 | 126 | 315 | -30% |
| Northumbria | 168 | 49 | 217 | 194 | 65 | 259 | 19% |
| Nottinghamshire | 381 | 58 | 439 | 406 | 103 | 509 | 16% |
| South Yorkshire | 373 | 58 | 431 | 453 | 70 | 523 | 21% |
| Staffordshire | 174 | 57 | 231 | 194 | 81 | 275 | 19% |
| Suffolk | 173 | 32 | 205 | 122 | 51 | 173 | -16% |
| Surrey | 401 | 76 | 477 | 397 | 123 | 520 | 9% |
| Sussex | 441 | 123 | 564 | 600 | 159 | 759 | 35% |
| Thames Valley | 626 | 122 | 748 | 781 | 86 | 867 | 16% |
| Warwickshire | 121 | 33 | 154 | 85 | 41 | 126 | -18% |
| West Mercia | 267 | 47 | 314 | 346 | 50 | 396 | 26% |
| West Midlands | 1,932 | 183 | 2,115 | 1,374 | 168 | 1,542 | -27% |
| West Yorkshire | 885 | 97 | 982 | 1,332 | 101 | 1,433 | 46% |
| Wiltshire | 162 | 77 | 239 | 187 | 44 | 231 | -3% |
| England | 25,796 | 3,180 | 28,976 | 24,340 | 3,748 | 28,088 | -3% |
| Dyfed-Powys | 52 | 10 | 62 | 65 | 68 | 133 | 115% |
| Gwent | 130 | 18 | 148 | 97 | 17 | 114 | -23% |
| North Wales | 164 | 74 | 238 | 68 | 82 | 150 | -37% |
| South Yorkshire | 182 | 56 | 238 | 236 | 75 | 311 | 31% |
| Wales | 525 | 158 | 683 | 466 | 242 | 708 | 4% |
| England and Wales 3,4 | 26,296 | 3,334 | 29,630 | 24,801 | 3,989 | 28,790 | -3% |
| British Transport Police | 5 | - | 5 | 4 | 2 | 6 | * |
| Grand Total 3,4 | 26,301 | 3,334 | 29,635 | 24,805 | 3,991 | 28,796 | -3% |
- These data are Experimental Statistics, which mean that caution should be taken when interpreting the figures.
- The number of outcomes will not necessarily correspond to the number of disseminations in a given year since investigations can take months or longer to complete.
- Fraud disseminations for the year ending March 2020 have been revised since figures were previously published. Offences reported by Cifas and UK Finance are now included in the relevant fraud categories. In previous publications, these figures were only included in the total number of disseminated offences. *an asterisk indicates that percentage changes have been suppressed for cases under 50
Table 4.3.2: Recorded fraud and Computer Misuse Act (CMA) offences outcomes 3,4, by Police Force Area, ending March 2020 and March 2021 (Experimental Statistics 1)
| Year ending Mar 2020 (3) | Year ending Mar 2020 (3) | Year ending Mar 2020 (3) | Year ending Mar 2021 | Year ending Mar 2021 | Year ending Mar 2021 | %Change Total | |
|---|---|---|---|---|---|---|---|
| Police Force | Fraud | CMA | Total 3,4 | Fraud | CMA | Total 3,4 | %Change Total |
| Avon and Somerset | 641 | 125 | 766 | 468 | 170 | 638 | -17% |
| Bedfordshire | 632 | 64 | 696 | 1,008 | 99 | 1,107 | 59% |
| Cambridgeshire | 1,145 | 81 | 1,226 | 886 | 102 | 988 | -19% |
| Cheshire | 355 | 230 | 585 | 160 | 287 | 447 | -24% |
| City of London | 1,759 | 24 | 1,783 | 1,309 | 15 | 1,324 | -26% |
| Cleveland | 171 | 35 | 206 | 261 | 21 | 282 | 37% |
| Cumbria | 690 | 67 | 757 | 554 | 84 | 638 | -16% |
| Derbyshire | 949 | 51 | 1,000 | 715 | 133 | 848 | -15% |
| Devon and Cornwall | 1,170 | 147 | 1,317 | 1,229 | 373 | 1,602 | 22% |
| Dorset | 1,179 | 64 | 1,243 | 1,086 | 190 | 1,276 | 3% |
| Durham | 248 | 7 | 255 | 177 | 14 | 191 | -25% |
| Essex | 1,617 | 152 | 1,769 | 1,255 | 98 | 1,353 | -24% |
| Gloucestershire4 | 221 | 52 | 273 | 866 | 112 | 978 | 258% |
| Greater Manchester | 1,482 | 74 | 1,556 | 1,780 | 130 | 1,910 | 23% |
| Hampshire | 1,282 | 214 | 1,496 | 648 | 254 | 902 | -40% |
| Hertfordshire | 1,369 | 171 | 1,540 | 681 | 187 | 868 | -44% |
| Humberside | 428 | 97 | 525 | 748 | 119 | 867 | 65% |
| Kent | 1,322 | 110 | 1,432 | 1,625 | 174 | 1,799 | 26% |
| Lancashire5 | 602 | 57 | 659 | 1,355 | 334 | 1,689 | 156% |
| Leicestershire | 538 | 86 | 624 | 399 | 94 | 493 | -21% |
| Lincolnshire | 1,250 | 65 | 1,315 | 1,291 | 142 | 1,433 | 9% |
| Merseyside | 1,017 | 83 | 1,100 | 343 | 102 | 445 | -60% |
| Metropolitan | 4,908 | 323 | 5,231 | 10,017 | 1,035 | 11,052 | 111% |
| Norfolk | 717 | 82 | 799 | 765 | 104 | 869 | 9% |
| North Yorkshire | 47 | 12 | 59 | 18 | 10 | 28 | -53% |
| Northamptonshire | 1,204 | 133 | 1,337 | 1,741 | 183 | 1,924 | 44% |
| Northumbria | 378 | 89 | 467 | 580 | 90 | 670 | 43% |
| Nottinghamshire | 2,786 | 174 | 2,960 | 2,877 | 347 | 3,224 | 9% |
| South Yorkshire | 1,342 | 177 | 1,519 | 1,167 | 243 | 1,410 | -7% |
| Staffordshire | 943 | 38 | 981 | 876 | 70 | 946 | -4% |
| Suffolk | 547 | 60 | 607 | 474 | 77 | 551 | -9% |
| Surrey6 | 2,229 | 89 | 2,318 | 1,469 | 185 | 1,654 | -29% |
| Sussex | 3,363 | 129 | 3,492 | 3,016 | 254 | 3,270 | -6% |
| Thames Valley | 1,267 | 72 | 1,339 | 1,017 | 76 | 1,093 | -18% |
| Warwickshire | 529 | 30 | 559 | 494 | 57 | 551 | -1% |
| West Mercia | 1,313 | 81 | 1,394 | 1,085 | 150 | 1,235 | -11% |
| West Midlands | 2,916 | 371 | 3,287 | 2,254 | 634 | 2,888 | -12% |
| West Yorkshire7 | 1,066 | 83 | 1,149 | 541 | 100 | 641 | -44% |
| Wiltshire | 546 | 111 | 657 | 567 | 146 | 713 | 9% |
| England | 46,168 | 4,110 | 50,278 | 47,802 | 6,995 | 54,797 | 9% |
| Dyfed-Powys | 516 | 30 | 546 | 559 | 128 | 687 | 26% |
| Gwent | 435 | 19 | 454 | 499 | 24 | 523 | 15% |
| North Wales | 1,190 | 118 | 1,308 | 1,498 | 206 | 1,704 | 30% |
| South Yorkshire | 1,684 | 202 | 1,886 | 1,433 | 259 | 1,692 | -10% |
| Wales | 3,825 | 369 | 4,194 | 3,989 | 617 | 4,606 | 10% |
| England and Wales 3,4 | 49,993 | 4,479 | 54,472 | 51,791 | 7,612 | 59,403 | 9% |
| British Transport Police | 95 | 3 | 98 | 79 | 1 | 80 | * |
| Grand Total 3,4 | 50,088 | 4,482 | 54,570 | 51,870 | 7,613 | 59,483 | 9% |
- These data are Experimental Statistics, which means that caution should be taken when interpreting the figures.
- The number of outcomes will not necessarily correspond to the number of disseminations in a given year since investigations can take months or longer to complete.
- Following updates from forces, figures for the year ending March 2020 have been revised from last year’s publication.
- Gloucestershire report that the rise in outcomes reflects better recording practices over the last financial year.
- Lancashire report that the rise in outcomes reflects a general rise in fraud and CMA offences that have been recorded.
- Surrey report that the decrease can be explained by more accurate recording practices, resulting in fewer extraneous cases being recorded.
- West Yorkshire report that the drop in the number of outcomes recorded can be explained by the impact of coronavirus, with courts being closed causing a backlog of cases. *an asterisk indicates that percentage changes have been suppressed for cases under 50
Key Question – Why is there a fall in the volume of fraud offences sent to police forces for investigation?
The NFIB advise that a number of factors have influenced the fall in fraud disseminations. There was a reduction of capacity within the NFIB to review cases for possible referral to forces for investigation. The NFIB adopted a more qualitative approach to referring cases and placed an increased concentration on cases thought to be related to organised crime.
At the same time, additional resources have been developed to protect victims through advice and referral to tailored support organisations and disruption of enablers. This includes cases where there was no possibility of completing a successful investigation and such activity will not be reflected in the statistics reported here.
As a result of the Covid-19 pandemic, courts have been closed for some periods, while there have been reports of Action Fraud increasing their recordings at quieter lockdown periods. Caution is needed when comparing figures for this year to previous years.
5 Further Information
References
The Home Office (2017), “[Crime outcomes in England and Wales 2016 to 2017[(https://www.gov.uk/government/statistics/crime-outcomes-in-england-and-wales-2016-to-2017)”, and subsequent quarterly data tables.
Office for National Statistics (2018), “Crime in England and Wales: Year ending March 2018”. Available at: Crime and justice.
Office for National Statistics (2017), “User Guide to Crime Statistics for England and Wales”.
UK Statistics Authority (2014) “Assessment Report 268”.
Important Information
Before April 2013, official statistics about how the police deal with crimes focused narrowly on ‘detections’ (the number of cases resolved with a formal or informal criminal justice outcome). In April 2013, the Home Office introduced the new outcomes framework and changed the presentation of its crime outcomes statistics.
From April 2014 onwards, police forces have supplied data to the Home Office on a broader set of outcomes including those that do not result in a formal or informal criminal justice outcome. The year to March 2014 bulletin [footnote 7] , published in July 2014, showed the first provisional statistics from the new outcomes framework. We have since developed the statistics with input from police forces and users.
We continue to ensure that these police recorded crime outcomes statistics are:
-
meeting identified user needs, including providing new analysis and greater transparency
-
well explained and readily accessible
-
produced according to sound methods
-
managed impartially and objectively in the public interest
The statistics in this bulletin are designated as Official Statistics as in January 2014, the UK Statistics Authority found that police recorded crime statistics did not meet the required standard for designation as National Statistics. The full assessment report against the Code of Practice for Official Statistics can be found on the UK Statistics Authority.
In July 2014, the Home Office Chief Statistician and the UK Statistics Authority Head of Assessment agreed to badge the year to March 2014 Crime Outcomes bulletin as Official Statistics, rather than National Statistics. This reflects the move to the new outcomes framework, and also the possibility that outcomes data are affected by similar issues to those that led to the de-designation of police recorded crime statistics.
Correspondence relating to de-designation are available:
Letter from David Blunt to Ed Humpherson
Letter from Ed Humpherson to David Blunt
It is our intention that the statistics will be assessed with a view to them gaining National Statistics status in due course.
Previous Releases
Previous editions of this bulletin included a chapter analysing outcomes for domestic abuse related offences. This has not been produced for this edition as it is our intention for it to be included in the cross-government compendium on Domestic Abuse due to be released by the Office for National Statistics in November 2021.
Previous editions of “Crime Outcomes in England and Wales” bulletins, are available from: Crime outcomes in England and Wales statistics
Copies of other Home Office publications (including crime statistics releases prior to April 2012) are available from: Crime statistics.
Copies of crime statistics publications from April 2012 are available from the Office for National Statistics website: Crime and justice.
This includes the User Guide to Crime Statistics, a useful reference guide with explanatory notes regarding the issues and classifications that are key to the production and presentation of the crime statistics.
Contact Details
For further information about crime outcomes statistics, please email:
CrimeandPoliceStats@homeoffice.gov.uk or write to:
Crime and Policing Statistics
5th Floor
Fry Building
2 Marsham Street
London
SW1P 4DF
Home Office Responsible Statistician
John Flatley, Programme Director of Crime and Policing Statistics
Contact via CrimeandPoliceStats@homeoffice.gov.uk