Crime against businesses: headline findings from the 2012 Commercial Victimisation Survey
Published 24 January 2013

© Crown copyright 2013
This publication is licensed under the terms of the Open Government Licence v3.0 except where otherwise stated. To view this licence, visit nationalarchives.gov.uk/doc/open-government-licence/version/3 or write to the Information Policy Team, The National Archives, Kew, London TW9 4DU, or email: psi@nationalarchives.gov.uk.
Where we have identified any third party copyright information you will need to obtain permission from the copyright holders concerned.
This publication is available at https://www.gov.uk/government/statistics/crime-against-businesses-headline-findings-from-the-2012-commercial-victimisation-survey--2/crime-against-businesses-headline-findings-from-the-2012-commercial-victimisation-survey
The Commercial Victimisation Survey (CVS) was previously run in 1994 and 2002, and is planned to be repeated in 2013 and 2014. This release is produced to the highest professional standards by statisticians in accordance with the Home Office’s Statement of Compliance with the Code of Practice for Official Statistics.
This is the first release of data from the 2012 CVS, which examines the extent of crime against businesses in England and Wales. The CVS was previously run in 1994 and 2002, and is planned to be repeated in 2013 and 2014.
Data tables are available for the following topics:
- Methodology tables (MS Excel Spreadsheet, 26KB)
- Crime against businesses headline findings tables (MS Excel Spreadsheet, 126KB)
- Alternative measures tables (MS Excel Spreadsheet, 60KB)
As this is the first publication in the current series, findings are published in both HTML and PDF format (all tables are solely available online at the links above), and user views are welcomed on the preferred publication format.
Future editions of this release will be published on dates announced via the UK Statistics Authority’s Publication Hub: Release Calendar.
For further information about measures of crime against businesses from the CVS, please email: crimestats@homeoffice.gov.uk or write to:
Home Office Statistics
5th Floor, Peel Building
2 Marsham Street
London, SW1P 4DF
1. Methodology
1.1 Introduction
The 2012 CVS is the first of a new series of Home Office surveys covering crime against businesses, with plans to repeat the survey in 2013 and 2014.
The CVS was a recommendation from the National Statistician’s review of crime statistics to address the significant gap in crime statistics that existed for crimes against businesses. These are not covered by either of the two main sources of data on crime: the Crime Survey for England and Wales (CSEW) and crimes recorded by the police, both of which are published by the Office for National Statistics (ONS). While police recorded crime does include crimes against businesses, it does not separate these out from other crimes (other than for offences such as shoplifting which, by its nature, is against businesses) and also only includes those crimes that are reported to, and recorded by, the police. The CSEW is a survey of crime against households and individuals living in those households and so does not cover crime against businesses at all.
Findings from the 2012 CVS have been incorporated into the latest quarterly crime statistics, Crime in England and Wales, publication by ONS alongside results from the CSEW and police recorded crime.
1.2 Key facts
- The CVS is a telephone survey in which respondents from a representative sample of business premises in England and Wales were asked about crimes experienced at their premises in the 12 months prior to interview.
- Estimates for the 2012 CVS are based on 4,017 interviews with respondents at premises in the manufacturing, wholesale and retail, transportation and storage, and accommodation and food industry sectors.
- Fieldwork was carried out between August and November 2012 and the survey achieved a response rate of 54%.
1.3 Data tables
Final fieldwork figures, giving the number of interviews by sector and business size, can be found in the 2012 CVS methodology tables (MS Excel Spreadsheet, 26KB).
1.4 Sample and survey coverage
The 2012 CVS focussed on four industry sectors defined by the UK Standard Industrial Classification 2007 (SIC). These were sections C (manufacturing), G (wholesale and retail trade), H (transportation and storage) and I (accommodation and food services activities). Between them, these four sectors account for around a third of all business premises in England and Wales.
The survey was designed to measure crime at the premises rather than the enterprise level (ie a single outlet of a national chain would have been sampled rather than the entire business entity). As such, only crimes that were directly against the specific sampled premises were in scope. To be representative at the premises level, the sample was also designed so that multiple premises in the same enterprise could be sampled.
The sample was drawn from the Interdepartmental Business Register (IDBR), a list of UK businesses covering 99% of UK economic activity which is maintained by ONS and widely used as a sample frame for national surveys of businesses. Companies are included on the IDBR if they are registered with HMRC for VAT purposes, operate a PAYE scheme, or are registered at Companies House. In practice, the VAT registration threshold means that all companies in the UK with a turnover of taxable goods and services over £77,000 p.a. were included in the sample.
The sample was stratified by size and industry sector to ensure that there were an adequate number of interviews for analysis of different sized businesses within each sector. However, as the survey was designed to produce national estimates, there was no geographic stratification and therefore the sample size is too small to produce sub-national estimates.
1.5 Fieldwork
The 2012 CVS was conducted as a series of telephone interviews with respondents between August and November 2012. Premises were first contacted to identify the appropriate respondent for the interview, which was generally the person responsible for security and crime-related issues at the premises. Respondents were then sent an ‘Experience of crime’ sheet before being contacted for interview which detailed the information that would be requested by the interviewer, allowing them time to gather and make note of required information relating to the extent of crime against their premises in advance.
Estimates for the 2012 CVS are based on a total of 4,017 interviews, with around 1,000 in each of the four sectors covered by the survey. The final main stage of the survey had an overall response rate of 54%, which is considered high for a voluntary survey of businesses. Further information on response rates and reasons for non-response will be included in the forthcoming technical report on the survey to be published later in the year.
Target and achieved number of interviews, 2012 CVS
| Sector | Target number of interviews | Achieved interviews |
|---|---|---|
| Manufacturing | 1,000 | 962 |
| Wholesale and retail | 1,000 | 1,021 |
| Transportation and storage | 1,000 | 879 |
| Accommodation and food | 1,000 | 1,155 |
| Total | 4,000 | 4,017 |
1.6 Questionnaire structure
Respondents were asked whether the business at the current premises had experienced a range of crimes in the 12 months prior to interview. If so, they were then asked how many crimes of each type had been experienced in the same 12-month period. 5% of businesses had been at their current premises for less than 12 months and in these cases they were asked only about crimes experienced since they had moved to their current premises.
Respondents were also asked a number of questions about the circumstances of the crimes experienced, some of which (such as reporting the incident to the police and whether they thought the incident had been carried out by an organised group of criminals) are reported here. Where business premises had experienced more than one incident of a particular crime type in the last 12 months, they were asked about the circumstances of only the most recent incident.
As well as the range of core offences covered by the survey, the CVS questionnaire also includes a module asking about experience of online crime and another asking about crime prevention. Around half of the sample was randomly assigned to answer questions from the online crime module and the other half the crime prevention module. As information on experience of online crime is only available for half the sample, and there is a risk of double-counting these with other crime types (eg theft and online theft), incidents of online crime are not included in the overall count of CVS crime, but are presented separately.
Respondents were also asked about other crime-related issues at the sampled premises, such as experience of anti-social behaviour and contact with the police. These and other topics from the survey will be included in a more detailed publication of the CVS data, which is intended for publication later in 2013.
1.7 Analysis
Prior to analysis of the survey data, a number of modifications were carried out on the data. The methodology below will be reviewed against future data to assess its effect across more than one year of data.
Weighting
Data are weighted to take account of both non-response and the stratification of the original sample. Non-response is a result of either being unable to identify contact details for sampled business premises or from contacted premises being unwilling to take part in the survey. Weighting accounts for stratification by ensuring that the sample is representative of businesses in these four sectors in England and Wales as a whole.
Data cleaning
The nature of crime against businesses means that it is possible that a small number of premises may have experienced a volume of crime that has a disproportionately large effect on figures for the sample as a whole, which would make comparison of trends over time problematic. To prevent a small number of sampled premises having an excessive influence on overall figures, the data were assessed to identify any outliers. Within this, one case was identified where the numbers of crimes reported were so large that it was judged that they were very likely to be erroneous or that the respondent had misunderstood some questions (for example, they had given the number or value of items stolen rather than the number of incidents of theft). This case was removed from the dataset due to the indication of widespread errors in the data.
Further to this one case, the data were examined for other outlier values in terms of the number of incidents reported by a respondent. A process of incident capping is used in other crime surveys (for example, the CSEW in effect caps the number of incidents that can be experienced by one respondent at 30). However, for the CVS a more detailed approach is needed to account for the wide variation in the type of premises in the sample and the crime types covered. For example, it would be wrong to set a single cap across the whole survey as incidents of theft by a customer against a large retailer would be expected to occur much more often than incidents of burglary.
A statistical measure known as Cook’s distance was used as a measure of whether data points were outliers. A high Cook’s distance indicates that a data point has a large effect on the mean. For each crime type, any data points within a particular sector and size band that had a Cook’s distance greater than 10 and that were substantially higher than the mean number of incidents experienced by respondents in the same sector and size band (ie more than 30 times the square root of the mean) were identified as outliers.
Across the 4,017 remaining interviews and the 14 crime types covered by the survey (a total of 56,238 figures supplied on numbers of crimes experienced), a total of 32 figures (0.06%) were identified as outliers. These were then set to the mean number of incidents experienced by victims within the same sector and size band.
Imputation of missing data
A small number of respondents to the survey said that they did not know if their business had been a victim of a particular type of crime at all in the previous 12 months. In these cases, values were imputed as the mean number of incidents experienced by the other business premises in the same industry sector and size band. Where this was less than 1, these cases were classed as non-victims for the purpose of calculating prevalence rates; where this was 1 or more, they were classed as victims.
Of the 56,238 responses to the number of crimes experienced, a total of 271 (0.5%) were imputed.
1.8 Interpretation of results
When interpreting the results presented in this publication, some consideration should be given to various issues around the structure of the survey and of business premises in England and Wales.
Coverage
As outlined above, the 2012 CVS focussed on business premises in four industry sectors: manufacturing, wholesale and retail, transportation and storage, and accommodation and food. The features of these particular sectors are very different from each other and from business premises in other sectors. Therefore, the results of the survey should not be considered to be representative of crime against businesses as a whole, only of crime against these four sectors.
The CVS is a premises-based survey and many businesses will operate at, or own, a number of different premises. It is important to bear this in mind when considering the results of the survey. In addition, where results are presented by premises size (measured by the number of employees at the premises), it should be remembered that this relates to the number of employees employed at that particular premises, and not in the business as a whole.
Similarly, while the CVS is intended to complement existing sources of information on crime, such as the CSEW, consideration of the methodology and coverage of the surveys means that it is not possible to combine the results from the two to obtain a ‘total’ count of crime. Differences in definitions and methodology between the two surveys mean figures are not directly comparable. In addition, as stated above, the CVS does not intend to give a full count of crime against all businesses, only against those in the sectors covered. There may also be a small amount of double counting between the two surveys, particularly in cases of robbery and assaults and threats.
Rates and numbers
Numbers of crimes are presented for premises in each sector and for different sized premises within each sector. These numbers are produced by grossing up weighted data from the survey sample to the total number of business premises in each sector and size band combination in England and Wales as a whole. Therefore, care should be taken when comparing levels of crime between sectors, or when comparing different premises sizes due to differences in the number of such premises in the country as a whole.
For example, the wholesale and retail sector is the largest of those covered by the CVS, with survey estimates grossed to around 390,000 premises in England and Wales, whereas survey estimates for the accommodation and food sector are grossed to a total of 130,000, manufacturing to 110,000 and transportation and accommodation to 60,000 premises. A greater number of crimes against the wholesale and retail sector would therefore be expected as it accounts for more premises than the other three sectors combined.
For this reason, when making comparisons between different types of business premises, either by sector or by size, it is better to compare the rates of crime between these premises, which control for the different number of premises in each category.
Reporting rates and organised crime
As well as rates and numbers for the main crime types covered by the CVS, figures are also presented here on reporting rates (the proportion of incidents of crime reported to the police) and organised crime. These figures are based on the most recent incident of each crime type that occurred in the last 12 months. Due to the relatively low number of premises that had experienced crimes it has not been possible to present these data by the different industry sectors or premises size. It is also not possible to show percentages for combined crime groups (eg all burglary, all theft) as the questions on reporting and organised crime are asked only of the most recent incident experienced and this cannot be identified across these groups. For example, where a respondent has experienced theft by a customer and theft by an employee, it is not possible to identify which of these was the most recent and therefore produce a figure for the most recent incident of theft.
1.9 Other data sources
Figures on the numbers of crimes, numbers of victims and incidence and prevalence rates from the 2012 CVS are available online in the crime against business premises section.
Figures on online crime, metal theft and rates of reporting to the police are available online in the alternative measures of crime and reporting rates section.
2. Crime against business premises
2.1 Introduction
Respondents to the 2012 CVS were asked if the business at their current premises had experienced any of a range of crime types in the 12 months prior to interview and, if so, how many incidents of crime had been experienced.
2.2 Key facts
- There were 9.2 million crimes against the four sectors covered by the 2012 CVS in the year prior to interview. The majority of these (7.7 million) were experienced by premises in the wholesale and retail sector, which is the largest of the four sectors covered.
- Premises in the wholesale and retail sector also experienced the highest rate of crime of the sectors (19,701 incidents per 1,000 premises) covered in the survey, mostly driven by shoplifting offences. There were a total of 4.1 million incidents of shoplifting estimated from the survey, almost half the total number of crimes across all four sectors covered by the survey.
- Manufacturing premises experienced relatively low rates of crime across all crime types compared with other sectors.
- Transportation and storage premises had the highest rate of vehicle-related theft (506 incidents per 1,000 premises over the year).
- Accommodation and food premises experienced the highest rate of assaults and threats (2,073 incidents per 1,000 premises over the year).
2.3 Data tables
Figures on the number of incidents, incidence rates, number of victims and prevalence rates by sector and business size, can be found in the Crime against businesses headline findings tables (MS Excel Spreadsheet, 126KB).
2.4 Overall extent of crime
Estimates from the 2012 CVS show that there were 9.2 million crimes against businesses in the four industry sectors covered by the survey in the 12 months prior to interview. This compares with 8.9 million incidents of crime against households estimated from the CSEW between October 2011 and September 2012. While figures from the two sources are not directly comparable, these results suggest that the CVS provides coverage of a large number of crimes that had previously not been included in crime statistics.
Almost half (46%) of premises covered by the survey had experienced at least one of the main crime types covered by the survey in the 12 months prior to interview.
Thefts were by far the most common type of crime experienced (6.8 million), making up 74% of all incidents of crime covered by the survey and were experienced by around a quarter of premises (24%).
The wholesale and retail sector is by far the largest of the four sectors covered by the survey in terms of the number of premises in England and Wales as a whole, and therefore the overall distribution of crime is heavily influenced by patterns of crime against this sector. The 7.7 million crimes experienced by the wholesale and retail sector represent 84% of all crimes covered by the survey.
Manufacturing premises experienced the lowest rates of crime overall (1,500 incidents per 1,000 premises) and wholesale and retail premises the highest (19,701 incidents per 1,000 premises). However, the high rate experienced by retailers was driven mainly by a very high rate of thefts (15,835 per 1,000 premises). Discounting this crime type, the rate of crime was similar between the wholesale and retail, transportation and storage, and accommodation and food sectors (Figure 1).
Unsurprisingly, the transportation and storage sector had the highest rate of vehicle-related theft (506 incidents per 1,000 premises), while the accommodation and food sector had the highest rate of assaults and threats (2,073 incidents per 1,000 premises).
Repeat victimisation (experiencing more than one incident of crime in a 12-month period) was high across the four sectors as a whole, although there was significant variation both between sectors and between crime types. Premises which were victims of crime each experienced an average of 29 incidents of crime in the 12 months prior to interview. The highest rate of repeat victimisation was for thefts by customers, with each victim of this crime type having experienced an average of 46 incidents in the 12 months prior to interview. Again, these patterns for the sample as a whole are likely to be heavily influenced by patterns of crime against the wholesale and retail sector.
Figure 1: Number of incidents of crime per 1,000 premises experienced in the last 12 months, by sector
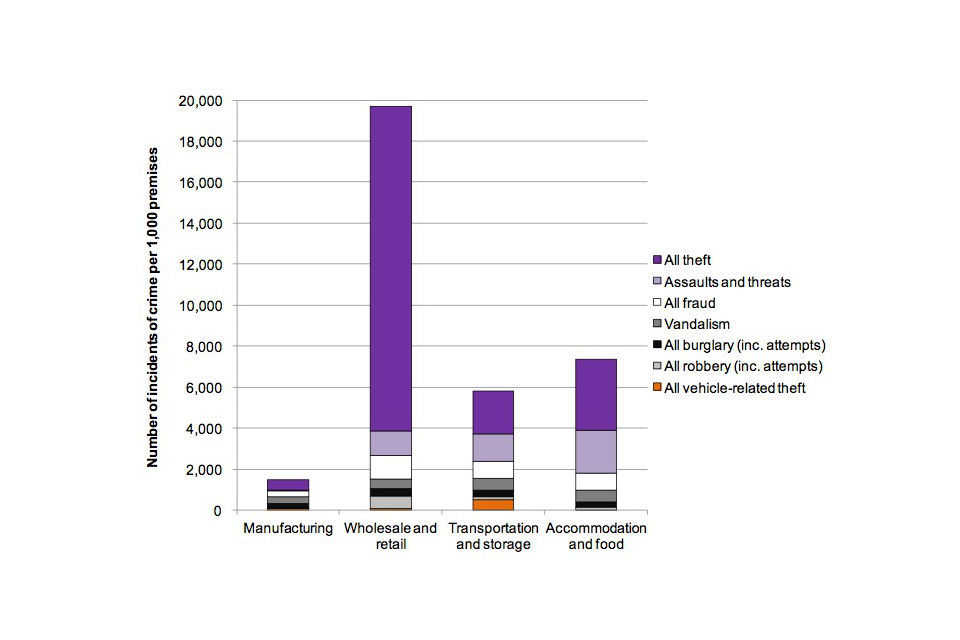
Figure 1: Number of incidents of crime per 1,000 premises experienced in the last 12 months, by sector
Chart notes:
Source: Home Office, 2012 CVS headline figures tables: Table T2.
2.5 Crime against manufacturing premises
| Number of incidents (000s) | Number of incidents per 1,000 premises | Number of victims (000s of premises) | % of premises experiencing | |
|---|---|---|---|---|
| All burglary (inc. attempts) | 29 | 266 | 14 | 13 |
| Vandalism | 35 | 324 | 13 | 11 |
| All vehicle related theft | 7 | 68 | 5 | 5 |
| All robbery (inc. attempts) | 2 | 16 | 1 | 1 |
| Assaults and thefts | 6 | 53 | 4 | 4 |
| All theft | 56 | 508 | 10 | 9 |
| All fraud | 29 | 264 | 5 | 5 |
| All CVS crime | 164 | 1,500 | 33 | 30 |
The table is a summary of the number of incidents, number of victims, incidence rates and prevalence rates for manufacturing premises. These data can be found in tables C1, C2, C3 and C4 of the 2012 CVS headline figures tables.
Manufacturing premises experienced around 164,000 crimes in the last 12 months. This represented both the lowest number and the lowest rate of crime (1,500 incidents per 1,000 premises) of all four sectors covered by the survey.
Victimisation was also less widespread in the manufacturing sector, with 30% of manufacturing premises having experienced at least one incident of crime, compared with an average of 46% across the survey as a whole. Premises were most likely to have been victims of burglary (14%), vandalism (13%) or theft (10%).
For the most part, these low incidence and low prevalence rates are reflected in a low rate of repeat victimisation against manufacturing premises, with each victim in this sector experiencing an average of five incidents of crime in the previous 12 months, compared with an average of 29 incidents across all four sectors. However, the rate of repeat victimisation was notably higher for incidents of theft by employees. This crime type had a low prevalence rate (2% of manufacturing premises had experienced theft by an employee) but relatively high incidence rate (283 incidents per 1,000 premises), meaning each victim had experienced an average of 15 incidents in the 12 months prior to interview.
Rates of crime generally increased with the number of employees at manufacturing premises, with those premises with 50 or more employees having a far greater rate of crime than those with fewer than 50. This difference in rates by premises size appears to be mainly driven by a much higher rate of fraud for premises with 50 or more employees (1,404 incidents per 1,000 premises) compared with those with 10-49 employees (56 incidents per 1,000 premises) and fewer than ten employees (216 incidents per 1,000 premises; Figure 2). Despite this, only 7% of manufacturing premises with 50 or more employees had experienced fraud in the last year, suggesting that rather than fraud being widespread among large manufacturing premises, the high rate of fraud against this group of premises is due to a small number of premises experiencing a relatively large number of incidents of fraud.
Figure 2: Number of incidents of crime per 1,000 premises experienced by the manufacturing sector in the last 12 months, by number of employees at premises
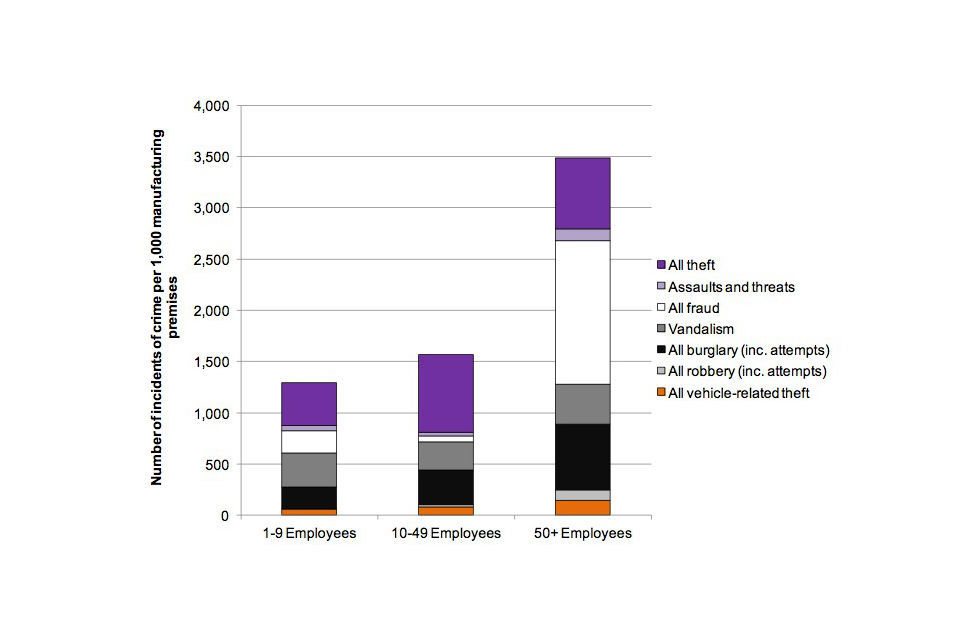
Figure 2: Number of incidents of crime per 1,000 premises experienced by the manufacturing sector in the last 12 months, by number of employees at premises
The chart shows incidence rates against premises in the manufacturing sector, broken down by crime type and by number of employees at premises. The rate for all CVS crime by size in the manufacturing sector is 1,294 incidents per 1,000 premises with 1-9 employees, 1,568 incidents per 1,000 premises with 10-49 employees, and 3,483 incidents per 1,000 premises with 50 or more employees.
Chart notes:
Source: Home Office, 2012 CVS headline figures tables: Table C2.
2.6 Crime against wholesale and retail premises
| Number of incidents (000s) | Number of incidents per 1,000 premises | Number of victims (000s of premises) | % of premises experiencing | |
|---|---|---|---|---|
| All burglary (inc. attempts) | 132 | 377 | 45 | 12 |
| Vandalism | 190 | 484 | 62 | 16 |
| All vehicle related theft | 28 | 71 | 17 | 4 |
| All robbery (inc. attempts) | 248 | 633 | 11 | 3 |
| Assaults and thefts | 459 | 1,174 | 40 | 10 |
| All theft | 6,196 | 15,835 | 123 | 13 |
| All fraud | 456 | 1,167 | 49 | 13 |
| All CVS crime | 7,708 | 19,701 | 206 | 53 |
The table is a summary of the number of incidents, number of victims, incidence rates and prevalence rates for wholesale and retail premises. These data can be found in tables G1, G2, G3 and G4 of the 2012 CVS headline figures tables.
There were around 7.7 million crimes against wholesale and retail premises in the last year. The vast majority of these (80%) were incidents of theft, and particularly thefts by customers (ie shoplifting, making up 53% of all incidents against wholesale and retail premises). In fact, thefts by customers against wholesale and retail premises made up 45% of all incidents of crime covered by the survey.
While this may partly be due to the wholesale and retail sector being the largest sector in the survey in terms of the number of premises in England and Wales, wholesale and retail premises also experienced the highest rate of theft of all four sectors (15,835 per 1,000 premises). Although a much rarer offence, this sector also experienced the highest rate of robbery (633 per 1,000 premises over the year), indicating these premises are a particular target for acquisitive crime.
Victimisation was also fairly widespread in this sector, with over half (53%) of wholesale and retail premises having experienced at least one incident of crime in the 12 months prior to interview and 21% having experienced at least one incident of theft by customers. However, compared with the large number of incidents of crime, these prevalence rates are relatively low, indicating a large degree of repeat victimisation. Indeed, thefts by customers against premises in the wholesale and retail sector showed the highest repeat victimisation rate in the whole survey, with each victim of this crime type in this sector experiencing an average of 49 incidents of theft by customers in the last year.
The wholesale and retail sector experienced high rates of repeat victimisation across other crime types, with victims in this sector experiencing an average of 37 incidents across all crime types, compared with an average of 29 incidents across all four sectors. However, overall rates against the wholesale and retail sector are heavily influenced by rates of theft by customers, being by far the largest individual crime type experienced by this sector.
The rate of crime against wholesale and retail premises increased substantially as the size of premises (determined by the number of employees) increased, driven mainly by an increased rate of theft (from 7,616 incidents per 1,000 premises with fewer than ten employees to 129,020 incidents per 1,000 premises with 50 or more employees). This suggests that, on average, premises in this sector with 50 or more employees each experienced around 11 thefts per month.
There were also differences in rates of fraud (894 compared to 10,630 per 1,000 premises) and assaults and threats (593 compared to 13,008 per 1,000 premises) between those premises with fewer than ten employees and those with 50 or more (Figure 3).
The increase in incidence rates for these crime types as premises size increases is also reflected in prevalence rates, with premises with 50 or more employees being more than twice as likely to be victims than those with fewer than ten employees for theft (59% compared with 27%), fraud (32% compared with 12%) and assaults and threats (30% compared with 8%). This suggests that these crime types are both more widespread and more frequent in larger premises.
The British Retail Consortium (BRC) Retail Crime Survey 2012 also shows that theft by customers makes up the majority of crime against retailers. The BRC survey includes estimates of the cost as well as the extent of crime. Data on cost are also collected in the CVS, and it is intended that these will be published later in the year.
When comparing results of the BRC survey with the CVS, users should bear in mind differences in methodology and coverage between the two surveys. CVS results are based on wholesalers as well as retailers, whereas the BRC survey covers only retailers, and those taking part in the survey are generally larger retailers. In addition, whereas the CVS is sampled at premises level, the BRC samples respondents at enterprise level and so differences may be due to incidents not being reported to head offices (for those retailers with head offices), or differences in recording practices at the premises and enterprise level.
Figure 3: Number of incidents of crime per 1,000 premises experienced by the wholesale and retail sector in the last 12 months, by number of employees at premises
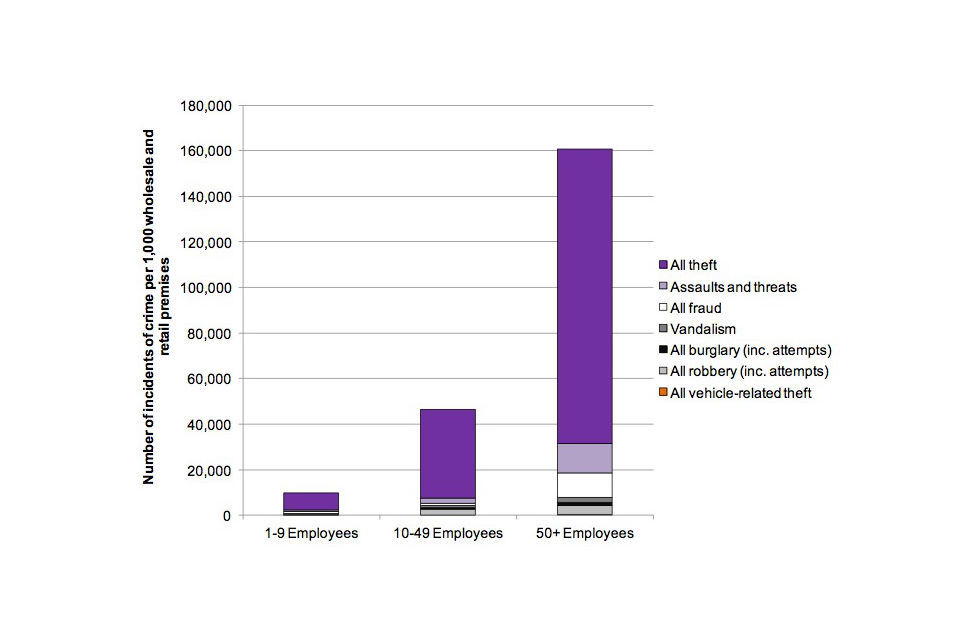
Figure 3: Number of incidents of crime per 1,000 premises experienced by the wholesale and retail sector in the last 12 months, by number of employees at premises
The chart shows incidence rates against premises in the wholesale and retail sector, broken down by crime type and by number of employees at premises. The rate for all CVS crime by size in the wholesale and retail sector is 1,294 incidents per 1,000 premises with 1-9 employees, 1,568 incidents per 1,000 premises with 10-49 employees, and 3,483 incidents per 1,000 premises with 50 or more employees.
Chart notes:
Source: Home Office, 2012 CVS headline figures tables: Table G2.
2.7 Comparisons with 2002 CVS
The wholesale and retail and manufacturing sectors were the only sectors included in both the 2002 and 2012 CVS. However, the composition of the manufacturing sector within SIC has changed considerably over that period and therefore it is not appropriate to compare this sector between the two surveys. Even among wholesale and retail premises, differences in methodology and some small differences in coverage mean that results between the two surveys are only broadly comparable; however, the general pattern appears to be that the level of crime against wholesale and retail premises has fallen since 2002.
In both 2002 and 2012, the crime type most frequently experienced by wholesale and retail premises was theft by customers, with 11.5 million of this type of incidents estimated in 2002 and 4.1 million in 2012. In both years, this was followed by theft by unknown persons, with 3.2 million incidents in 2002 and 1.8 million in 2012.
In addition, the proportion of wholesale and retail premises experiencing theft by customers (the crime most commonly experienced by wholesalers and retailers) fell from 43% to 21% between the 2002 and 2012 CVS. While numbers of incidents could be affected by changes in methodology between the two surveys, which mainly consist of the imputation of missing values and removal of outliers, or changes in the number of wholesale and retail premises in the country as a whole, prevalence rates are not affected by either of these. This therefore supports the notion that crime against this sector has fallen over the last decade.
Looking at other sources, between 2002/03 and 2011/12 the number of incidents of shoplifting recorded by the police has remained largely unchanged (from 310,881 in 2002/03 to 308,325 in 2011/12). However, it is clear from the discrepancy in figures between the CVS and police recorded crime that there is a large difference in measurement between the two sources. In addition, under-reporting by victims means that police recorded crime statistics don’t cover the full extent of this crime type (see alternative measures of crime and reporting rates.
2.8 Crime against transportation and storage premises
| Number of incidents (000s) | Number of incidents per 1,000 premises | Number of victims (000s of premises) | % of premises experiencing | |
|---|---|---|---|---|
| All burglary (inc. attempts) | 17 | 306 | 7 | 13 |
| Vandalism | 32 | 578 | 8 | 14 |
| All vehicle related theft | 28 | 506 | 8 | 14 |
| All robbery (inc. attempts) | 9 | 159 | 2 | 3 |
| Assaults and thefts | 73 | 1,320 | 5 | 10 |
| All theft | 118 | 2,118 | 8 | 15 |
| All fraud | 46 | 836 | 4 | 7 |
| All CVS crime | 324 | 5,824 | 22 | 40 |
The table is a summary of the number of incidents, number of victims, incidence rates and prevalence rates for transportation and storage premises. These data can be found in tables H1, H2, H3 and H4 of the 2012 CVS headline figures tables.
The transportation and storage sector includes businesses which transport both freight and passengers by road (including taxis) or by air, sea or rail.
The 2012 CVS shows that there were 324,000 crimes against premises in the transport and storage sector in the last year. As with other sectors, thefts were the most frequently experienced crime type, making up around a third of crimes against this sector (118,000 incidents; 36% of incidents against this sector).
The only crime type for which the transportation and storage sector experienced a notably higher rate than other sectors was vehicle-related theft (506 incidents per 1,000 premises compared with 96 per 1,000 premises across all four sectors). This is not surprising given that it would be expected that premises in this sector would make more use of vehicles than in other sectors.
Despite this, the overall number of vehicle-related thefts (28,000) made up only 9% of the total number of crimes experienced by premises in this sector, suggesting that although this sector experienced more of this crime type than others, the level experienced was still not particularly high when compared to other types of crime. The 14% of transportation and storage premises that experienced vehicle-related theft is similar to the proportion that experienced theft (15%), vandalism (14%) and/or burglary (13%).
As with other sectors, the highest crime rates were experienced by premises with 50 or more employees (17,884 incidents per 1,000 premises). There was little difference in the overall rate of crime between those premises with fewer than ten employees (4,939 incidents per 1,000 premises) and those with 10-49 employees (4,992 incidents per 1,000 premises).
This increase with business size was driven mainly by high rates against premises with 50 or more employees for assaults and threats (6,179 incidents per 1,000 premises), fraud (4,927 incidents per 1,000 premises) and vandalism (2,331 incidents per 1,000 premises) compared with smaller premises (Figure 4). For all three crime types, there was a corresponding increase in prevalence rates as premises size increased, indicating that these crimes were more widespread among larger premises as well as more frequent.
Figure 4: Number of incidents of crime per 1,000 premises experienced by the transportation and storage sector in the last 12 months, by number of employees at premises
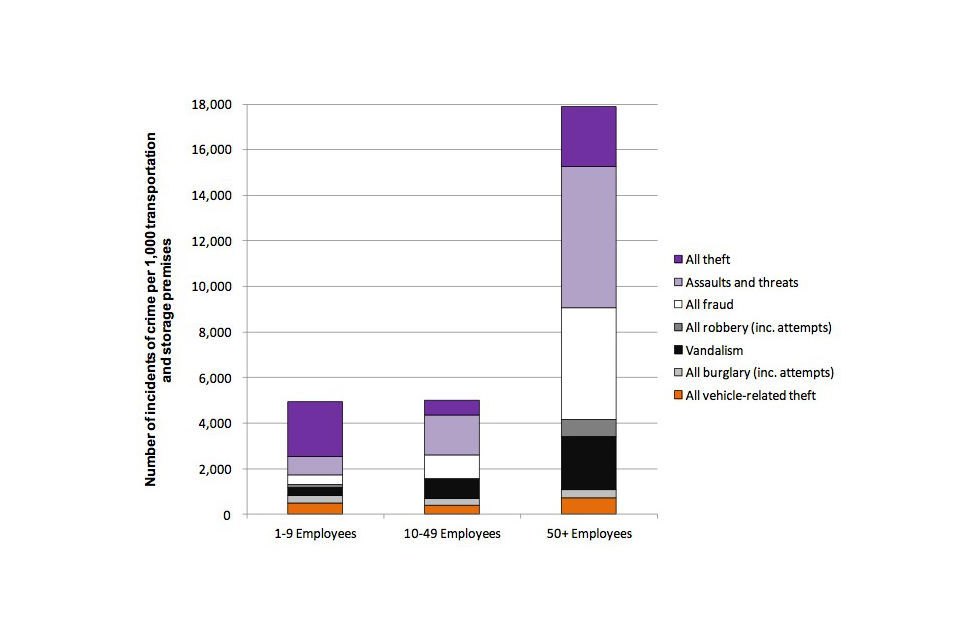
Figure 4: Number of incidents of crime per 1,000 premises experienced by the transportation and storage sector in the last 12 months, by number of employees at premises
Chart notes:
Source: Home Office, 2012 CVS headline figures tables: Table H2.
2.9 Crime against accommodation and food premises
| Number of incidents (000s) | Number of incidents per 1,000 premises | Number of victims (000s of premises) | % of premises experiencing | |
|---|---|---|---|---|
| All burglary (inc. attempts) | 36 | 270 | 19 | 14 |
| Vandalism | 76 | 569 | 23 | 17 |
| All vehicle related theft | 3 | 20 | 1 | 1 |
| All robbery (inc. attempts) | 16 | 122 | 2 | 2 |
| Assaults and thefts | 277 | 2,073 | 20 | 15 |
| All theft | 465 | 3,471 | 22 | 17 |
| All fraud | 122 | 835 | 13 | 10 |
| All CVS crime | 985 | 7,361 | 58 | 43 |
The table is a summary of the number of incidents, number of victims, incidence rates and prevalence rates for accommodation and food premises. These data can be found in tables I1, I2, I3 and I4 of the 2012 CVS headline figures tables.
The accommodation and food sector includes businesses such as hotels, restaurants, take-away food shops and licensed clubs, pubs and bars.
There were 985,000 crimes against accommodation and food premises in the last year, with thefts being the most common crime type, making up 47% of all incidents against this sector (465,000 incidents).
Compared with other sectors, accommodation and food premises experienced a relatively high rate of assaults and threats in the last year (2,073 per 1,000 premises compared with 1,182 per 1,000 premises across all four sectors). This is possibly due to employees in these premises having more contact with customers and members of the public than in other sectors and may also be related to the consumption of alcohol in many of these premises. This sector did not have notably high rates for any other crime type.
15% of premises in this sector had experienced at least one incident of assaults and threats in the 12 months prior to interview. This was the highest proportion of any sector, indicating that this crime type is also more widespread in this sector, as well as being more frequent. Overall, each premise that experienced assaults and threats last year experienced an average of 14 incidents in the 12 months prior to interview.
The rate of crime increased as the number of employees at premises increased; however, the difference in premises with 50 or more employees was less pronounced than in other sectors. The largest difference was between those premises with fewer than ten employees and those with 10-49 employees, driven mainly by an increase in the rate of thefts (1,506 compared to 8,037 incidents per 1,000 premises). The biggest increase between premises with 10-49 employees and those with 50 or more was in rates of fraud (1,120 compared to 2,818 incidents per 1,000 premises; Figure 5). Both of these differences in incidence rates had corresponding increases in prevalence, indicating that there was an increase in the proportion of larger premises affected as well as in the number of crimes against them.
Figure 5: Number of incidents of crime per 1,000 premises experienced by the accommodation and food sector in the last 12 months, by number of employees at premises
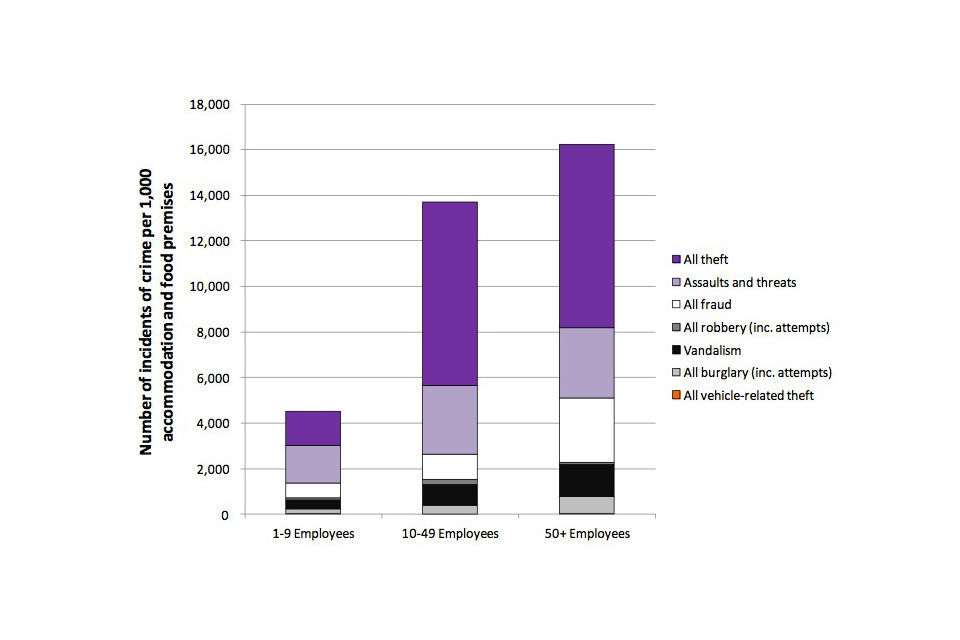
Figure 5: Number of incidents of crime per 1,000 premises experienced by the accommodation and food sector in the last 12 months, by number of employees at premises
Chart notes:
Source: Home Office, 2012 CVS headline figures tables: Table I2.
2.10 Other data sources
A description of the methodology and advice on interpreting results from the 2012 CVS are available online in the methodology section.
Figures on online crime, metal theft and rates of reporting to the police are available online in the alternative measures of crime and reporting rates section.
3. Alternative measures of crime and reporting rates
3.1 Introduction
As well as rates for the main crime types covered by the survey, the CVS also collects information on other crime types such as online crime, metal theft and organised crime. These, together with reporting rates for the main crime types, are presented here.
3.2 Key facts
- There were 180,000 incidents of online crime against businesses across the 4 industry sectors covered by the survey in the 12 months prior to interview, of which the vast majority (75%) were computer viruses (135,000).
- Premises in the manufacturing sector were most likely to have experienced a crime where the respondent thought that items were taken for their scrap metal value, with 14% of premises in this sector having experienced metal theft.
- When asked about the most recent incident of vehicle theft, around half (47%) of respondents thought that the crime was carried out by an organised group of criminals, the highest proportion of any crime type.
- Of all the crime types, incidents of vehicle theft were the most likely to be reported to the police. All incidents of this crime type that were experienced by business premises in the survey were reported to the police. Incidents of online crime were the least likely to be reported, with only 2% of incidents reported to the police.
3.3 Data tables
Estimates of online crime, metal theft, organised crime and reporting rates from the 2012 CVS can be found in the 2012 CVS alternative measures tables.
3.4 Online crime
Online crime covers a range of crime types carried out over computer networks. The CVS asks respondents about their experience of the following types of online crime:
- hacking: having a computer system accessed without permission;
- online theft of money: having money stolen electronically (eg through online banking);
- phishing: having money stolen after receiving fraudulent messages or being redirected to fake websites;
- online theft of information: having confidential information stolen electronically (such as staff or customer data);
- website vandalism: having a website defaced, damaged or taken down; and
- viruses: having computers infected with files or programmes intended to cause harm.
Incidents of online crime are not included in the overall count of CVS crime as these questions are only asked of half the sample and there is a risk of double-counting with other crime types, such as theft or fraud.
The 2012 CVS shows that there were 180,000 incidents of online crime against businesses in total in the 4 industry sectors covered by the survey in the 12 months prior to interview. The vast majority of these were computer viruses (135,000), which accounted for 3-quarters of all online crime. Overall, around 54,000 premises in the 4 sectors covered by the survey had experienced one or more incidents of online crime.
The low levels of other types of online crime estimated from the CVS may be because these crimes do not come to the attention of victims. For example, in the case of phishing, the offending email may be caught by spam filters, or victims may not know that their computer systems have been hacked. It may also be the case that many types of online crime are not picked up by the CVS as they do not affect businesses at the premises level. Some of these offences may be more likely to be focussed on head offices or corporate websites.
Across all 4 sectors, 8% of business premises experienced at least one type of online crime. Premises in the manufacturing sector were the most likely to have experienced online crime; however, these figures are based on a very small number of victims so may be prone to fluctuations in individual years.
When considering levels of online crime it should be noted that not all business premises use computers and so cannot become victims of online crime. Overall, computers were used by 80% of premises across all 4 sectors, with use highest in the manufacturing and transportation and storage sectors (92% and 91% respectively) and lower in the wholesale and retail and accommodation and food sectors (80% and 63% respectively).
When asked about their most recent incident of online crime, the majority of respondents (86%) believed that their systems were targeted remotely, for example by e-mail or hacking.
How victims of online crime perceived their systems were targeted across all 4 industry sectors
| Percentages | 2012 CVS, England and Wales |
|---|---|
| Targeted your system remotely eg by email or hacking | 86 |
| Physically accessed your computer at your premises | 2 |
| Don’t know | 12 |
| Unweighted base | 181 |
The table shows that across all 4 sectors 86% of respondents whose premises had been affected by online crime in the last 12 months thought their system had been targeted remotely, 2% thought the attacker had physically accessed a computer at the premises and 12% didn’t know how their systems were attacked.
Chart notes:
Source: Home Office.
3.5 Metal theft
In the context of the rising costs of metal in recent years, metal theft (where a metal item is stolen for its scrap metal value) has become an area of increasing concern. Anecdotal evidence suggests that this type of offence has risen in recent years. However, there is limited reliable information available on the extent of metal theft as it is not a separate offence in law and is therefore not separated out from other kinds of theft in police recorded crime statistics. With this in mind, questions on experience of metal theft were included in the CVS to provide more information on the extent of, and trends in, this type of crime.
CVS respondents were asked whether any metal items had been stolen from the premises in the last year that they suspected had been taken for their scrap metal value. This could include metal goods stored on the premises, scrap metal, lead from a roof, metal pipes, or any other metal fixtures. Respondents from premises in the manufacturing sector were most likely to suspect that they had been victims of metal theft (with 14% of premises experiencing metal theft), compared with the wholesale and retail sector (9%), transport and storage sector (9%) and the accommodation and food sector (8%).
Respondents who had experienced incidents of burglary with entry, robbery or thefts in the past year were also asked whether, in the most recent incident of that crime type, they suspected that any metal item taken was stolen for its scrap metal value. When asked about the latest incident of burglary and the latest incident of theft by others, around one in 6 respondents believed that metal items had been taken for their scrap metal value (17% and 16% respectively). This contrasts with incidents of theft by customers in which only 1% of respondents said this.
While these data provide more information on incidents of metal theft affecting businesses in the 4 sectors covered by the CVS, other types of organisations may experience metal theft more widely. For example, thefts of lead from church roofs and thefts of telecommunications equipment are thought to account for a large volume of metal theft, but may not be covered by the survey.
3.6 Overall reporting rates
The CVS asked those respondents who had experienced an incident of crime in the past year whether the police came to know about the most recent incident of each crime type.
The CVS showed that reporting rates varied considerably by the type of offence. Of all the crime types, incidents of vehicle theft were the most likely to be reported, with a 100% reporting rate according to the 2012 CVS. Incidents of burglary were also well reported with around 88% of incidents of burglary with entry and 60% of incidents of attempted burglary being reported to police. It is likely that, in cases of both vehicle theft and burglary with entry, high reporting rates are related to the need for victims to obtain a crime reference number from the police in order to make an insurance claim.
Reporting rates were comparatively low for crimes such as assaults and threats (where 34% of the most recent incidents were reported to the police), thefts by unknown persons and thefts by employees (32% and 27% respectively). Incidents of online crime were by far the least likely to be reported to the police (2%; Figure 1).
Figure 1: Proportion of incidents reported to the police across all 4 industry sectors, by crime type
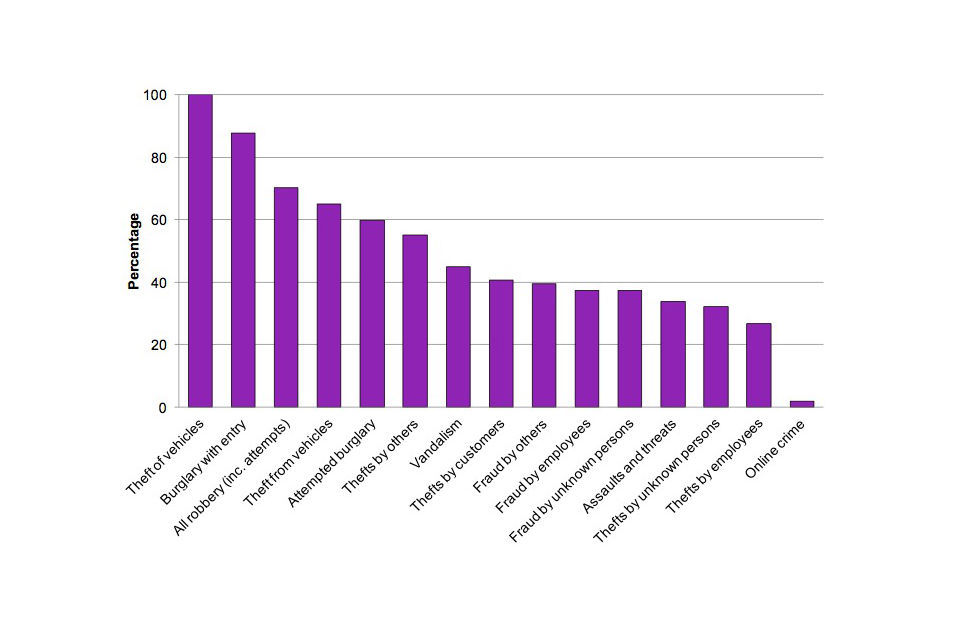
Figure 1: Proportion of incidents reported to the police across all four industry sectors, by crime type
The chart shows the proportion of incidents of crime reported to the police across all 4 sectors by crime type, from 100% for theft of vehicles to 2% for online crime.
Chart notes:
Source: Home Office, 2012 CVS alternative measures tables: Table A7.
Victims of crime who did not report the most recent incident of crime to the police were asked about their reasons for not reporting. The most frequently mentioned reason was that victims perceived the incident to be too trivial or there was no/trivial loss incurred. The frequency of this reason varied considerably by crime type. For example, for the most recent incident of vandalism, 47% of victims stated this as the reason for not reporting the crime, compared to 27% of victims of burglary.
Of those respondents who had experienced theft by employees, half of the respondents stated the reason for not reporting the most recent incident to the police was that they had dealt with the incident themselves (ie they felt it was inappropriate for the police or that the employee responsible either left, resigned or was dismissed). This compared to 14% of victims of theft by customers and 8% of victims of theft by unknown persons stating the same reason. Similarly, victims of fraud by employees who didn’t report the incident to the police were more likely to have dealt with the matter themselves (43%) than other types of fraud (Figure 2). Taken together, this suggests that businesses tend to deal with crimes committed by employees through their own internal processes, rather than by reporting the incident to the police.
Compared with other crime types, online crime was unusual in having relatively large proportions of respondents saying they didn’t report the incident to the police both because it was too trivial and because they dealt with it themselves. Given that the majority of incidents of online crime were computer viruses, this suggests the respondent was more focussed on removing the virus and correcting the effects than on reporting to the police.
Figure 2: Selected reasons for not reporting crime to police for selected crime types across all 4 industry sectors, by crime type
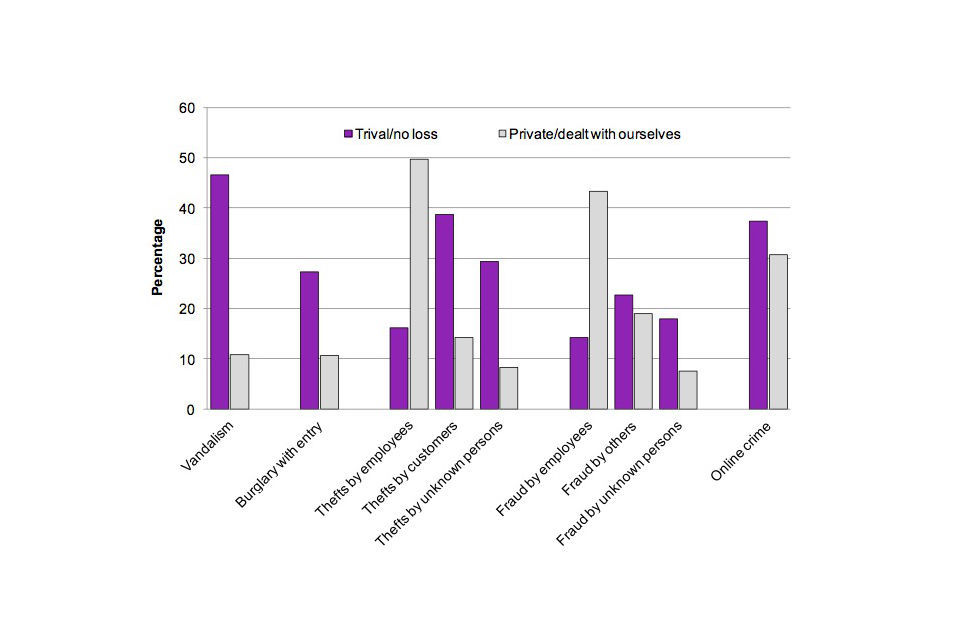
Figure 2: Selected reasons for not reporting crime to police for selected crime types across all four industry sectors, by crime type
The chart shows reasons why crime was not reported to the police across all 4 sectors by crime type for selected crimes.
Chart notes:
Source: Home Office, 2012 CVS alternative measures tables: Table A8.
Trivial/no loss includes: no loss or damage; and too trivial (loss was so small/very low value).
Private/dealt with ourselves includes: inappropriate for the police - dealt with matter ourselves; and employee responsible left/dismissed/resigned.
3.7 Organised crime
Organised crime is defined as crime which involves individuals, normally working with others, committing serious crime on a continuing basis. This usually includes elements of planning, control and coordination, and benefits those involved. The motivation is often, but not always, financial gain.
To provide information on this type of crime, respondents to the CVS who had experienced crime in the past year were asked whether they thought that the most recent incident of each crime type experienced was carried out by a loosely knit group, an organised group of criminals or someone working alone. Respondent perceptions of this varied considerably by the type of crime.
In the most recent incidents of thefts of vehicles, around half (47%) of respondents thought that the offence was carried out by an organised group of criminals. Just over a quarter of respondents thought an organised group of criminals committed the latest incidents of burglary and theft from vehicles (30% and 26% respectively).
The crime types least likely to be thought to have been carried out by an organised group of criminals were assaults and threats (3%), thefts by employees (0%) and fraud by employees (0%; Figure 3).
Figure 3: Proportion of incidents respondents perceived to have been carried out by an organised group of criminals across all 4 sectors, by crime type
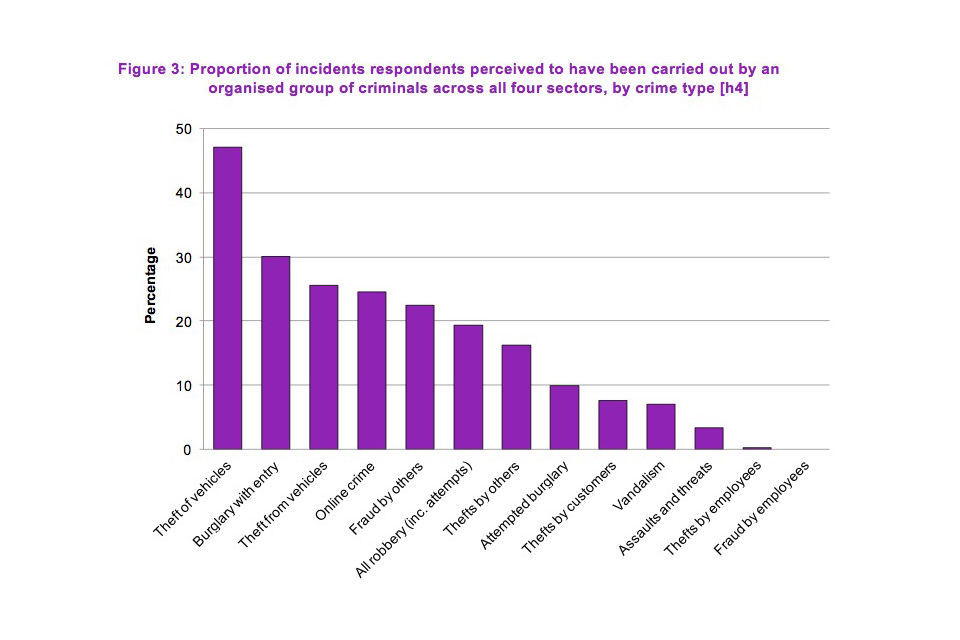
Figure 3: Proportion of incidents respondents perceived to have been carried out by an organised group of criminals across all four sectors, by crime type
The chart shows the proportion of incidents of crime reported to the police across all 4 sectors by crime type, from 100%for theft of vehicles to 2% for online crime.
Chart notes:
Source: Home Office, 2012 CVS alternative measures tables: Table A9.
3.8 Other data sources
A description of the methodology and advice on interpreting results from the 2012 CVS are available online in the methodology section.
Figures on the numbers of crimes, numbers of victims and incidence and prevalence rates from the 2012 CVS are available online in the crime against business premises section.