Country and regional analysis: November 2025
Published 19 November 2025

© Crown copyright 2025
This publication is licensed under the terms of the Open Government Licence v3.0 except where otherwise stated. To view this licence, visit nationalarchives.gov.uk/doc/open-government-licence/version/3 or write to the Information Policy Team, The National Archives, Kew, London TW9 4DU, or email: psi@nationalarchives.gov.uk.
Where we have identified any third party copyright information you will need to obtain permission from the copyright holders concerned.
This publication is available at https://www.gov.uk/government/statistics/country-and-regional-analysis-2025/country-and-regional-analysis-november-2025
Data summary 2024-25
| UK identifiable expenditure | |
|---|---|
| England | £770 billion |
| Scotland | £86 billion |
| Wales | £48 billion |
| Northern Ireland | £31 billion |
| Total | £936 billion |
The Coronavirus (Covid-19) pandemic, together with measures taken in response to increases in the cost of living, have affected the statistics across the time series available in the Country and Regional Analysis (CRA). We therefore recommend caution when comparing data across the time period covered by this release. Previous editions of the CRA set out the effect these had on the country and regional breakdowns and specific functions.
Population figures used in the CRA are based on the most up-to-date data available. England, Wales and Northern Ireland mid-year population estimates are consistent with the 2021 Census for all years. Scotland mid-year population estimates are consistent with the 2022 Scottish Census for all years. Further details can be found in the population section of this release.
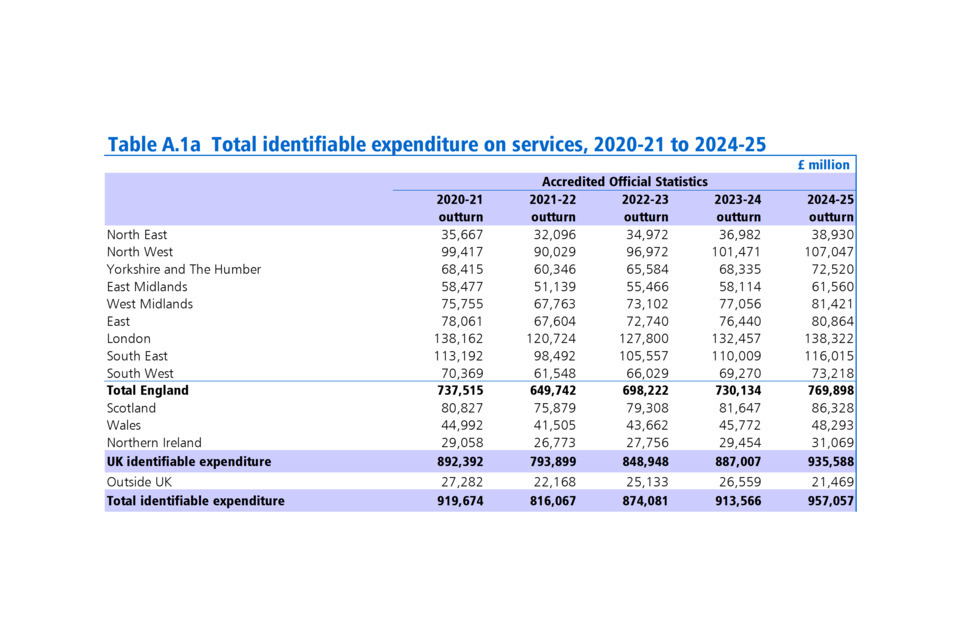
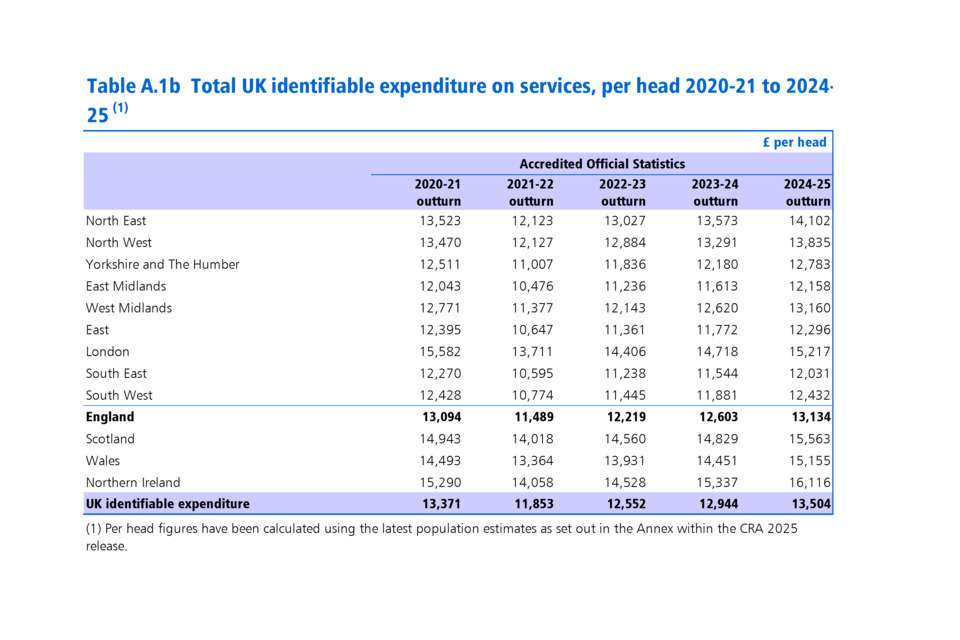
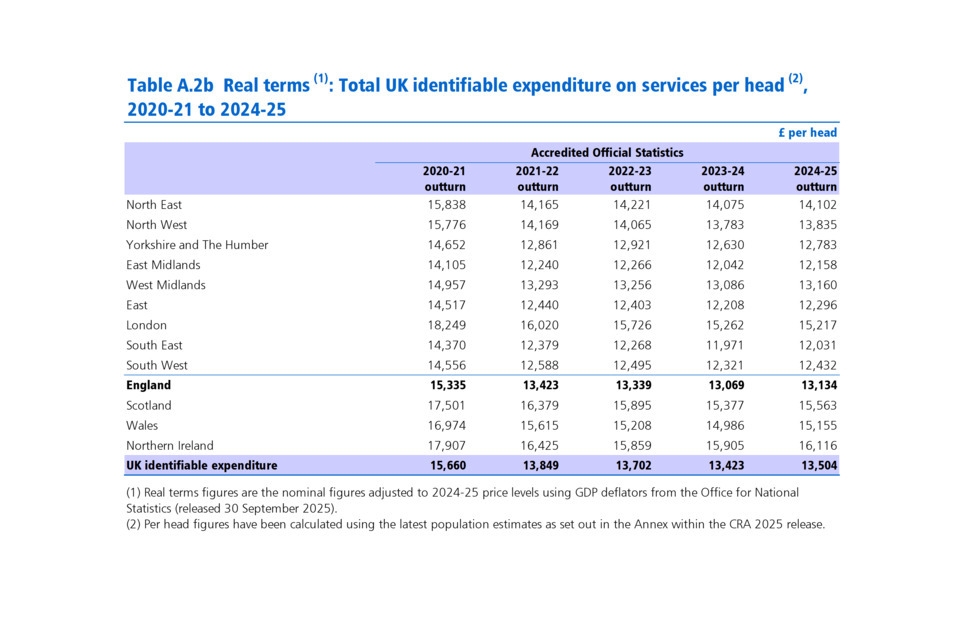
In 2024-25 UK identifiable spend (i.e. spending that can be identified as having been for the benefit of a particular area of the UK) increased to £935.6 billion from £887.0 billion the year before. On a per head basis [footnote 1] total UK expenditure rose by £560 between 2023-24 and 2024-25. Northern Ireland had the highest spend per head at £16,116, followed by Scotland at £15,563. England had the lowest spend per head at £13,134. Non-identifiable expenditure (i.e. spend which is deemed to be on behalf of the UK as a whole), increased by just under £6 billion in 2024-25, compared to the previous year.
| Spend per head (£) | |
|---|---|
| England | £13,134 |
| Scotland | £15,563 |
| Wales | £15,155 |
| Northern Ireland | £16,116 |
| UK average | £13,504 |
Regional Statistics
In 2024-25 English regions showed a broadly similar percentage of identifiable expenditure as in 2023-24. London accounted for £138 billion of total identifiable spend, the highest in England at 14% of the UK total. This was followed by the South East at 12% and the North West at 11% (Table A.1a).
Identifiable expenditure by English regions, 2024-25 (£billions)
| Identifiable expenditure by English regions (£billions) | |
|---|---|
| North East | £38.9 |
| North West | £107.0 |
| Yorkshire and the Humber | £72.5 |
| East Midlands | £61.6 |
| West Midlands | £81.4 |
| East | £80.9 |
| London | £138.3 |
| South East | £116.0 |
| South West | £73.2 |
Spend per head
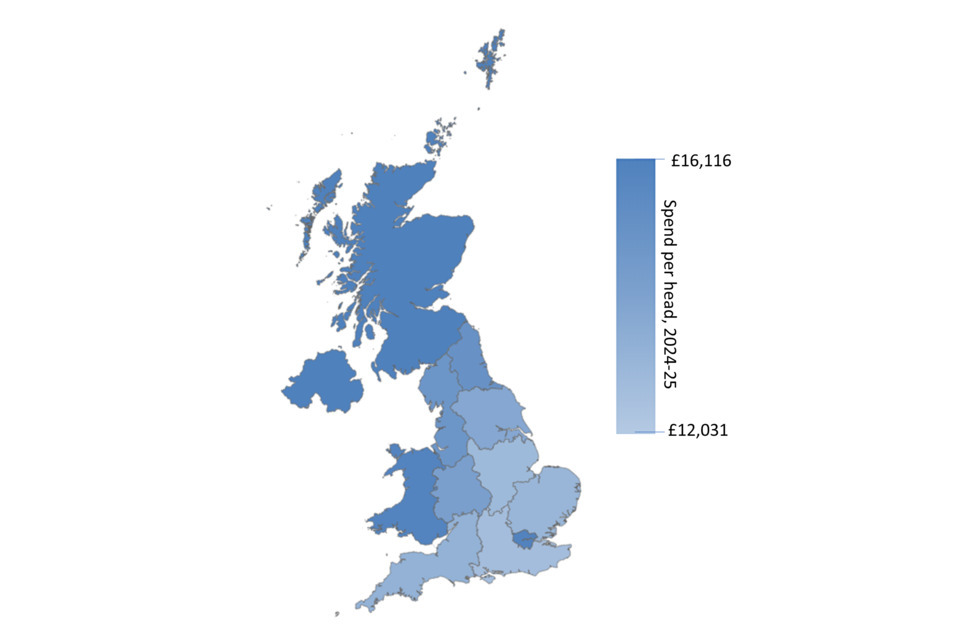
Expenditure per head provides a more accurate picture of regional differences, as it accounts for population size. Spend in London has historically been higher compared to other English regions partly due to the fact that for many functions it is more expensive to provide services in the capital, due to higher staff and infrastructure costs. In addition, London has historically had high capital expenditure, as it includes spend by Transport for London (TfL). Part of this spend will also benefit commuters who live outside London but who use TfL services while commuting. The lowest total spend per head was in the South East at £12,031 per head followed by the East Midlands at £12,158 (Table A.1b). Looking at current spending only, i.e. recurring spend on providing public services, such as wages and salaries and benefits (Table A.3b), the lowest spend per head was in the South East at £10,791, followed by the East and East Midlands at £10,899 and £11,094 respectively. The English regions with the highest current spend per head were London at £13,117 and the North East at £12,801.
Spend per head, 2024-25
| Spend per head (£) | |
|---|---|
| North East | £14,102 |
| North West | £13,835 |
| Yorkshire and the Humber | £12,783 |
| East Midlands | £12,158 |
| West Midlands | £13,160 |
| East | £12,296 |
| London | £15,217 |
| South East | £12,031 |
| South West | £12,432 |
| England (average) | £13,134 |
| Scotland | £15,563 |
| Wales | £15,155 |
| Northern Ireland | £16,116 |
| UK (average) | £13,504 |
1. Data in this chart is taken from table A.1b of the main release.
About this release
-
This release presents analyses of public expenditure by country, region and function. Data in this release are Accredited Official Statistics for all years.
-
Users should note that the Country and Regional Analysis is a purely statistical exercise and plays no part in resource allocation or the operation of the Barnett Formula. The regional analyses and judgments about statistical methodology presented in this release do not constitute statements of government policy.
-
Most public spending is planned to benefit categories of individuals and enterprises irrespective of location. The regional analyses presented in this release show where the individuals and enterprises that benefited from public spending were located. It does not mean that all such spending was planned to benefit a particular region, because only a minority of public spending is planned on a regional basis.
Accredited Official Statistics
Accredited Official Statistics are official statistics that have been independently reviewed by the Office for Statistics Regulation (OSR) and confirmed to comply with the standards of trustworthiness, quality and value in the Code of Practice for Statistics. Accredited official statistics are called National Statistics in the Statistics and Registration Service Act 2007. These accredited official statistics were independently reviewed by the OSR in 2019. They comply with the standards of trustworthiness, quality and value in the Code of Practice for Statistics and should be labelled ‘accredited official statistics’.
Our statistical practice is regulated by the OSR, which sets the standards of trustworthiness, quality and value in the Code of Practice for Statistics that all producers of official statistics should adhere to. For further information, please see the explanation web page on the OSR website.
You are welcome to contact us directly with any comments about how we meet these standards. Alternatively, you can contact OSR by emailing regulation@statistics.gov.uk or via the OSR website.
New in this release
This is the first release of country and regional data for 2024-25. The accompanying explanatory notes set out the main methodological changes that have been introduced this year.
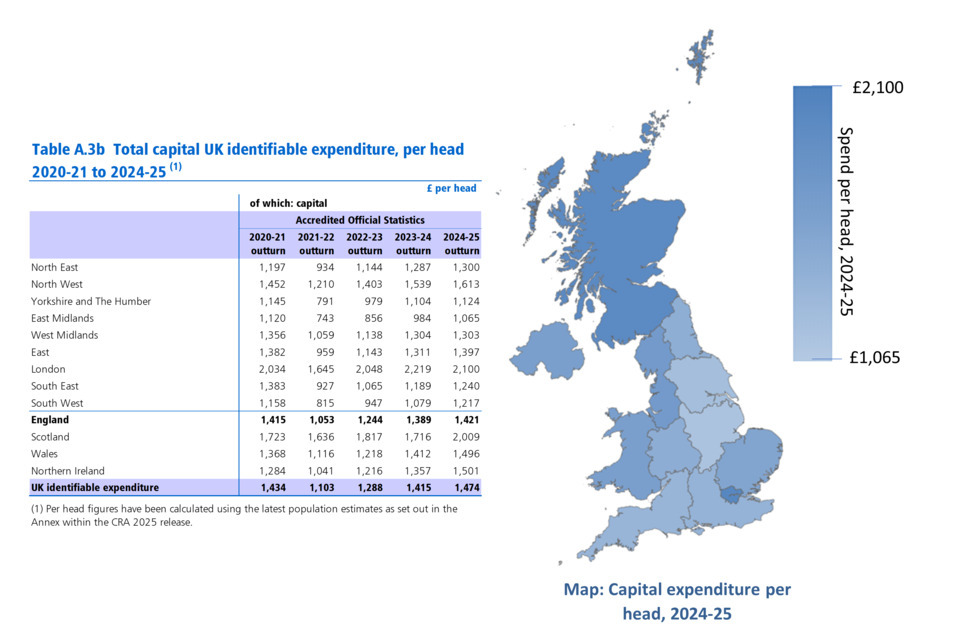
Table A.3b Total current and capital identifiable expenditure, per head 2020-21 to 2024-25

Maps based on Table A.16: UK identifiable expenditure by function, per head, indexed, 2024-25
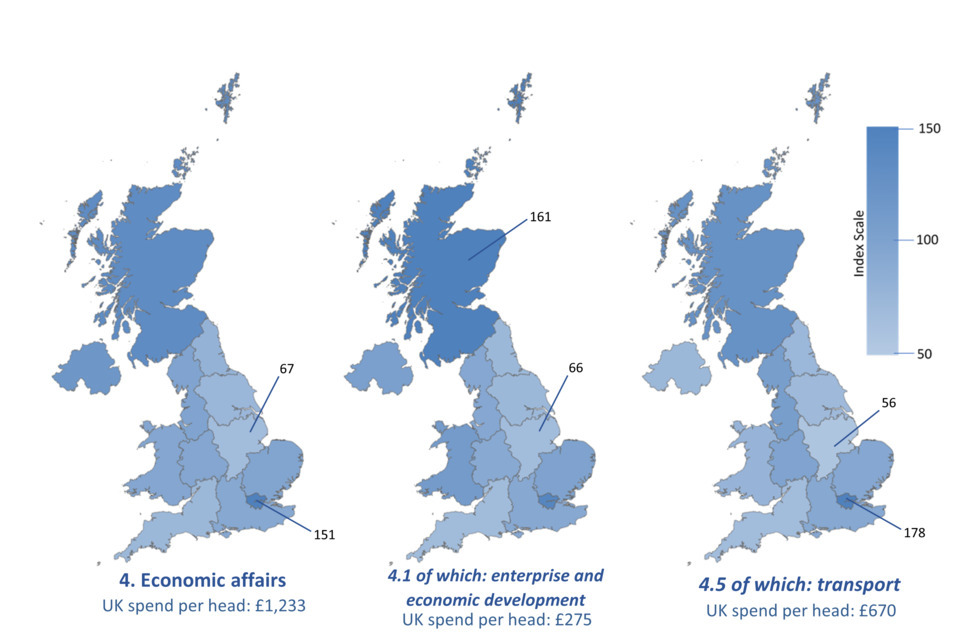
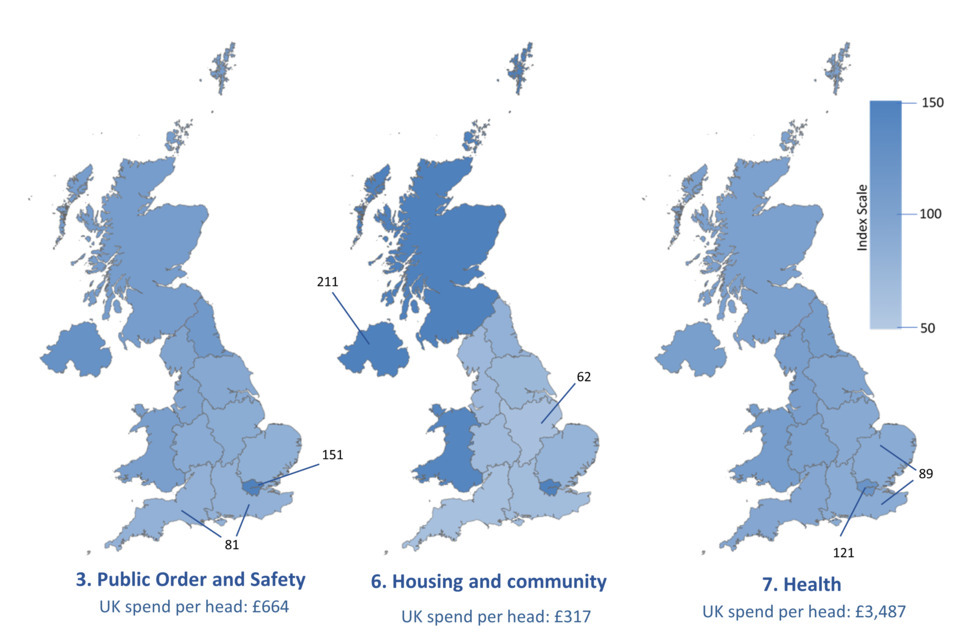
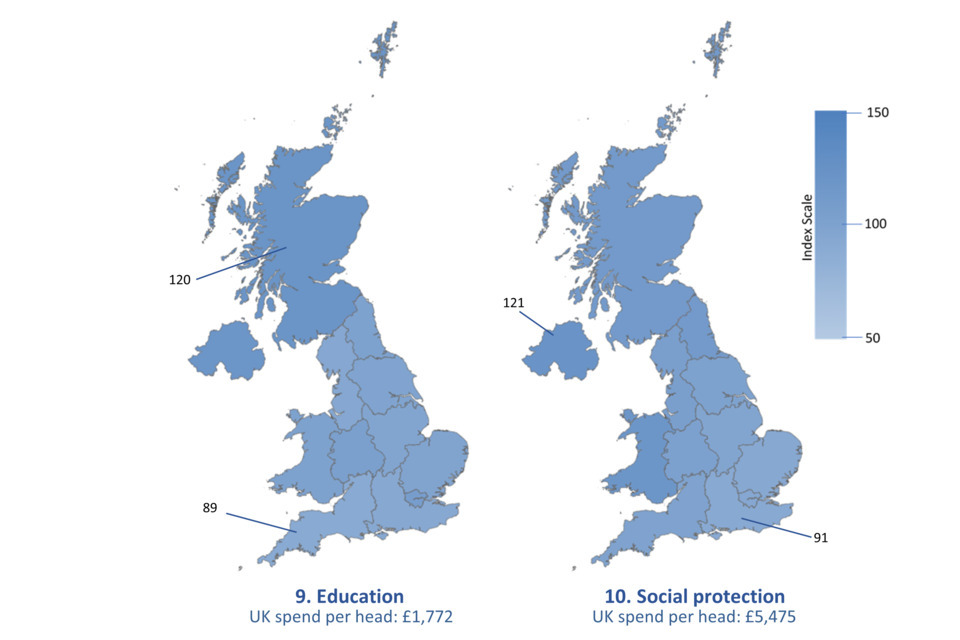
The images above contain maps based on table A.16. For reference, each map has been labelled with the lowest and highest index value and also provides the figure for the total UK spend per head based on data from table A.15. More information about maps and index figures is available in the guidance and information document published alongside this release.
Data in this release
All data in this release are available and accessible online on the Country and Regional Analysis publication page. All data tables are still available in excel format, where separate excel files are published for the A tables, the B tables, the interactive tables and the CRA database.
Most of the tables in this release provide an analysis of spending for the period 2020-21 to 2024-25. The information used to produce the A and B tables was gathered in a separate data collection exercise during the summer of 2025, which was consistent with the Public Spending Statistics (PSS) July 2025 dataset. In addition, further revisions to departmental and local authority outturn have also been taken on. Information on revisions, data tables and methodology can be found in the guidance and information document accompanying this release.
Key revisions in this release
Revisions to total expenditure on services (TES) since PSS: July 2025
Departments have taken the opportunity, wherever possible, to correct or update their outturn data since the publication of the July 2025 PSS to bring them into line with their published Annual Reports and Accounts. In addition, updated figures for local government expenditure have also been incorporated into this release. Figures for local government expenditure in 2024-25 are outturn for England and Wales and provisional for Scotland. Changes to Total Managed Expenditure (TME) and public sector debt interest in all years are due to updated ONS data. Note that figures in this release are consistent with the ONS public sector finances (PSF) publication for October 2025.
Annex: Population numbers and GDP deflators
Population numbers by country and region (thousands)
| Region | mid-2020 | mid-2021 | mid-2022 | mid-2023 | mid-2024 |
|---|---|---|---|---|---|
| North East | 2,637 | 2,647 | 2,685 | 2,725 | 2,761 |
| North West | 7,381 | 7,424 | 7,526 | 7,634 | 7,737 |
| Yorkshire and The Humber | 5,468 | 5,482 | 5,541 | 5,611 | 5,673 |
| East Midlands | 4,855 | 4,882 | 4,936 | 5,004 | 5,063 |
| West Midlands | 5,932 | 5,956 | 6,020 | 6,106 | 6,187 |
| East | 6,298 | 6,350 | 6,403 | 6,493 | 6,576 |
| London | 8,867 | 8,805 | 8,871 | 9,000 | 9,090 |
| South East | 9,225 | 9,296 | 9,393 | 9,529 | 9,643 |
| South West | 5,662 | 5,713 | 5,769 | 5,830 | 5,890 |
| England | 56,326 | 56,555 | 57,144 | 57,932 | 58,620 |
| Scotland | 5,409 | 5,413 | 5,447 | 5,506 | 5,547 |
| Wales | 3,104 | 3,106 | 3,134 | 3,167 | 3,187 |
| Northern Ireland | 1,901 | 1,905 | 1,911 | 1,920 | 1,928 |
| UK | 66,740 | 66,978 | 67,636 | 68,526 | 69,281 |
- Census 2021 based mid-year population estimates from the ONS for England and Wales: Estimates of the population for England and Wales - Office for National Statistics.
- Scottish Census 2022 based mid-year population estimates from the National Records of Scotland: Rebased population estimates, Scotland, mid-2020 to mid-2022. Mid 2023 and mid 2024 estimates.
- Census 2021 based mid-year population estimates for Northern Ireland from NISRA: Northern Ireland mid-year estimates 2020 to 2023. Mid-year estimates for 2024.
GDP deflators and money GDP
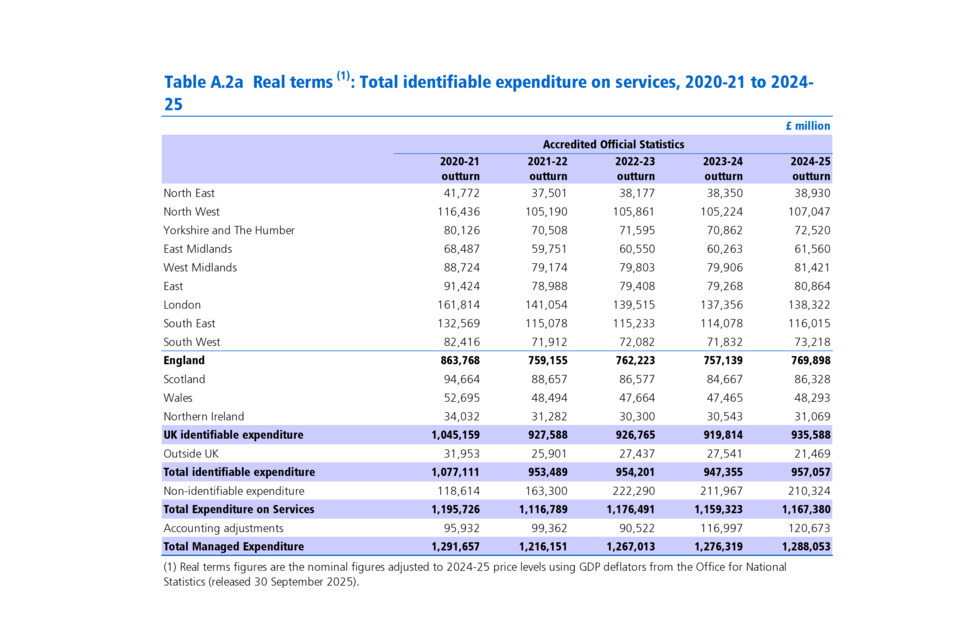
Real terms figures are the nominal figures adjusted to 2024-25 price levels using GDP deflators from the Office for National Statistics (released 30 September 2025).
| Financial year | GDP deflator at market prices (2024-25 = 100) | % per cent change on previous year | Money GDP (£millions) |
|---|---|---|---|
| 2020-21 | 85.383 | 5.23 | 2,109,996 |
| 2021-22 | 85.588 | 0.24 | 2,400,398 |
| 2022-23 | 91.603 | 7.03 | 2,634,336 |
| 2023-24 | 96.433 | 5.27 | 2,788,983 |
| 2024-25 | 100.000 | 3.70 | 2,926,818 |
GDP Deflator: Financial years 2020-21 to 2024-25 taken from ONS series L8GG in Table N.
-
Accredited official statistics are called National Statistics in the Statistics and Registration Service Act 2007 ↩