Country and regional analysis: December 2023
Published 20 December 2023

© Crown copyright 2023
This publication is licensed under the terms of the Open Government Licence v3.0 except where otherwise stated. To view this licence, visit nationalarchives.gov.uk/doc/open-government-licence/version/3 or write to the Information Policy Team, The National Archives, Kew, London TW9 4DU, or email: psi@nationalarchives.gov.uk.
Where we have identified any third party copyright information you will need to obtain permission from the copyright holders concerned.
This publication is available at https://www.gov.uk/government/statistics/country-and-regional-analysis-2023/country-and-regional-analysis-december-2023
Data summary 2022-23
| UK identifiable expenditure | |
|---|---|
| England | £698 billion |
| Scotland | £79 billion |
| Wales | £44 billion |
| Northern Ireland | £28 billion |
| Total | £848 billion |
The Coronavirus (Covid-19) pandemic, together with measures taken in response to increases in the cost of living, have affected the statistics across the time series available in the Country and Regional Analysis (CRA). We therefore recommend caution when comparing data across the time period covered by this release.
Population figures used in the CRA are based on the most up-to-date data available. For England, Wales and Northern Ireland these are all Census 2021 based mid-year population estimates. For Scotland 2022-23 figures are as at Census Day 2022, with all other years being Census 2011 based mid-year estimates. The lack of a consistent source for all years means there may be some inconsistencies in the population numbers between Scotland and the rest of the United Kingdom. This will have affected the per head numbers presented in this release, so again we recommend caution when comparing movements between years. More information on the population figures is set out in section 3.5 below.
Note that the use of updated population numbers for all years will have caused revisions to the per head calculations in this release. In addition, any expenditure segments reliant on the population figures for their regional allocation will also have been revised.
In 2022-23 UK identifiable spend (i.e. spending that can be identified as having been for the benefit of a particular area of the UK) increased to just under £848.2 billion from £794.9 billion the year before. On a per head basis [footnote 1] total UK expenditure rose by almost £700 between 2021-22 and 2022-23. This mainly reflects higher expenditure on measures taken in response to increases in the cost of living, which has had a significant effect on the breakdown of spending across the country. Scotland and Northern Ireland saw very similar levels of spending per head at £14,456 and £14,453 respectively. England had the lowest spend per head at £12,227. Non-identifiable expenditure (i.e. spend which is deemed to be on behalf of the UK as a whole), increased by just under £62.5 billion in 2022-23. This is mainly due to higher expenditure on public sector debt interest.
| Spend per head (£) | |
|---|---|
| England | £12,227 |
| Scotland | £14,456 |
| Wales | £13,967 |
| Northern Ireland | £14,453 |
| UK average | £12,549 |
The profile of spending by country is influenced by the Barnett Formula. This is designed to provide the devolved administrations with a population share of any increases in comparable spending by UK departments.
Historically, Northern Ireland has seen the highest level of spend per head, but in 2022-23 it was overtaken by Scotland by £3. This is largely due to Northern Ireland having received a proportionally smaller share of the various energy related schemes announced as part of the response to increases in the cost of living. Energy prices in Northern Ireland were significantly below those in Great Britain, requiring a lower subsidy to keep costs comparable with the rest of the United Kingdom.
Regional Statistics
In 2022-23 English regions showed a broadly similar percentage of identifiable expenditure as in 2021-22. London accounted for £128 billion of total identifiable spend, the highest in England at 15% of the total. This was followed by the South East at 12% and the North West at 11% (Table A.1a).
UK identifiable expenditure, 2022-23 (£billions)
| UK identifiable expenditure (£billions) | |
|---|---|
| North East | £34.7 |
| North West | £96.5 |
| Yorkshire and the Humber | £65.7 |
| East Midlands | £55.4 |
| West Midlands | £73.4 |
| East | £72.4 |
| London | £128.4 |
| South East | £105.5 |
| South West | £66.2 |
Spend per head

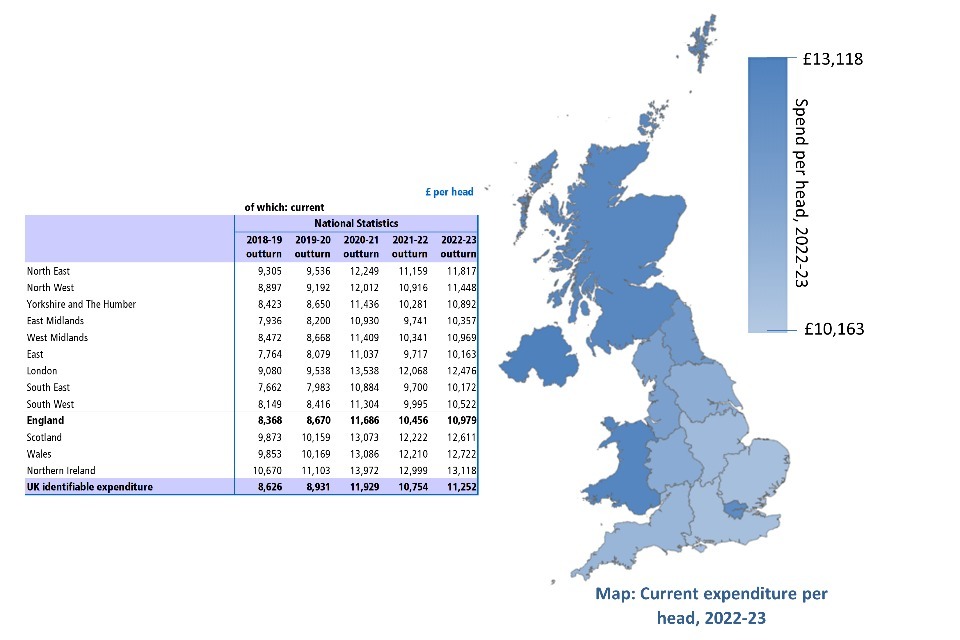
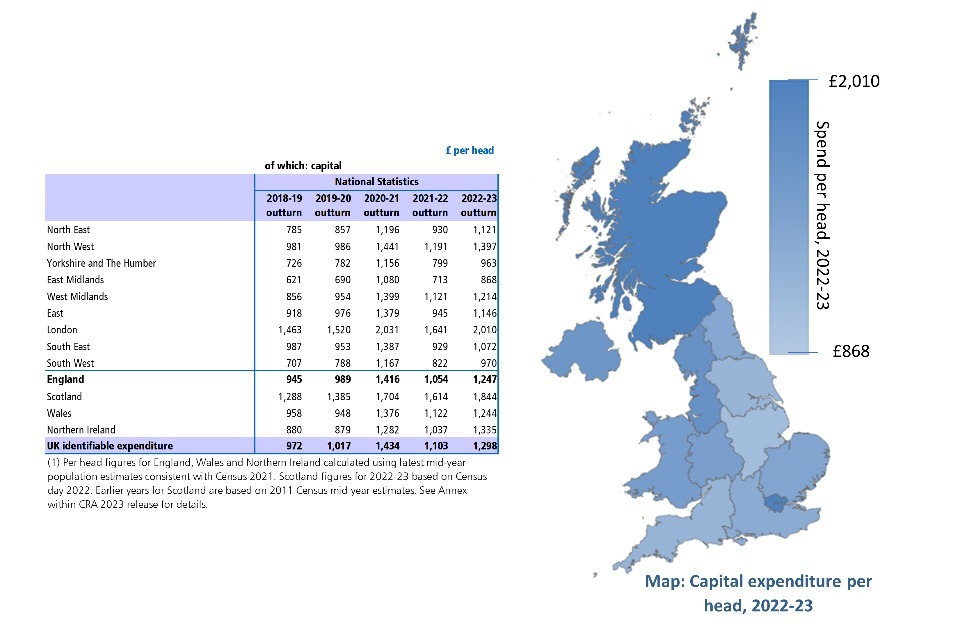
Expenditure per head provides a more accurate picture of regional differences, as it accounts for population size. Spend in London has historically been higher compared to other English regions partly due to the fact that for many functions it is more expensive to provide services in the capital, due to higher staff and infrastructure costs. In addition, London has historically had high capital expenditure, as it includes spend by Transport for London (TfL). Part of this spend will also benefit commuters who live outside London but who use TfL services while commuting. The lowest total spend per head was in the East Midlands and then the South East, at £11,225 and £11,244 per head respectively (Table A.1b). Looking at current spending only, i.e. recurring spend on providing public services, such as wages and salaries and benefits (Table A.3b), the lowest spend per head was in the East at £10,163, followed by the South East and East Midlands at £10,172 and £10,357 respectively. The English region with the highest current spend per head was London at £12,476.
Spend per head, 2022-23
| Spend per head (£) | |
|---|---|
| North East | £12,938 |
| North West | £12,845 |
| Yorkshire and the Humber | £11,855 |
| East Midlands | £11,225 |
| West Midlands | £12,182 |
| East | £11,309 |
| London | £14,486 |
| South East | £11,244 |
| South West | £11,492 |
| England (average) | £12,227 |
| Scotland | £14,456 |
| Wales | £13,967 |
| Northern Ireland | £14,453 |
| UK (average) | £12,549 |
1. Data in this chart is taken from table A.1b of the main release.
Additional expenditure announced in response to increases in the cost of living is mainly reflected within the enterprise and economic development (Table A.8a) and social protection (Table A.14) functional categories. Increased expenditure in response to the Coronavirus outbreak in 2020-21 and 2021-22 affected several functional categories, most noticeably enterprise and economic development (Table A.8a), transport (A.8e) and health (Table A.11). There were some differences in how this increased expenditure affected various regions. London, for example, saw a higher per head share of increased spend on transport, due to its large bus and Underground networks. Similarly, London and South East England saw higher per head spend from business loans, due to the higher concentration of businesses in those regions[footnote 2]. Expenditure on social protection, particularly Universal Credit, also saw significant regional disparities, with London, the South East and East of England seeing the highest growth and the North East the smallest[footnote 3].
About this release
-
This release presents analyses of public expenditure by country, region and function. Data in this release are National Statistics for all years.
-
Users should note that the Country and Regional Analysis is a purely statistical exercise and plays no part in resource allocation or the operation of the Barnett Formula. The regional analyses and judgments about statistical methodology presented in this release do not constitute statements of government policy.
-
Most public spending is planned to benefit categories of individuals and enterprises irrespective of location. The regional analyses presented in this release show where the individuals and enterprises that benefited from public spending were located. It does not mean that all such spending was planned to benefit a particular region, because only a minority of public spending is planned on a regional basis.
National Statistics
National Statistics are accredited official statistics[footnote 4].
These accredited official statistics were independently reviewed by the Office for Statistics Regulation in January 2013. They comply with the standards of trustworthiness, quality and value in the Code of Practice for Statistics and should be labelled ‘accredited official statistics’.
Our statistical practice is regulated by the Office for Statistics Regulation (OSR). OSR sets the standards of trustworthiness, quality and value in the Code of Practice for Statistics that all producers of official statistics should adhere to. For further information, please see the explanation web page on the OSR website.
You are welcome to contact us directly with any comments about how we meet these standards. Alternatively, you can contact OSR by emailing regulation@statistics.gov.uk or via the OSR website.
In January 2013 the United Kingdom Statistics Authority (UKSA) designated these statistics as National Statistics, in accordance with the Statistics and Registration Service Act 2007 and signifying compliance with the Code of Practice for Official Statistics.
Designation can be broadly interpreted to mean that the statistics:
-
meet identified user needs;
-
are well explained and readily accessible;
-
are produced according to sound methods; and
-
are managed impartially and objectively in the public interest.
Once statistics have been designated as National Statistics it is a statutory requirement that the Code of Practice shall continue to be observed. In May 2019 the UKSA published an assessment report on the Country and Regional analysis which reaffirmed its national statistics designation.
New in this release
Public spending undertaken in response to the increase in the cost of living is included in this release. The expenditure that can be identified in the underlying CRA data covers the following:
-
Department for Energy Security and Net Zero (DESNZ) expenditure on the Energy Bills Relief and Support Schemes and Energy Price Guarantee is shown as a single aggregate, totalling £39.9 billion.
-
Expenditure by DLUHC and the Scottish and Welsh Government on the £150 Council Tax rebate for households in England, Scotland and Wales totalling £3.5 billion.
-
Expenditure by DWP on additional benefit payments totalling £5.7 billion.
Together this totals around £49.1 billion in 2022-23 The methodology used to assign the spend to England, Scotland, Wales, Northern Ireland and the English regions is set out in full in the separate explanatory note.
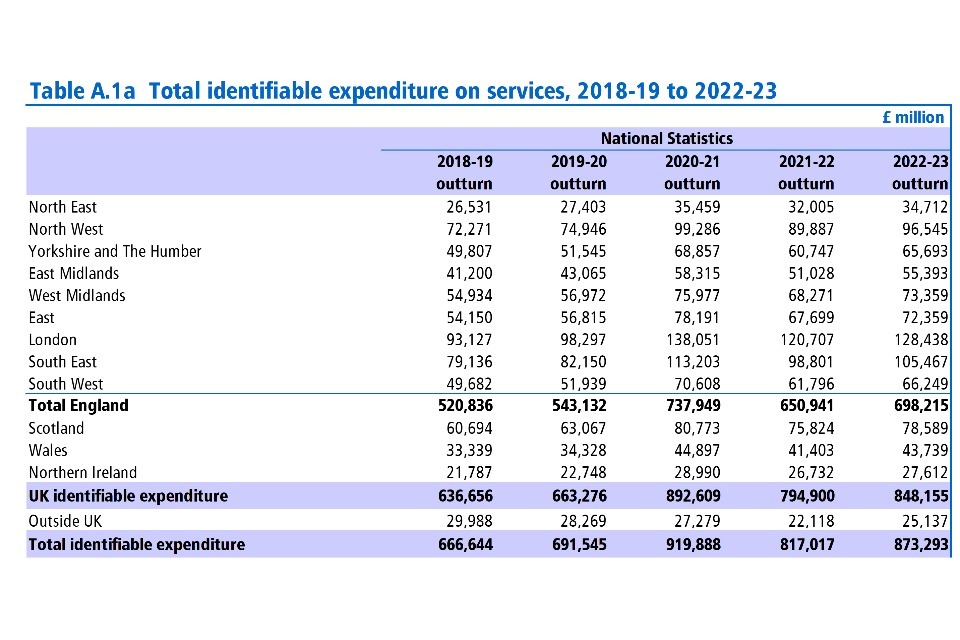
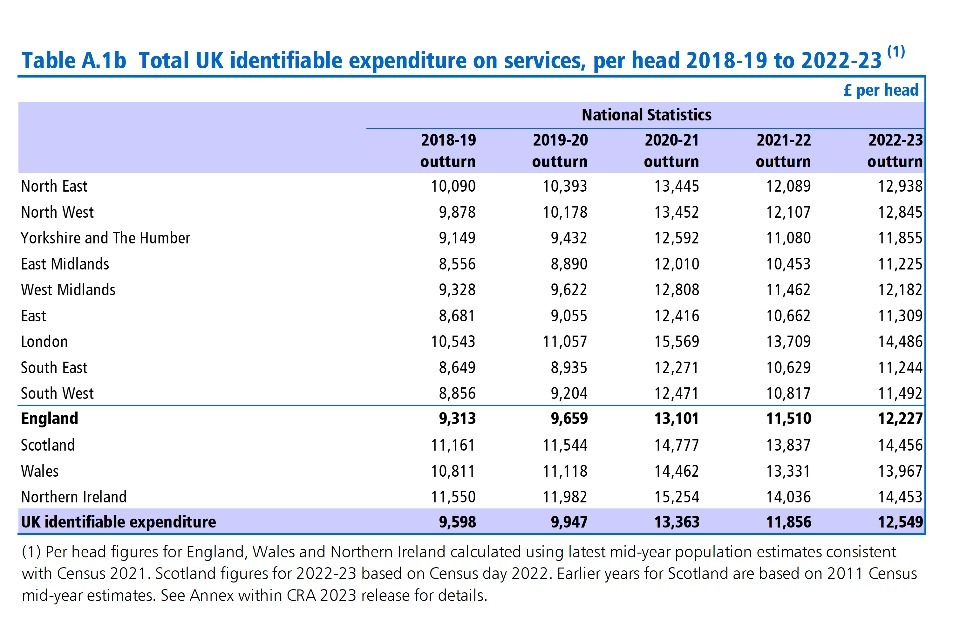
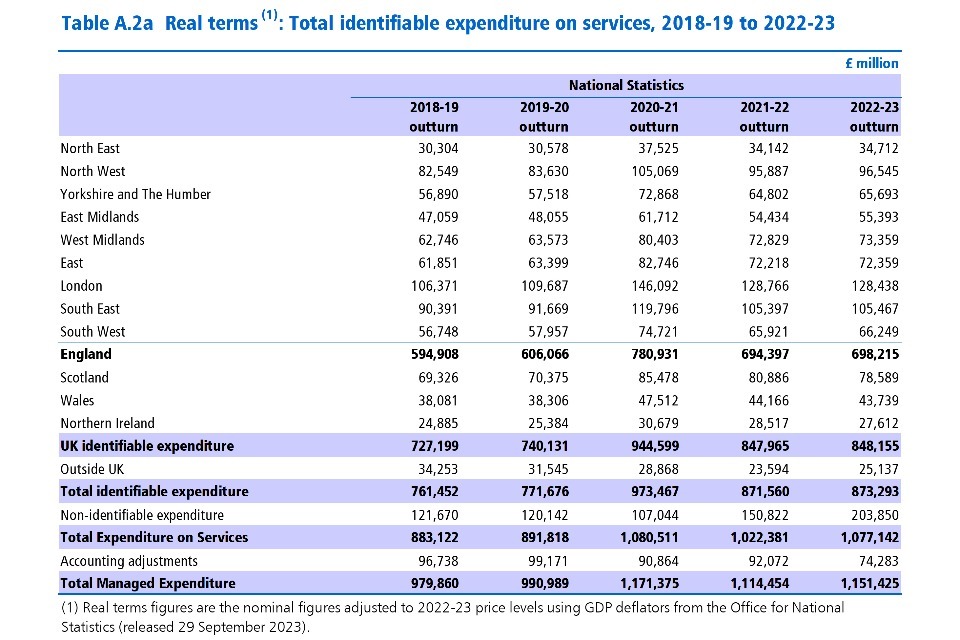
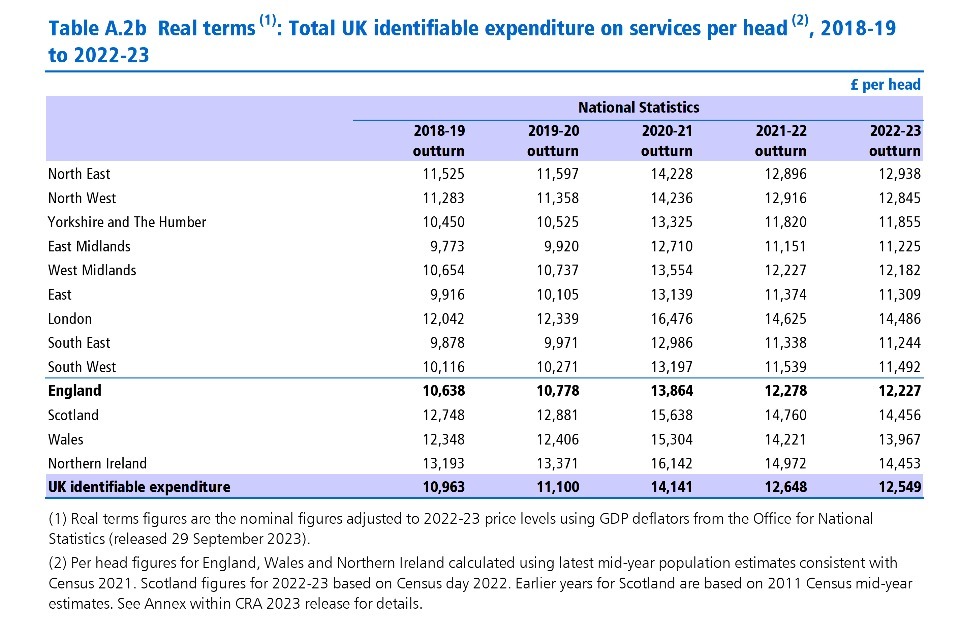
Table A.3b Total current and capital identifiable expenditure, per head 2018-19 to 2022-23
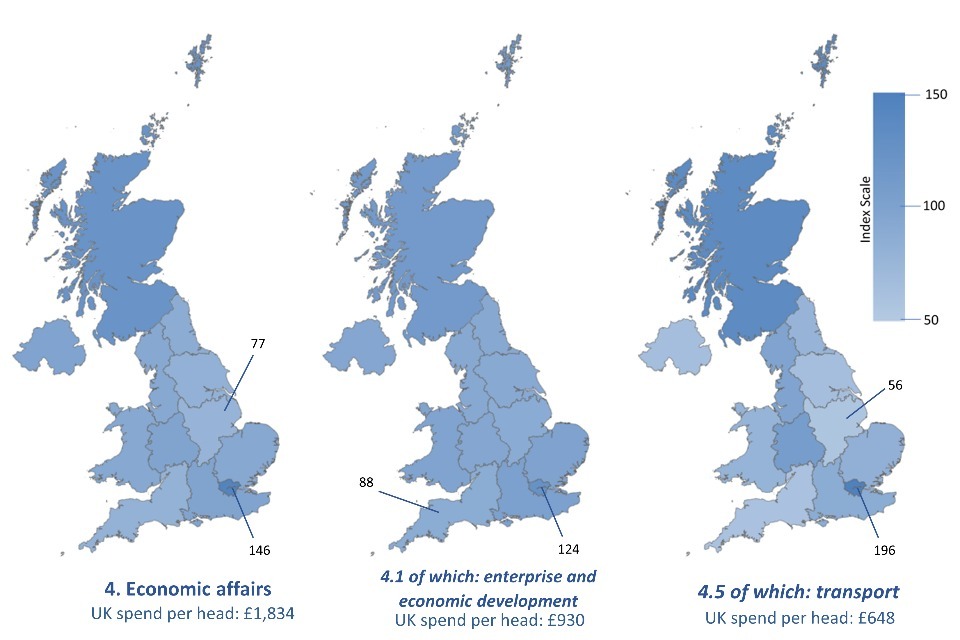
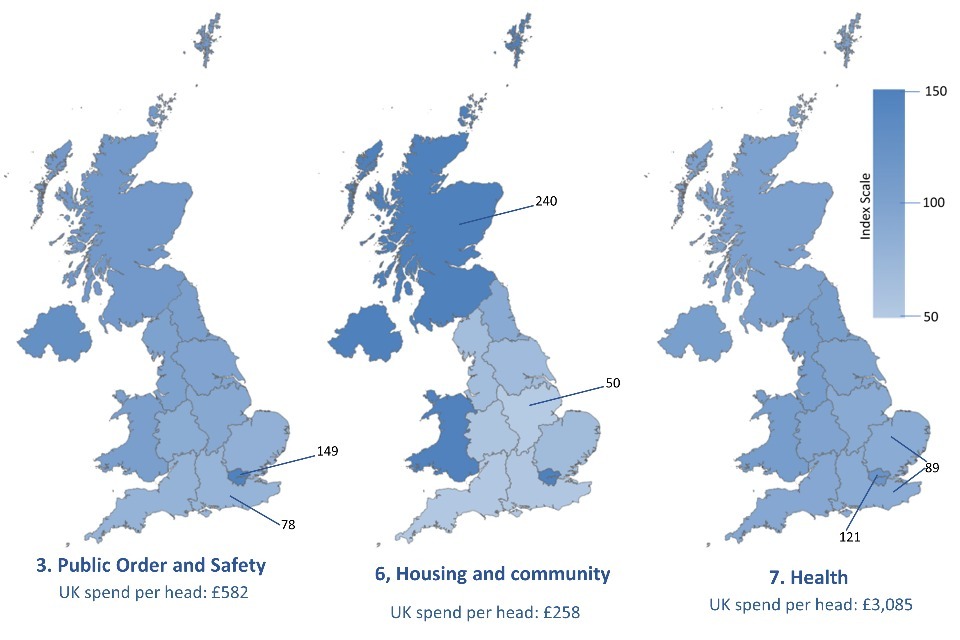
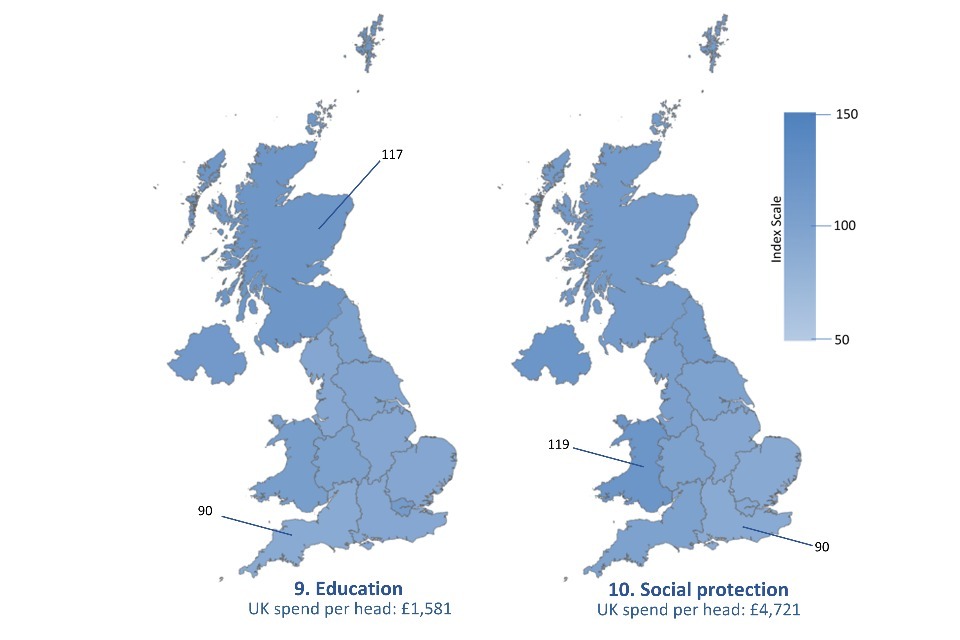
Maps based on Table A.16: UK identifiable expenditure by function, per head, indexed, 2022-23
The images below contain maps based on table A.16. For reference, each map has been labelled with the lowest and highest index value and also provides the figure for the total UK spend per head based on data from table A.15. More information about maps and index figures is available in the guidance and information document published alongside this release.
Data in this release
All data in this release are available and accessible online on the Country and Regional Analysis publication page. All data tables are still available in excel format, where separate excel files are published for the A tables, the B tables, the interactive tables and the CRA database.
Most of the tables in this release provide an analysis of spending for the period 2018-19 to 2022-23. The information used to produce the A and B tables was gathered in a separate data collection exercise during the summer of 2023, which was consistent with the Public Spending Statistics (PSS) July 2023 dataset. In addition, further revisions to departmental and local authority outturn have also been taken on. Information on revisions, data tables and methodology can be found in the guidance and information document accompanying this release.
Total Expenditure on Services (TES) in the CRA will not match the TES figures in the November 2023 PSS publication. As stated above, the CRA dataset is based on data used in the July 2023 PSS publication.
Key revisions in this release
Revisions to total expenditure on services (TES) since PSS: July 2023
Departments have taken the opportunity, wherever possible, to correct or update their outturn data since the publication of the July 2023 PSS to bring them into line with their published Annual Reports and Accounts. In addition, updated figures for local government expenditure have also been incorporated into this release. Figures for local government expenditure in 2022-23 are outturn for England and Wales and provisional for Scotland. Changes to Total Managed Expenditure (TME) and public sector debt interest in all years are due to updated ONS data. Note that figures in this release are consistent with the ONS public sector finances (PSF) publication for November 2023.
Annex: Population numbers and GDP deflators
Population numbers by country and region (thousands)
| Region | mid-2018 | mid-2019 | mid-2020 | mid-2021 | mid- 2022 |
|---|---|---|---|---|---|
| North East | 2,629 | 2,637 | 2,637 | 2,647 | 2,683 |
| North West | 7,316 | 7,363 | 7,381 | 7,424 | 7,516 |
| Yorkshire and The Humber | 5,444 | 5,465 | 5,468 | 5,482 | 5,541 |
| East Midlands | 4,815 | 4,844 | 4,855 | 4,882 | 4,935 |
| West Midlands | 5,889 | 5,921 | 5,932 | 5,956 | 6,022 |
| East | 6,237 | 6,274 | 6,298 | 6,350 | 6,398 |
| London | 8,833 | 8,890 | 8,867 | 8,805 | 8,866 |
| South East | 9,150 | 9,194 | 9,225 | 9,296 | 9,380 |
| South West | 5,610 | 5,643 | 5,662 | 5,713 | 5,765 |
| England | 55,925 | 56,230 | 56,326 | 56,555 | 57,106 |
| Scotland | 5,438 | 5,463 | 5,466 | 5,480 | 5,437 |
| Wales | 3,084 | 3,088 | 3,104 | 3,106 | 3,132 |
| Northern Ireland | 1,886 | 1,899 | 1,901 | 1,905 | 1,911 |
| UK | 66,333 | 66,680 | 66,797 | 67,045 | 67,585 |
Mid-Year Population Estimates from the ONS for England and Wales Estimates of the population for England and Wales - Office for National Statistics (ons.gov.uk). Mid-Year Population Estimates for Northern Ireland from the Northern Ireland Statistics and Research Agency (NISRA) 2022 Mid-Year Population Estimates for Northern Ireland | Northern Ireland Statistics and Research Agency (nisra.gov.uk). For Scotland, 2011 based mid-year estimates for 2018 to 2021 from National Records of Scotland (Mid-Year Population Estimates | National Records of Scotland (nrscotland.gov.uk) and Census Day figures for 2022 Scotland’s Census first results | National Records of Scotland (nrscotland.gov.uk).
GDP deflators and money GDP
Real terms figures are the nominal figures adjusted to 2022-23 price levels using GDP deflators from the Office for National Statistics (released 29 September 2023).
| Financial year | GDP deflator at market prices (2022-23 = 100) | % per cent change on previous year | Money GDP (£millions) |
|---|---|---|---|
| 2018-19 | 87.549 | 2.11 | 2,173,677 |
| 2019-20 | 89.616 | 2.36 | 2,244,509 |
| 2020-21 | 94.496 | 5.45 | 2,085,084 |
| 2021-22 | 93.742 | -0.80 | 2,361,452 |
| 2022-23 | 100.000 | 6.68 | 2,552,226 |
GDP Deflator: Financial years 2018-19 to 2022-23 taken from ONS series L8GG in Table N.
-
Per head figures calculated using the latest mid-year population estimates from the ONS (England & Wales), NRS (Scotland) and NISRA (Northern Ireland). ↩
-
UK business; activity, size and location - Office for National Statistics (ons.gov.uk) ↩
-
Universal Credit statistics, 29 April 2013 to 8 April 2021 - GOV.UK (www.gov.uk) ↩
-
Accredited official statistics are called National Statistics in the Statistics and Registration Service Act 2007 ↩