Corporation Tax statistics commentary 2026
Published 24 September 2026

© Crown copyright 2026
This publication is licensed under the terms of the Open Government Licence v3.0 except where otherwise stated. To view this licence, visit nationalarchives.gov.uk/doc/open-government-licence/version/3 or write to the Information Policy Team, The National Archives, Kew, London TW9 4DU, or email: psi@nationalarchives.gov.uk.
Where we have identified any third party copyright information you will need to obtain permission from the copyright holders concerned.
This publication is available at https://www.gov.uk/government/statistics/corporation-tax-statistics-2026/corporation-tax-statistics-commentary-2026
£100.4 billion total receipts from all corporate taxes for 2025 to 2026, up from £96.9 billion in the previous year
£94.2 billion total liabilities for all corporate taxes for 2024 to 2025, up from £92.0 billion in the previous year
1. About this release
This annual publication provides a breakdown of receipts and liabilities from corporate taxes by number of companies, income, deductions, industry sector, company size and financial year. For the purposes of this publication, corporate taxes consist of:
- Corporation Tax (CT) which includes onshore and offshore CT
- Bank Levy
- Bank Surcharge
- Residential Property Developer Tax (RPDT)
- Energy Profits Levy (EPL)
- Electricity Generator Levy (EGL)
The publication includes receipts figures up to financial year 1 April 2025 to 31 March 2026, and the first published CT liability estimates for company accounting periods ending between 1 April 2024 to 31 March 2025.
As mentioned in the accompanying Background and Guidance, this publication includes an estimate of liabilities for the latest financial year along with revisions for the previous five years. Typically, figures are revised upwards, especially for the most recent year as amendments to returns are submitted by companies and late returns are received.
2. Headline findings
The key findings in this year’s publication are:
- total receipts from all corporate taxes were £100.4 billion in financial year 2025 to 2026, an increase of £3.5 billion (4%) on the previous year
- the increase in receipts continues the upward trend of recent years, driven by a strong post-pandemic recovery in the economy, an increase in onshore CT receipts following the increase in the main rate of CT and the introduction of new corporate taxes and levies
- CT liabilities continued to grow in 2024 to 2025 but at a slower rate than in recent years, and this growth can mainly be attributed to the implementation of the 25% CT main rate
- there was a significant shift of CT liabilities from being paid at the 19% to the 25% and taper rates, following the full implementation of the CT rate change
- in financial year 2024 to 2025, approximately 7,700 companies (0.5% of all companies who had an amount of tax to pay) had liabilities of over £1 million, yet these contributed 60%, or £52.7 billion, of total CT liabilities
- total capital allowance claims minus balancing charges, were £155.0 billion in financial year 2024 to 2025, a decrease of £11 billion (7%)
- total qualifying capital expenditure continues to increase in the latest financial year, rising from £187.1 billion in 2023 to 2024 to £192.3 billion in financial year 2024 to 2025, an increase of 3%
3. Receipts from all corporate taxes
Figure 1: Receipts from all corporate taxes between financial years 2020 to 2021 and 2025 to 2026
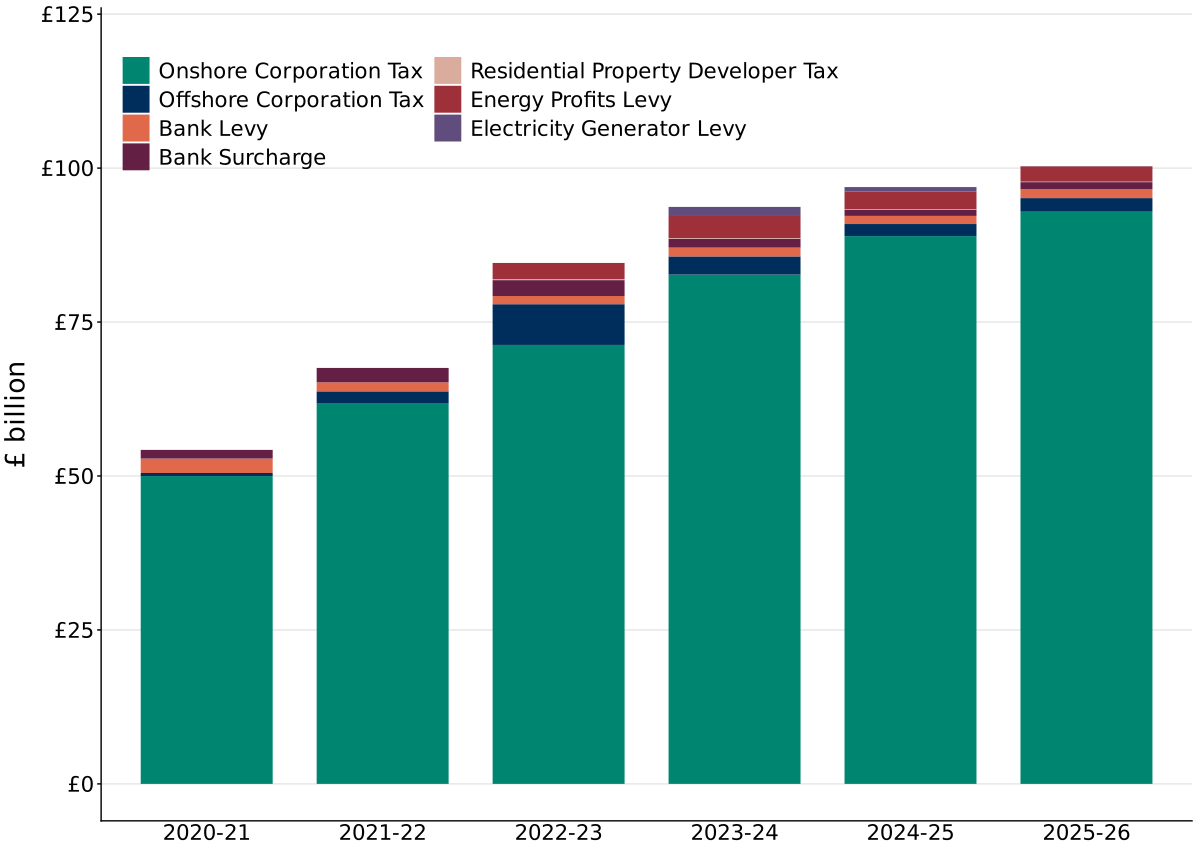
The data underpinning figure 1 is within table 1A of the Corporation Tax statistics data tables 2026.
Key statistics to note from figure 1 include:
- total receipts from all corporate taxes were £100.4 billion in financial year 2025 to 2026, an increase of £3.5 billion (4%) on the previous year
- the increase in receipts continues the upward trend of recent years, driven by a strong post-pandemic recovery in the economy, an increase in onshore CT receipts following the increase in the main rate of CT, and the introduction of new corporate taxes and levies
- onshore CT receipts were £92.9 billion in financial year 2025 to 2026, an increase of £3.9 billion (4%) on the previous year
- offshore CT receipts were £2.2 billion in financial year 2025 to 2026, an increase of £0.2 billion (13%) on the previous year
- Bank Surcharge receipts were £1.2 billion in financial year 2025 to 2026, an increase of £0.2 billion (20%) on the previous year, which can largely be explained by an increase in UK banking sector profitability
- Bank Levy receipts were £1.4 billion in financial year 2025 to 2026, an increase of £0.1 billion (9%) on the previous year
- Residential Property Developer Tax receipts were £89 million in financial year 2025 to 2026, a £13 million decrease (13%) on the previous year
- Energy Profits Levy were £2.6 billion in financial year 2025 to 2026, a decrease of £0.3 billion (10%) on the previous year, which can be explained by lower oil and gas prices
- Electricity Generator Levy receipts were £41 million in financial year 2025 to 2026, a decrease of £708 million (95%) on the previous year, which can be explained by lower wholesale electricity prices reducing the exceptional receipts subject to the tax
4. Receipts from Corporation Tax by Standard Industrial Classification of economic activity (SIC)
Figure 2: Receipts from Corporation Tax by SIC industry section, financial year 2025 to 2026
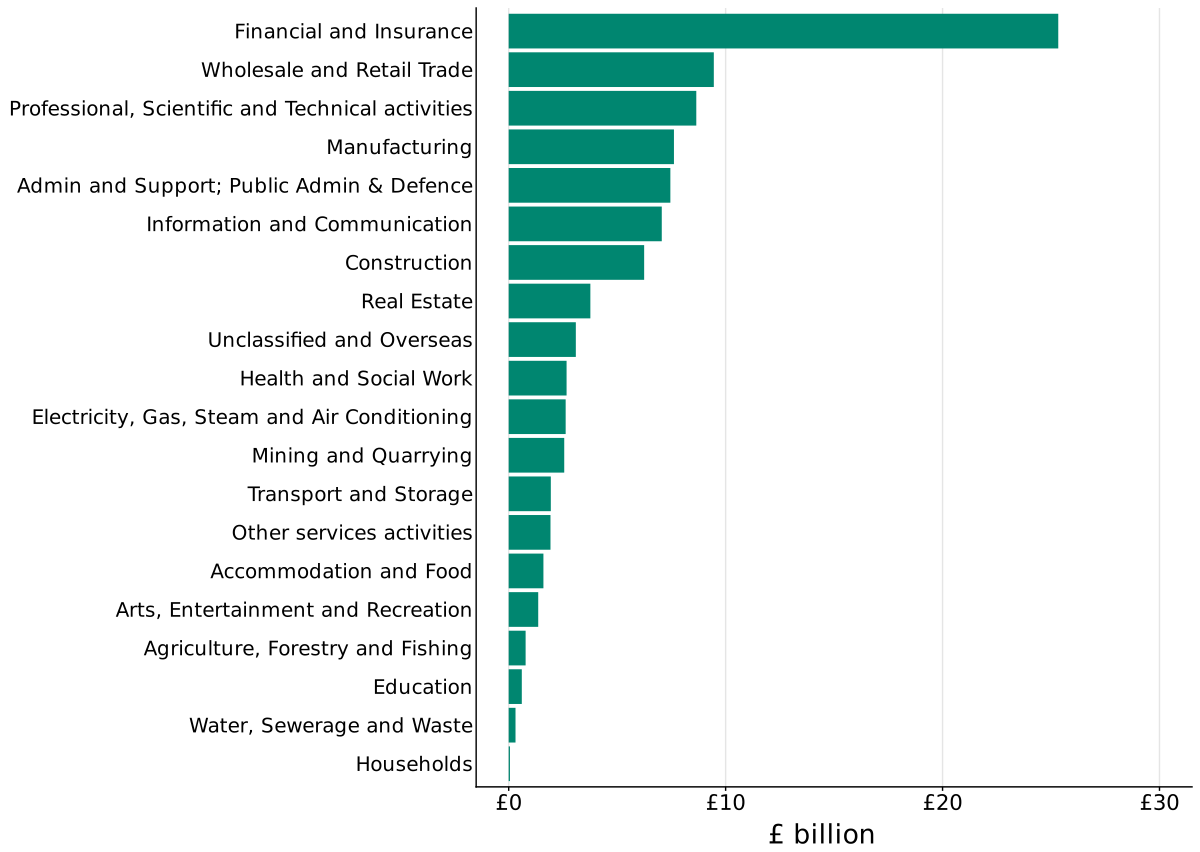
The data underpinning figure 2 is within table 1B of the Corporation Tax statistics data tables 2026.
Key statistics to note are:
- Financial and Insurance was the largest contributor with CT receipts of £25.3 billion in financial year 2025 to 2026, accounting for 27% of the total
- Wholesale and Retail Trade was the second largest contributor, with £9.5 billion, or 10% of total CT receipts in financial year 2025 to 2026
- Professional, Scientific and Technical activities was the third largest contributor, with £8.6 billion or 9% of total CT receipts in financial year 2025 to 2026
Figure 3: Growth in amount of CT receipts by SIC industry section, between financial years 2024 to 2025 and 2025 to 2026
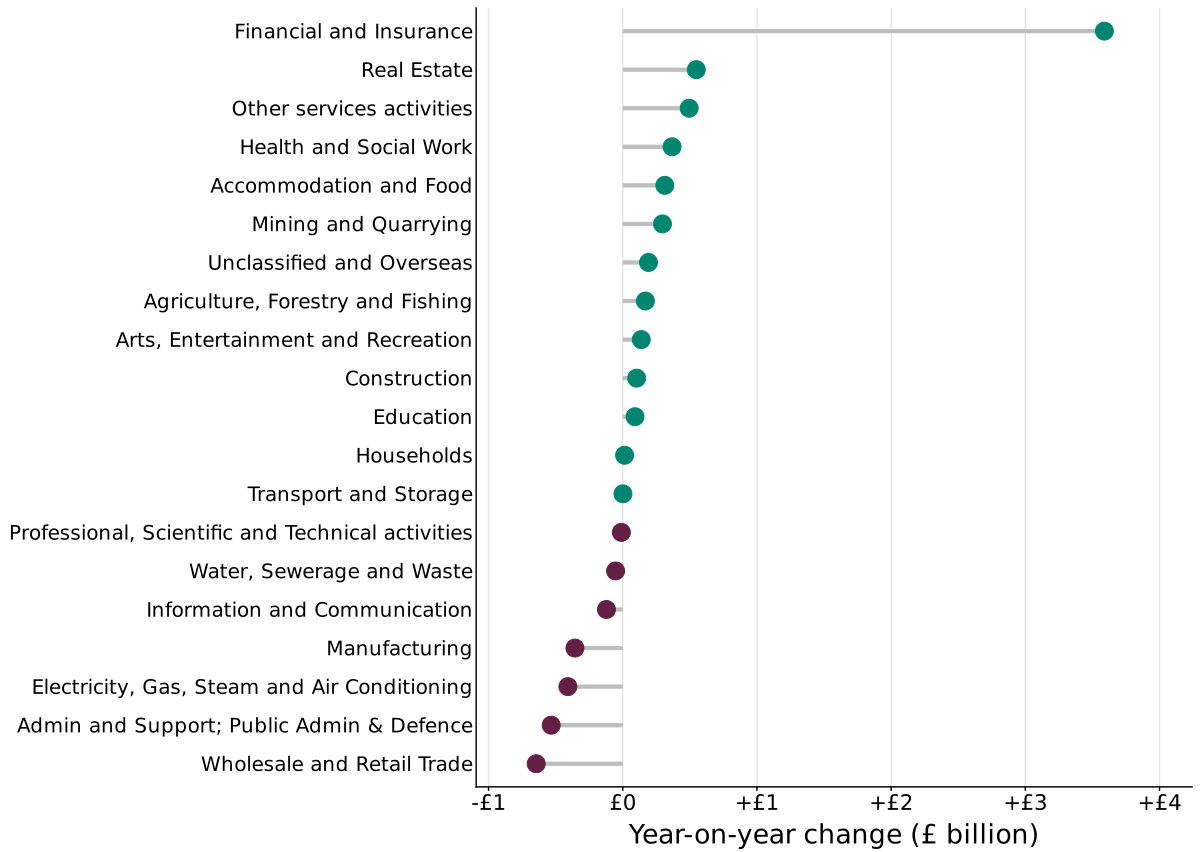
The data underpinning figure 3 is within table 1B of the Corporation Tax statistics data tables 2026.
The main points to note in figure 3 are:
- of the 20 industry sectors, 13 saw a year-on-year increase in CT receipts, with 7 experiencing a year-on-year decrease
- the largest increase was in Financial and Insurance, which saw a £3.6 billion or 17% increase
- the largest year-on-year decrease was in Wholesale and Retail Trade, with receipts down by £0.6 billion or 6%
Figure 4 below shows the longer-term trends in CT receipts for some of the highest contributing SIC sections, between financial years 2020 to 2021 and 2025 to 2026.
Figure 4: Growth of CT receipts by SIC industry section between financial years 2020 to 2021 and 2025 to 2026
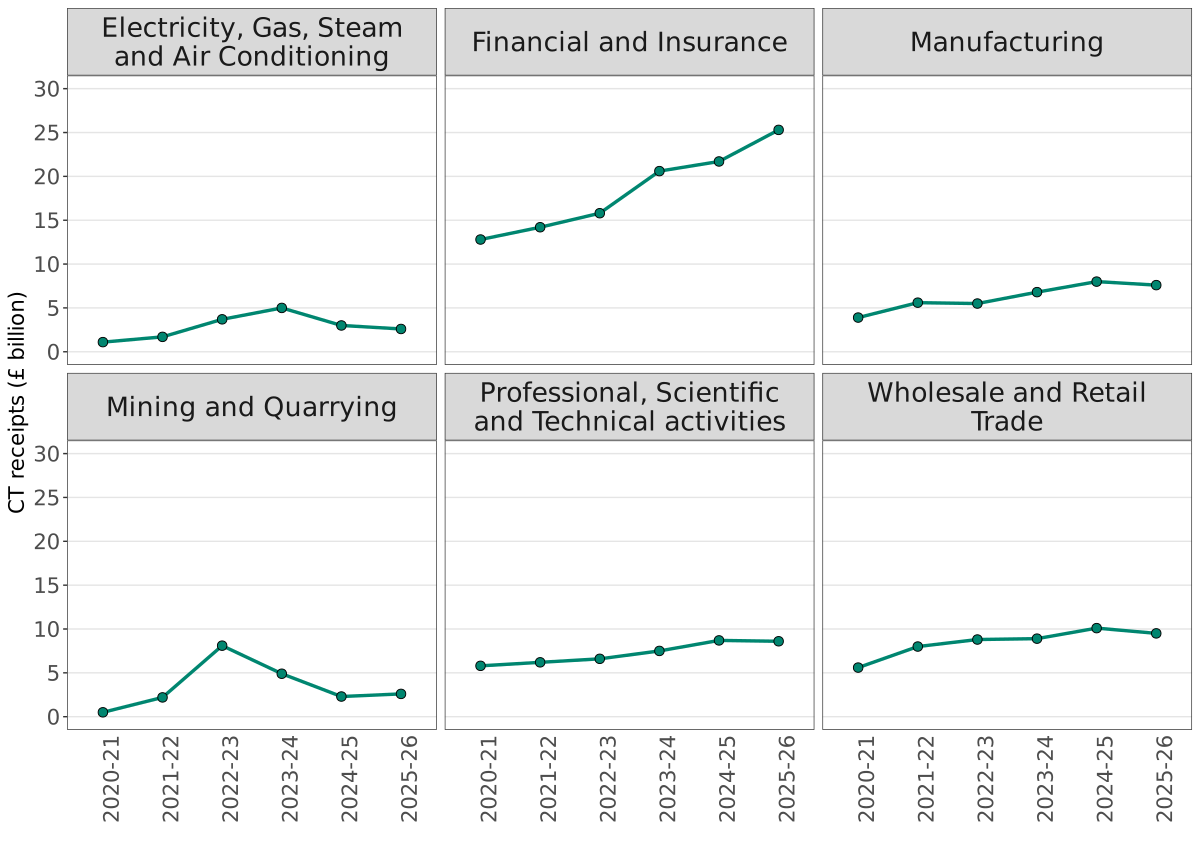
The data underpinning figure 4 is within table 1B of the Corporation Tax statistics data tables 2026.
The main points to note in figure 4 are:
- CT receipts from Mining and Quarrying have been the most volatile over the six-year period with trends largely explained by energy prices including a peak in 2022 to 2023 following Russia’s invasion of Ukraine
- CT receipts from Financial and Insurance increased most in value over the six-year period, rising by £12.5 billion or 97%
5. Corporation Tax liabilities and the rate change
Figure 5: Total onshore and offshore Corporation Tax liabilities between financial years 2019 to 2020 and 2024 to 2025
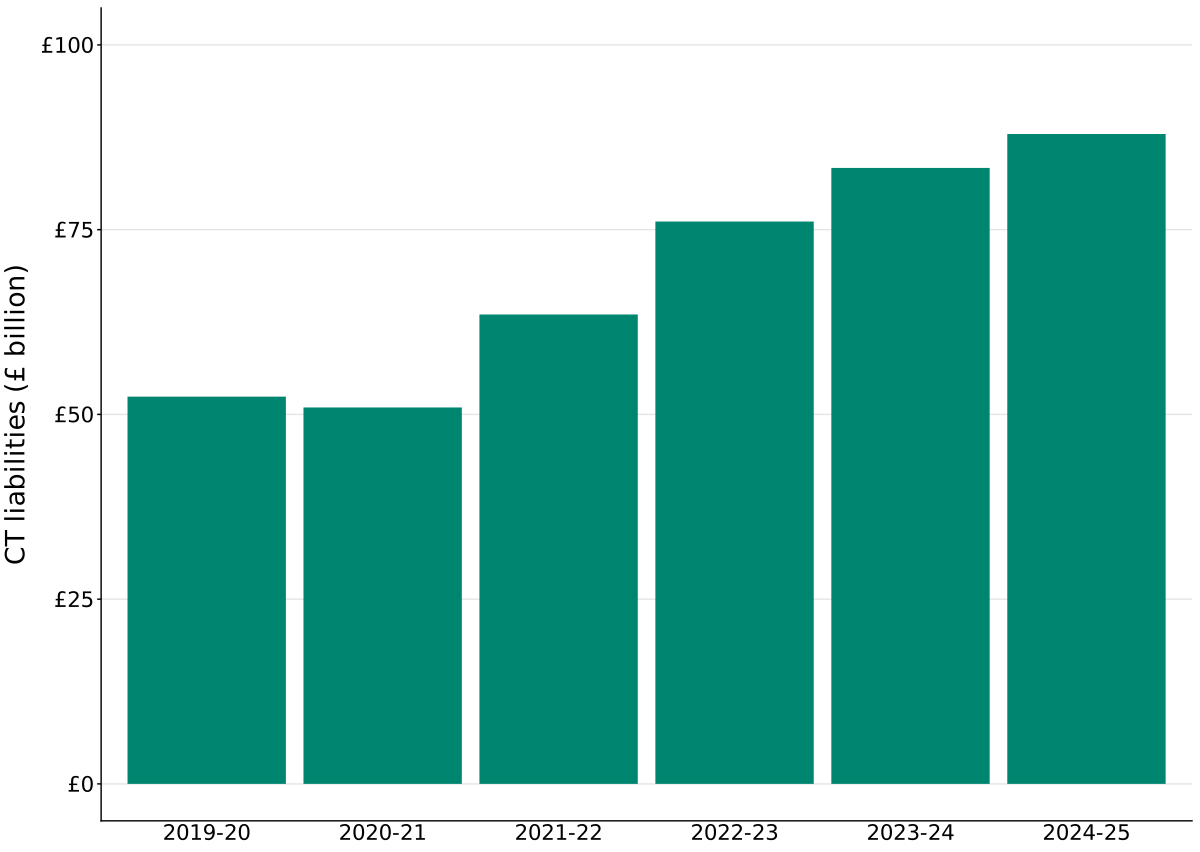
The data underpinning figure 5 is within table 3A of the Corporation Tax statistics data tables 2026.
The main points to note in figure 5 for total onshore and offshore CT liabilities are:
- CT liabilities continued to grow in 2024 to 2025 but at a slower rate than in recent years
- total CT liabilities increased by £4.5 billion (5%) in the latest financial year, from £83.4 billion in financial year 2023 to 2024, to £87.9 billion in 2024 to 2025
Figure 6 below shows the percentage growth of total taxable income, total deductions, profits chargeable to onshore CT and CT payable over the last 5 years.
Figure 6: Percentage growth in total taxable income, total deductions, profits chargeable to CT, and CT payable between financial years 2020 to 2021 and 2024 to 2025
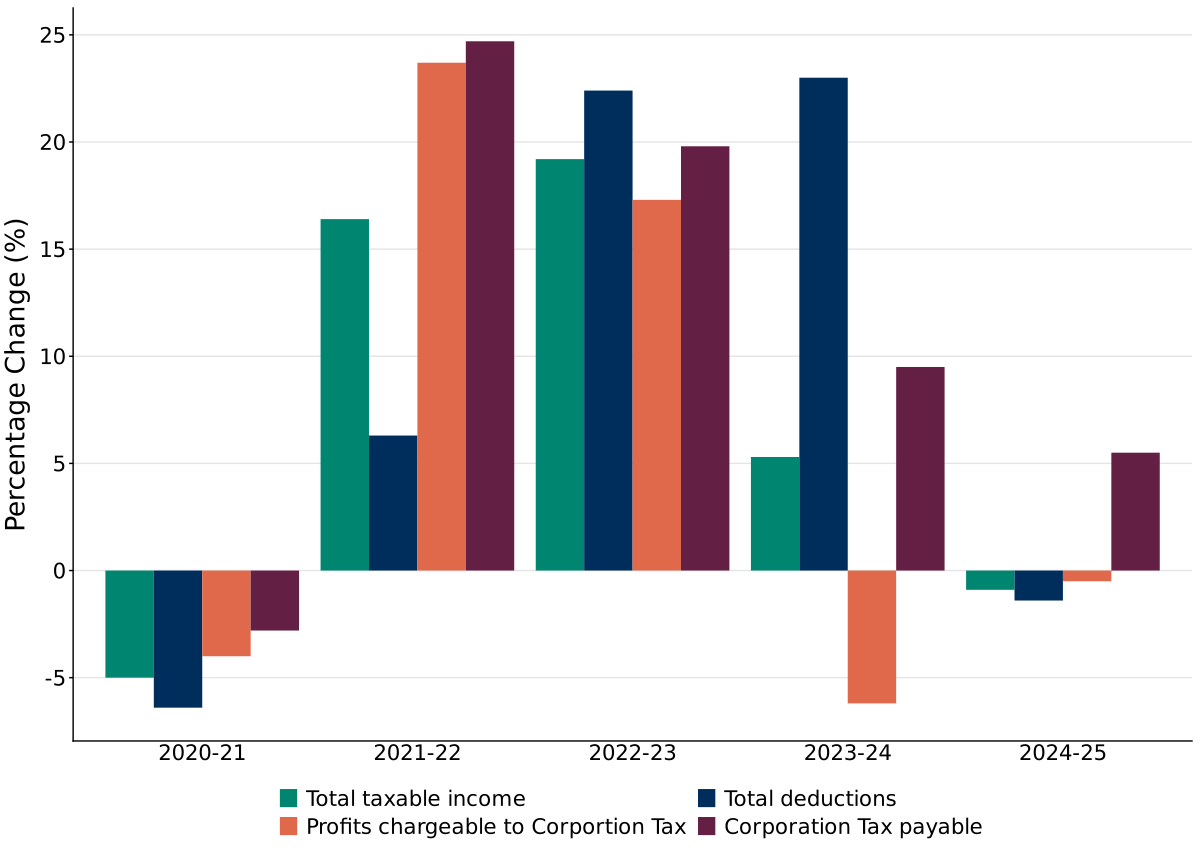
The data underpinning figure 6 is within table 3A of the Corporation Tax statistics data tables 2026.
Figures for CT liabilities are produced using data collected from annual company CT returns. There is more of a delay in receiving this data compared with receipts, but the returns provide more detail on income, deductions and the tax calculation.
In 2023 to 2024 the growth in deductions was stronger than growth in taxable income, causing a decrease in profits chargeable to CT.
In 2024 to 2025, both taxable income and deductions decreased by 1%, causing a 0.5% decrease in profits chargeable to CT. Despite this small decline, the full introduction of the 25% main rate has increased CT liabilities.
Trading profits are the largest contributor to taxable income, and have decreased by 4%, from £472.5 billion in 2023 to 2024, to £454.9 billion in 2024 to 2025. However, trading profits are typically revised upwards following amended returns in the year following. For example, 2023 to 2024 trading profits were revised upwards by 2.1%, from £462.6 billion in last year’s publication, to £472.5 billion, an upwards revision of £9.9 billion.
Figure 7 examines deductions in more detail, showing the amount of deductions claimed over time.
Figure 7: Year on year changes in deductions claimed, between financial years 2019 to 2020 and 2024 to 2025
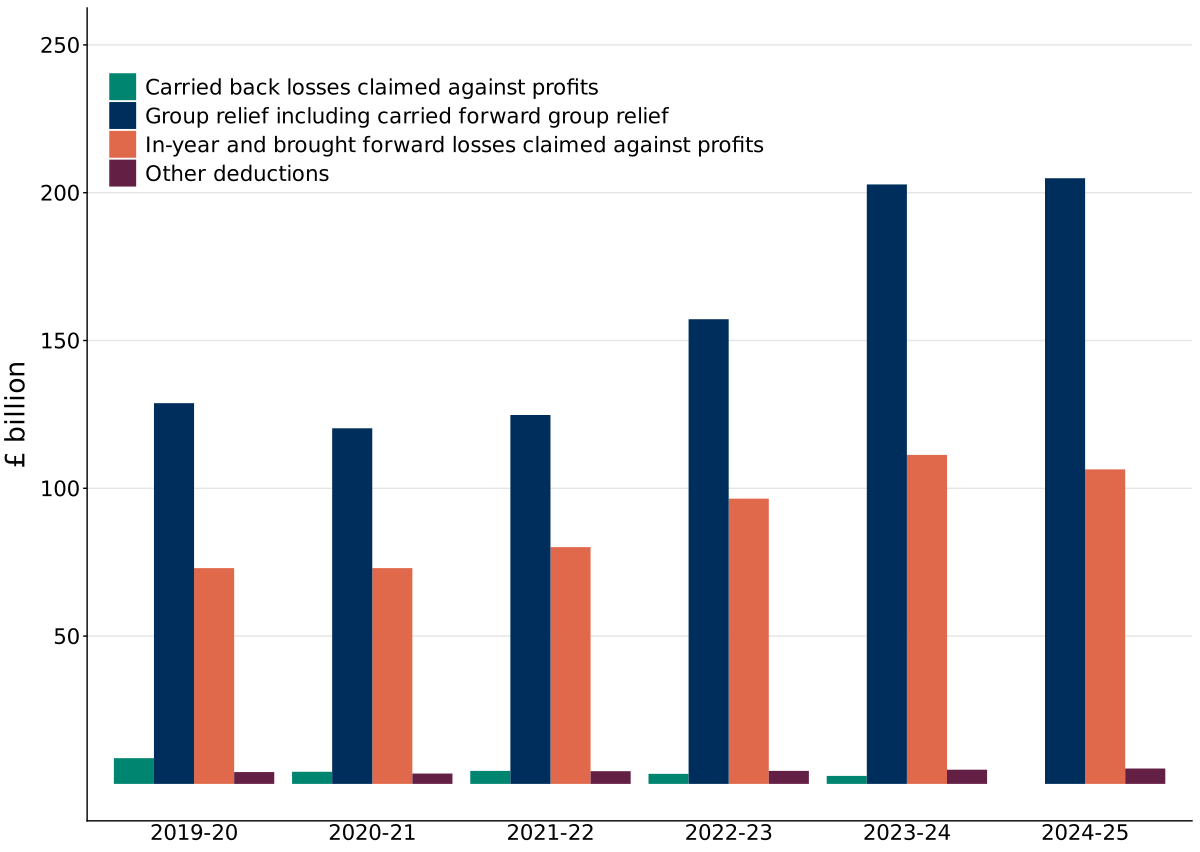
The data underpinning figure 7 is within table 3A of the Corporation Tax statistics data tables 2026.
Group relief saw a sharp increase between 2022 to 2023 and 2023 to 2024. This increase coincided with a rise in both profits and non-trading loan relationship deficits over the same period. Whilst the growth in total deductions has slowed down, group relief has remained high, increasing slightly from £202.8 billion in 2023 to 2024 to £204.9 billion in 2024 to 2025.
As described above, the growth in CT liabilities in the most recent financial year can be attributed to the introduction of the 25% main rate of CT in April 2023, despite a decrease in profits chargeable to CT.
Some companies with accounting periods not aligned to the tax year would have only been partially affected by the rate change during 2023 to 2024. The rate change will have fully applied to companies in 2024 to 2025 regardless of accounting period dates.
Figure 8 below shows the distribution of CT chargeable by the different rates of CT.
Figure 8: Corporation Tax chargeable by rate, 2023 to 2024 and 2024 to 2025
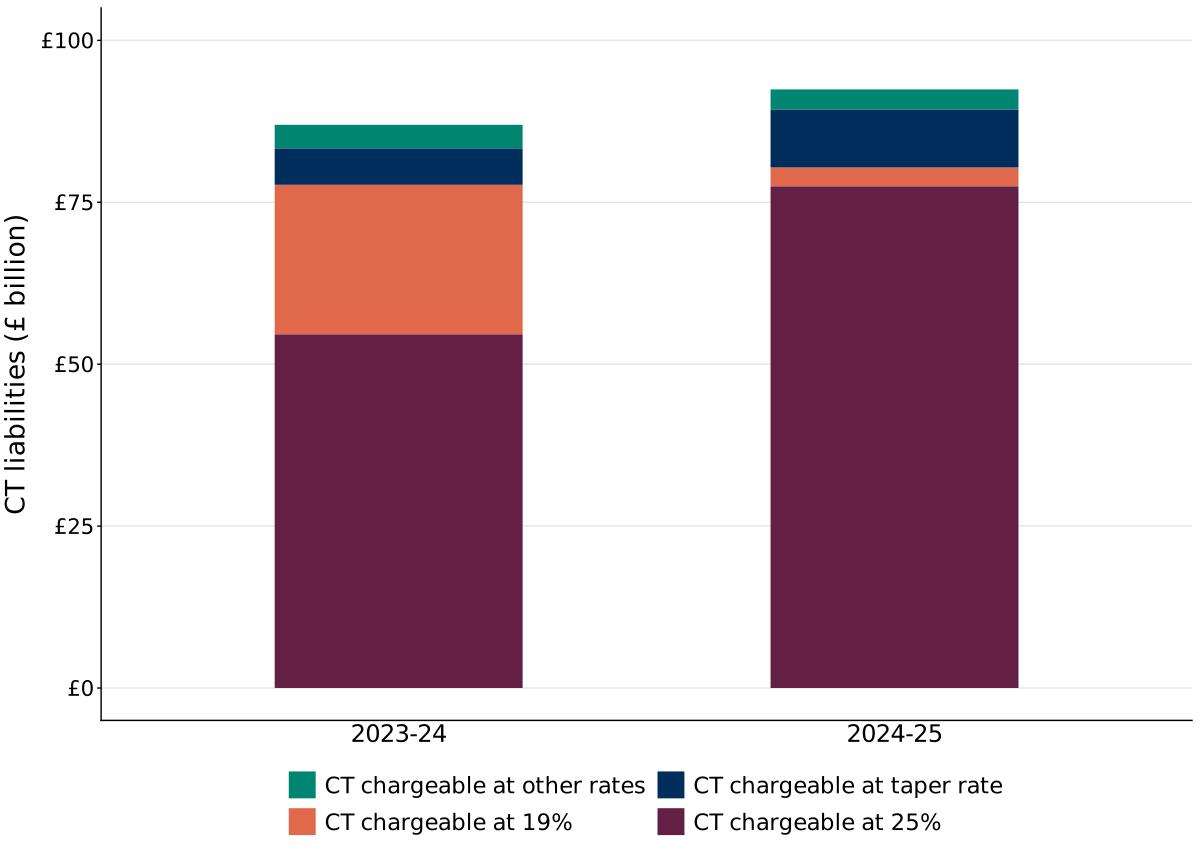
The data underpinning figure 8 is within table 3A of the Corporation Tax statistics data tables 2026.
The main points to note in figure 8 for CT chargeable are:
- due to the full implementation of the rate change, there was a significant shift in liabilities paid at the small profits rate with CT chargeable at the 19% rate dropping by 87%, from £23.1 billion in 2023 to 2024 to £2.9 billion in 2024 to 2025
- at the same time, CT chargeable at the 25% main rate increased by 42%, from £54.6 billion to £77.5 billion and CT chargeable at the taper rate increased by 59%, from £5.6 billion to £9.0 billion
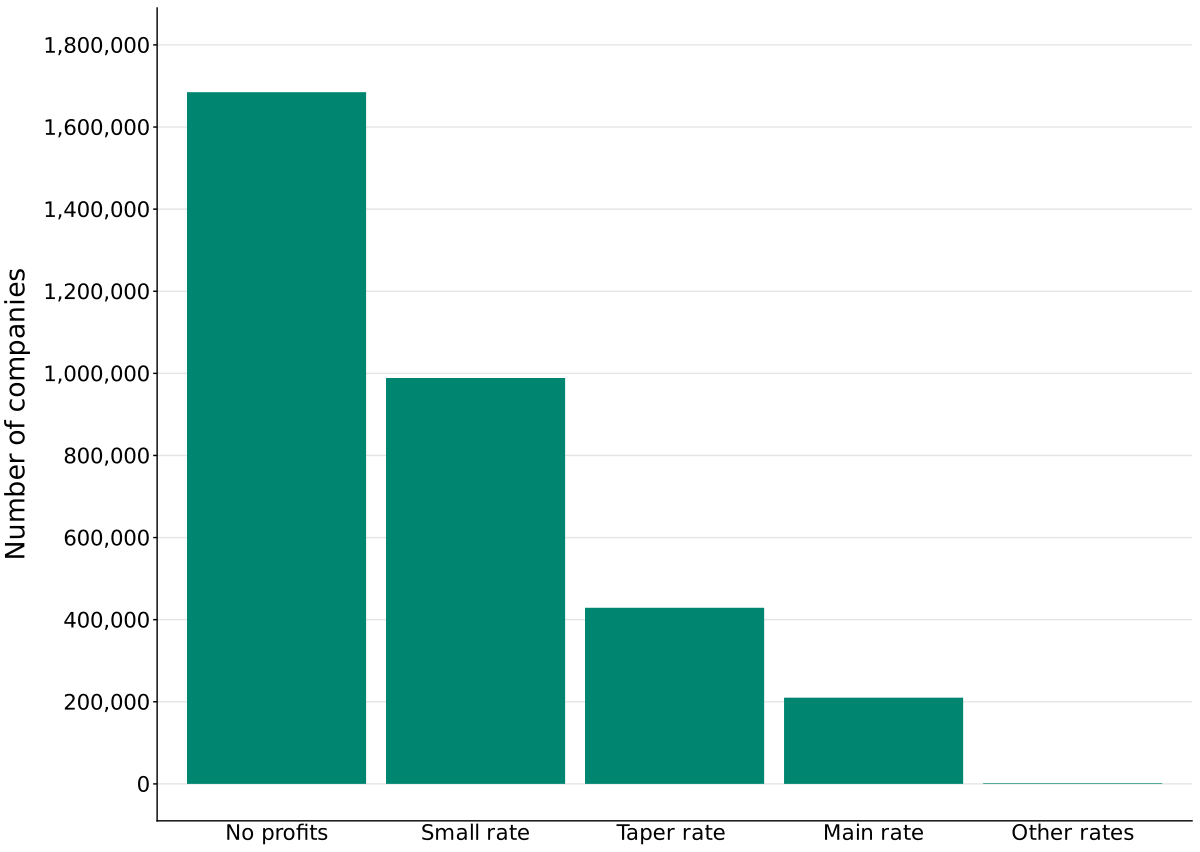
Figure 9 shows the number of companies with CT chargeable, broken down by the rate of CT liability in 2024 to 2025.
Figure 9: Number of companies, by CT rate payable 2024 to 2025
The data underpinning figure 9 is within table 5 of the Corporation Tax statistics data tables 2026.
The main points to note from figure 9 for the number of companies in each band at the end of the financial year 2024 to 2025 are:
- 1.68 million (51%) of companies had no CT liability
- 210,000 companies had CT chargeable at the main rate
- main rate companies represent 6% of all companies, or 13% of companies with a CT liability
- 988,700 companies had a CT chargeable at the small rate
- small profit companies represent 30% of all companies, or 61% of companies with a CT liability
6. Corporation Tax liabilities by ‘size’ of company
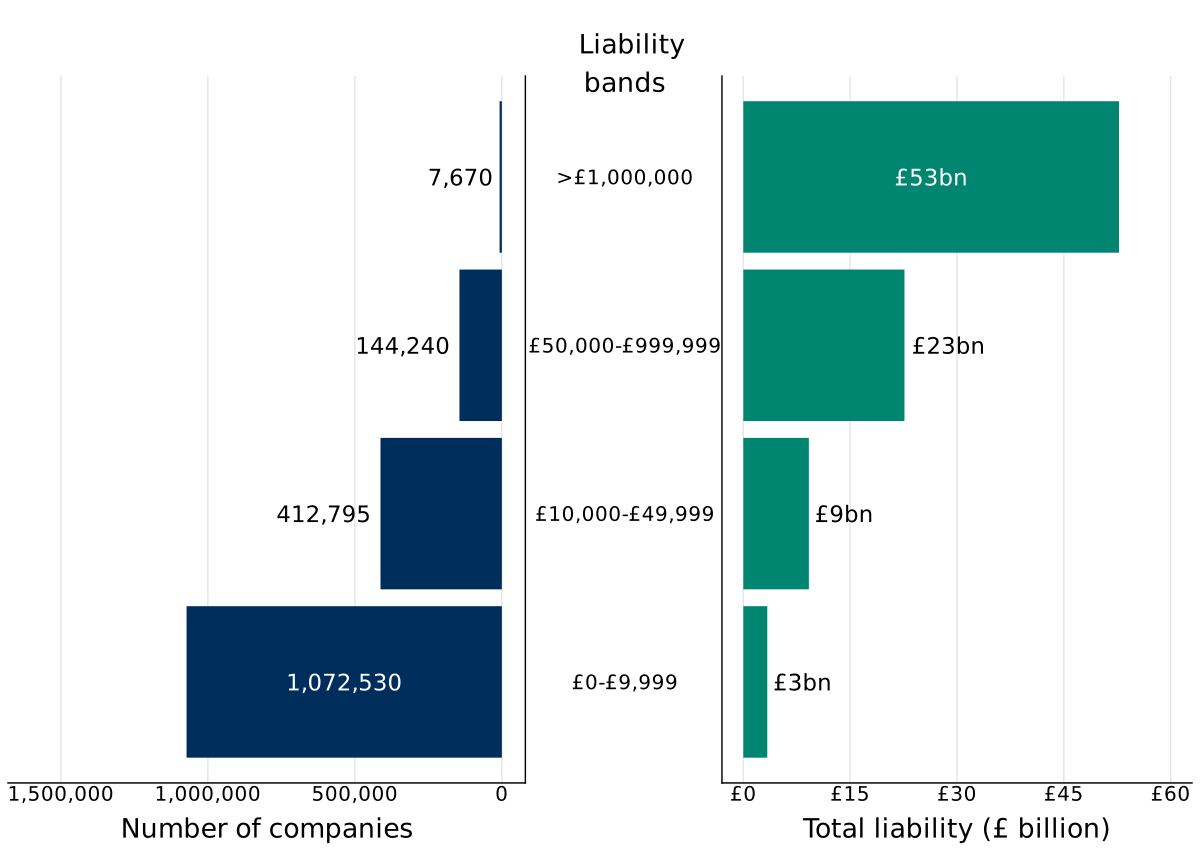
Figure 10 below groups CT liabilities for the financial year 2024 to 2025 into the following bands: £0 to £9,999; £10,000 to £49,999; £50,000 to £999,999; and above £1 million. It shows the number of companies and the total liability in each band.
Figure 10: Number of companies and their CT liabilities by liability band, financial year 2024 to 2025
The data underpinning figure 10 is within tables 9A and 9B of the Corporation Tax statistics data tables 2026.
The main points to note in figure 10 are:
- the majority of CT liabilities are accrued from a relatively small number of companies
- in financial year 2024 to 2025, 7,670 companies (0.5% of all companies who had an amount of tax to pay) had liabilities over £1 million, yet these contributed 60%, or £52.7 billion, of total CT liabilities
- in contrast, approximately 1.1 million companies (66% of all companies who had an amount to pay) had liabilities of less than £10,000 and these contributed just 4%, or £3.4 billion, of the CT liability total
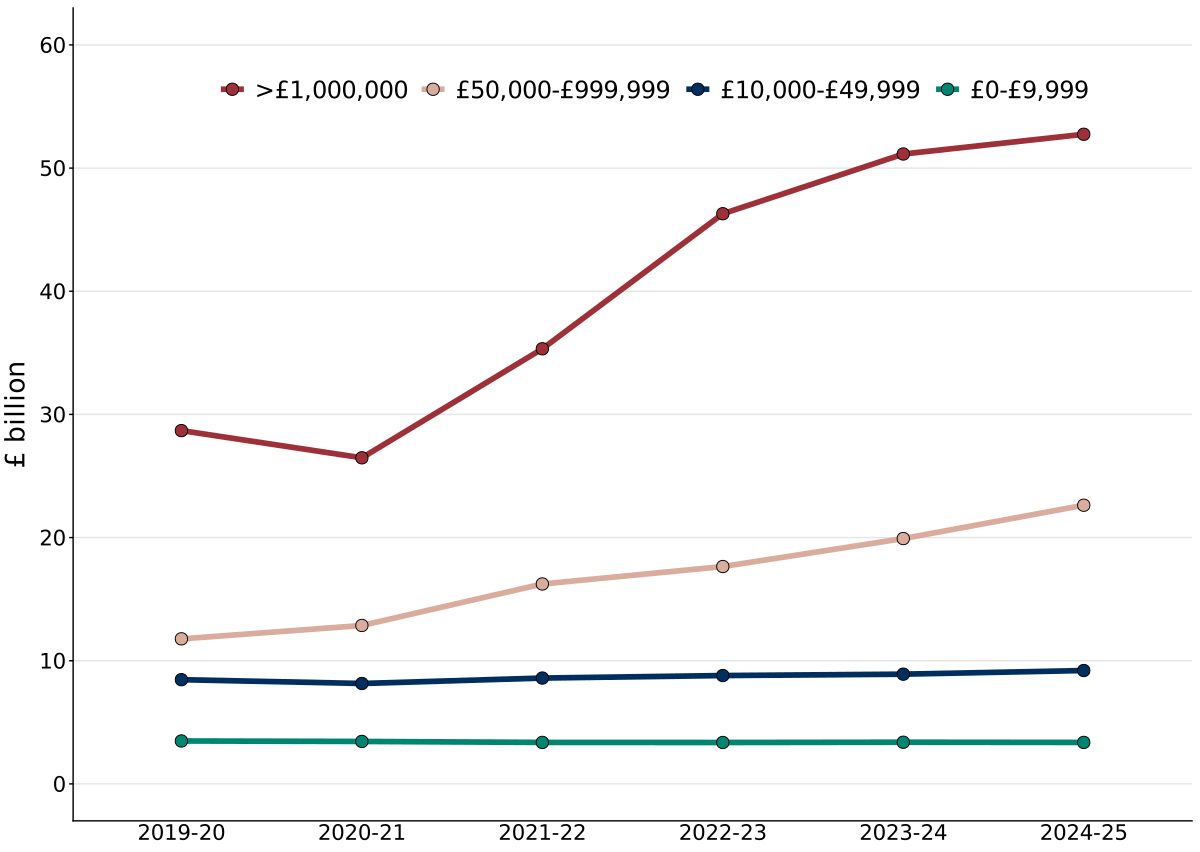
Figure 11 below shows the longer-term trend in total CT liability by band from financial year 2019 to 2020 to financial year 2024 to 2025.
Figure 11: CT liabilities by liability band, between financial years 2019 to 2020 and 2024 to 2025
The data underpinning figure 11 is within table 9A of the Corporation Tax statistics data tables 2026.
The main points to note in figure 11 are that:
- the growth in CT liabilities over the last three financial years has been mainly driven by companies paying over £1 million
- total CT liabilities from companies paying £1m increased by 49% between financial year 2021 to 2022 and 2024 to 2025, from £35.3 billion in 2021 to 2022 to £52.7 billion in 2024 to 2025
- in contrast, total liabilities from companies paying less than £10,000 remained the same between financial year 2021 to 2022 and 2024 to 2025, from £3.4 billion in 2021 to 2022 to £3.4 billion in 2024 to 2025
7. Capital allowances claimed against profits
Capital allowances are a type of tax relief for businesses for qualifying capital expenditure. They allow a company to deduct some or all of the value of an item from their profits before they pay tax. There are many types of capital allowance available to companies, including ‘full expensing’ which came into effect from 1 April 2023, replacing the ‘super deduction’ which ceased in the same financial year. More information on capital allowances can be found in the Background and Guidance accompanying this publication.
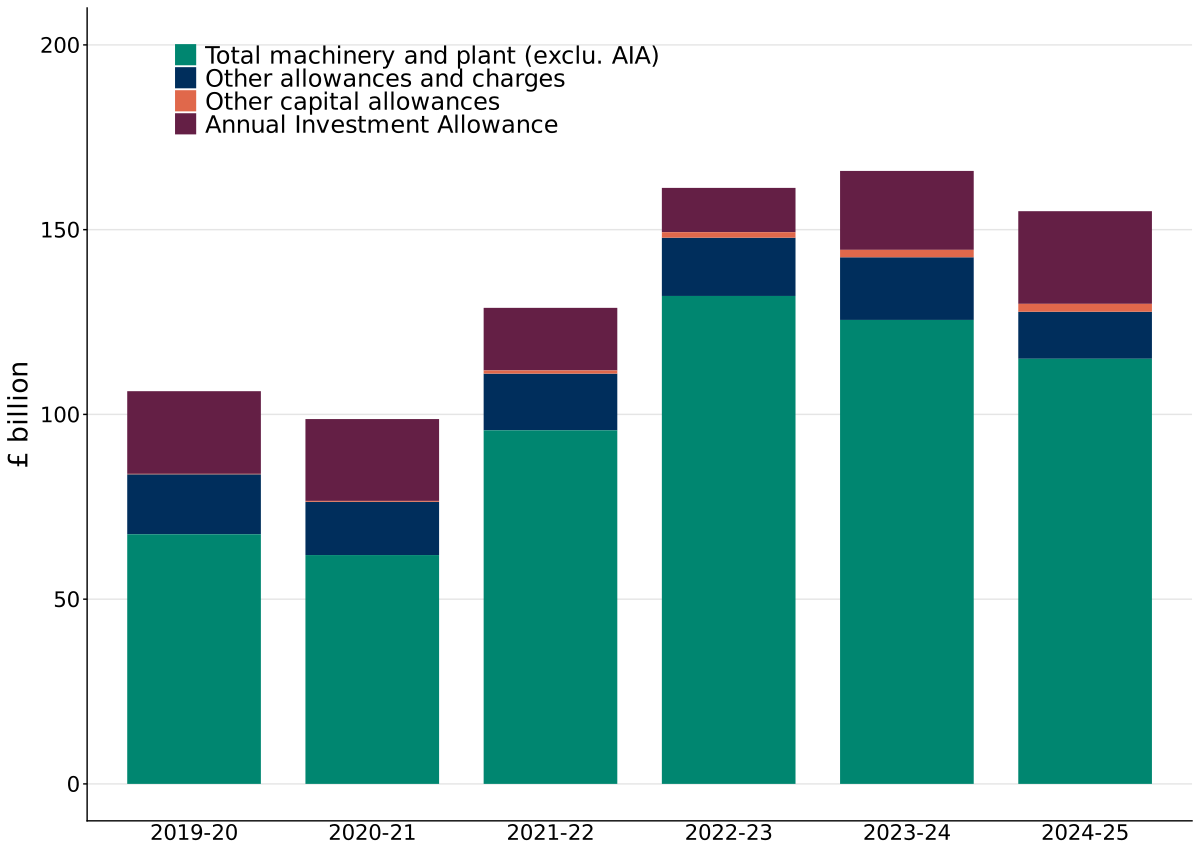
Figure 12 below shows the value of capital allowances from financial year 2019 to 2020 to financial year 2024 to 2025, by type of allowance.
Figure 12: Value of capital allowance claims minus balancing charges between financial years 2019 to 2020 and 2024 to 2025
The data underpinning figure 12 can be found in table 12A of the Corporation Tax statistics data tables 2026.
The main points to note in figure 12 are that:
- total capital allowance claims minus balancing charges, were £155.0 billion financial year 2024 to 2025, a decrease of £11 billion (7%) on the previous year
- total capital allowances in financial year 2023 to 2024 were revised upwards to £166.0 billion from £157.2 billion in last year’s publication
- Machinery and Plant (including full expensing) in financial year 2023 to 2024 was revised upwards by £7.7 billion compared with last year’s publication
- Annual Investment Allowances were £25.1 billion in financial year 2024 to 2025, an increase of £3.7 billion (17%) from financial year 2023 to 2024
Additional analysis of data in tables 13A and 13B of the Corporation Tax statistics data tables 2026 shows that 48% (£74.3 billion) of total capital allowances claims in financial year 2024 to 2025, were made by approximately 370 companies, or just 0.03% of the total number of companies who made a capital allowances claim.
As mentioned earlier in this publication, figures are subject to future amendments. Capital allowance claims are typically revised upwards. For example, in table 12A, 2023 to 2024 total machinery and plant (including full expensing) capital allowance claims have been revised from £139.2bn in last year’s publication, to £146.9bn, an upwards revision of £7.7bn.
8. Capital allowances qualifying expenditure
Companies are required to record the total amount of qualifying expenditure incurred in the accounting period.
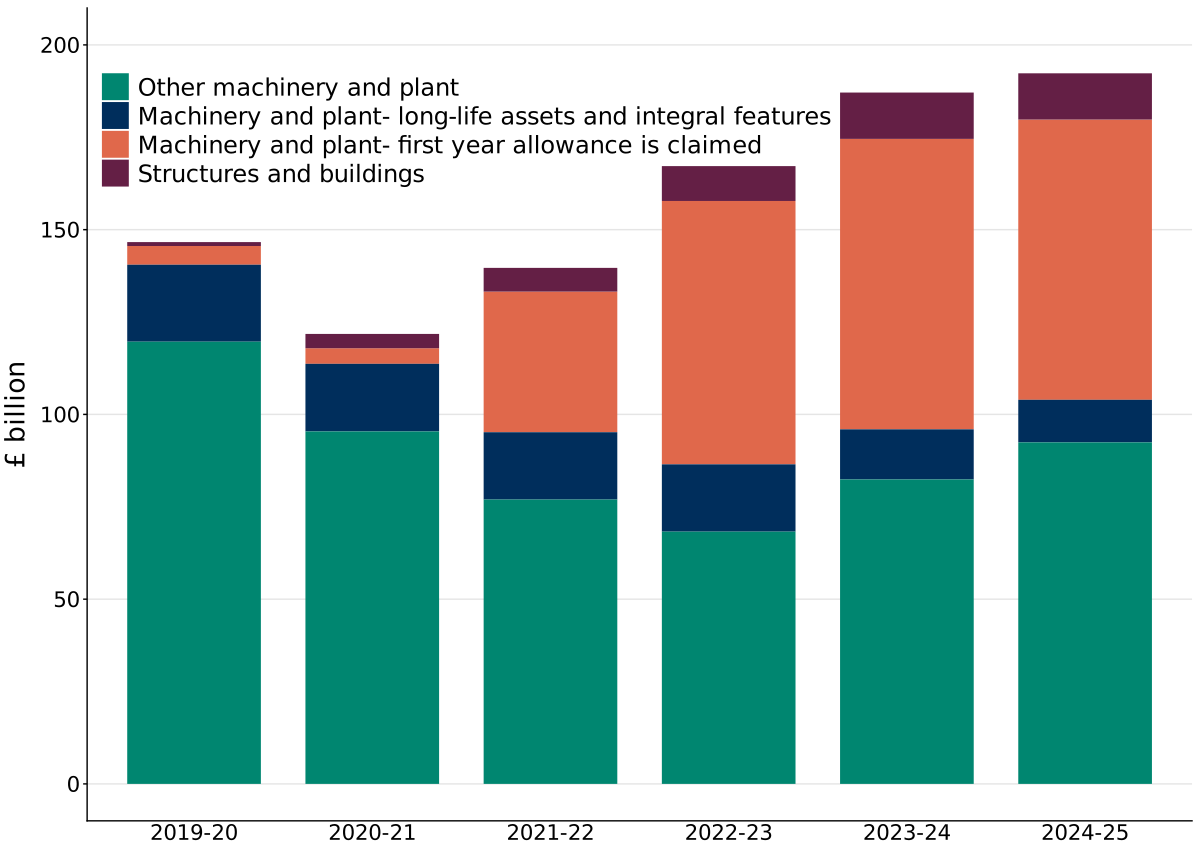
Figure 13 below shows the total amount of qualifying expenditure from financial year 2019 to 2020 to financial year 2024 to 2025, by type of expenditure.
Figure 13: Amount of capital allowances qualifying expenditure between financial years 2019 to 2020 and 2024 to 2025
The data underpinning figure 13 can be found in table 14A of the Corporation Tax statistics data tables 2026.
The main points to note in figure 13 are that:
- total qualifying expenditure continued to increase in the latest financial year, rising from £187.1 billion in 2023 to 2024 to £192.3 billion in financial year 2024 to 2025; this represents an increase of 3%
- there were significant upwards revisions to total qualifying expenditure for financial year 2023 to 2024, increasing by £11.4 billion to £187.1 billion, compared to last year’s publication figure of £175.7 billion
- across the last two financial years, there has been a decline in the value of long-life assets and integral features claiming the 6% writing down allowance and this likely to reflect companies switching to claiming the special rate first year allowance for these assets instead
9. Publication information
This is an annual publication published on 24 September 2026. The next release is scheduled for autumn 2027.
For press queries, please contact:
HMRC Press Office
Telephone: 03000 585 018
For statistical queries or feedback on this publication, please contact:
F Asaolu on CT receipts or M Dickson on CT liabilities
ct.statistics@hmrc.gov.uk