Corporation Tax statistics commentary 2021
Published 23 September 2021

© Crown copyright 2021
This publication is licensed under the terms of the Open Government Licence v3.0 except where otherwise stated. To view this licence, visit nationalarchives.gov.uk/doc/open-government-licence/version/3 or write to the Information Policy Team, The National Archives, Kew, London TW9 4DU, or email: psi@nationalarchives.gov.uk.
Where we have identified any third party copyright information you will need to obtain permission from the copyright holders concerned.
This publication is available at https://www.gov.uk/government/statistics/corporation-tax-statistics-2021/corporation-tax-statistics-commentary-2021
1. About this release
This annual publication provides a breakdown of Corporation Tax (CT) receipts and liabilities by number of companies, income, allowances, deductions, industry sector and financial year. It includes the CT, Bank Levy and Bank Surcharge receipts figures for the tax year 1 April 2020 to 31 March 2021, and the first published CT liability estimates for company accounting periods ending between 1 April 2019 to 31 March 2020.
The publication therefore provides statistics showing the initial impacts of coronavirus (COVID-19) on CT receipts but not to liabilities, as the liabilities reporting period for this release is prior to the full effects of the pandemic being felt by the UK economy.
2. Headline findings
The key findings in this year’s publication are that:
- there was a significant decrease in CT receipts in tax year 2020 to 2021, mainly due to the unwinding of the change on the due dates for CT payments, that boosted CT receipts in tax year 2019 to 2020, and the effects of COVID-19 on the UK economy
- the drop in receipts was felt across all broad industry sectors, but especially manufacturing, distribution, and oil and gas
- liabilities in the tax year 2019 to 2020 increased slightly compared with the previous year, continuing a trend of year-on-year increases that began in tax year 2015 to 2016
- as in previous years, the majority of CT liabilities were accrued by a very small percentage of companies; 56% of total CT liabilities were contributed by only 0.3% of companies who had an amount of tax to pay
- despite liabilities continuing to increase, tax year 2019 to 2020 saw a drop in gross taxable trading profits for the second year in a row
- although the finance and insurance sector remained the largest contributor to CT liabilities, its year-on-year growth included an increase of almost 200%, or £1.7 billion from life assurance companies
- without this increase, the finance and insurance sector would have seen a decrease in liabilities for the second year in a row
- the percentage of companies with zero CT liability increased slightly (almost 1%) in tax year 2019 to 2020
- claims against Annual Investment Allowance (AIA) increased dramatically in tax year 2019 to 2020 mainly due to a temporary rise in the AIA threshold that occurred between 1 January 2019 and 31 December 2020
3. What is Corporation Tax?
Corporation Tax is a direct tax charged on the profits made by companies, public corporations and unincorporated associations such as industrial and provident societies, clubs and trade associations.
It is charged on the taxable profits made in each accounting period, i.e. the period over which the company draws up its accounts. The rates of taxation are set for the financial year from 1 April to 31 March. For liability statistics within this publication, CT returns are allocated to financial years according to the end date of the accounting period.
The CT receipts and liabilities statistics in this release are presented gross of company tax credits, which means before these credits are deducted from a company’s tax bill. This is how CT is reported in the national accounts.
4. What is the difference between receipts and liabilities?
When a company submits a CT return to HMRC with details of the taxable profits for their accounting period, the amount of tax that needs to be paid is known as their liability. When a company makes a payment to HMRC in relation to CT, these are known as receipts.
Liabilities are recorded against the tax year to which they accrue, whereas receipts are recorded against the tax year in which they are paid. This is why there are receipts data for tax year 2020 to 2021, but liabilities data only up to 2019 to 2020; it will be 31 March 2022 before all companies will be required to submit their CT return form for liabilities in tax year 2020 to 2021.
The time lag between receipts and liabilities also differs by size of the company. Small companies must make their CT payment within 9 months and one day after the end of their accounting period. Large companies pay CT using a system of Quarterly Instalment Payments (QIPs) with some payments due before the end of a company’s accounting period. More information can be found on the Paying Corporation Tax if you’re a large company page of the GOV.UK website.
5. Recent changes to payment timings for the largest companies
From 1 April 2019, a new payment regime has been introduced for ‘very large’ companies which requires their CT payment be paid four times per year and four months earlier than previously required. The change was phased in; companies only moved onto the new regime once they began their new accounting period.
This resulted in a significant increase in annual CT receipts in tax year 2019 to 2020; depending on the timing of their accounting period, some ‘very large’ companies were required to make a greater number of payments during the tax year than usual.
By tax year 2020 to 2021, all affected companies were on the new payment regime and the number of in-year payments reduced for some companies, compared with the previous year. This was one of the main reasons why a reduction in CT receipts was expected for tax year 2020 to 2021.
More information about this new regime and paying Corporation Tax if you’re a very large company, can be found on the GOV.UK website.
6. Total receipts and liabilities
Chart 1: Corporation Tax liabilities and receipts between tax year 2010 to 2011 and tax year 2020 to 2021
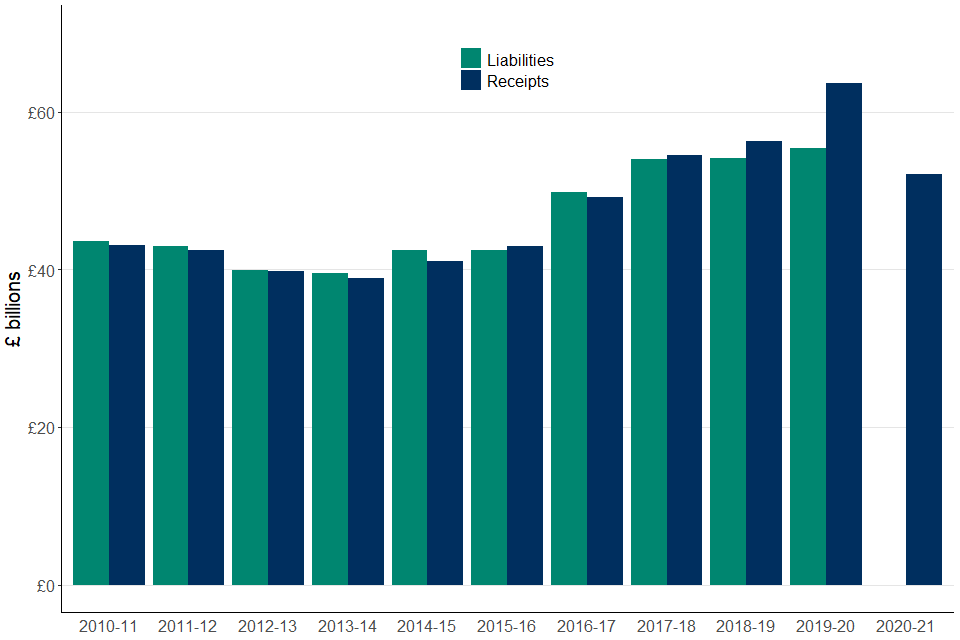
Chart 1 above shows both CT liabilities and receipts from tax year 2010 to 2011 up to tax year 2019 to 2020 for liabilities, and tax year 2020 to 2021 for receipts.
Corporation Tax receipts
The key statistics visualised in chart 1 for CT receipts show that:
- the impact of a payment timing change for the largest companies and the COVID-19 pandemic on the UK economy ended the steady year-on-year increase in CT receipts that had occurred since tax year 2013 to 2014
- receipts decreased sharply in tax year 2020 to 2021, dropping almost 20% to £52.1 billion. This is lower than the receipts received in tax year 2017 to 2018
- the payment timing change, from April 2019, brought forward the CT instalments of very large companies by four months. This had the effect of boosting CT receipts in tax year 2019 to 2020, making the subsequent fall in receipts in tax year 2020 to 2021 appear even greater
Corporation Tax liabilities
The main points to note in chart 1 for CT liabilities are that:
- liabilities have steadily increased from £39.5 billion in 2013 to 2014 to £55.4 billion in 2019 to 2020 – an increase of 40% over a 6-year period
- liabilities increased by 2%, or £1.3 billion, in tax year 2019 to 2020 compared with the previous year
- the largest increases in liabilities in recent years, occurred in tax year 2016 to 2017 and tax year 2017 to 2018 with year-on-year growth of 17% and 9% respectively
7. Corporation Tax receipts by broad industry sector
Chart 2: Corporation Tax receipts by broad industry sector, between tax year 2010 to 2011 and tax year 2020 to 2021
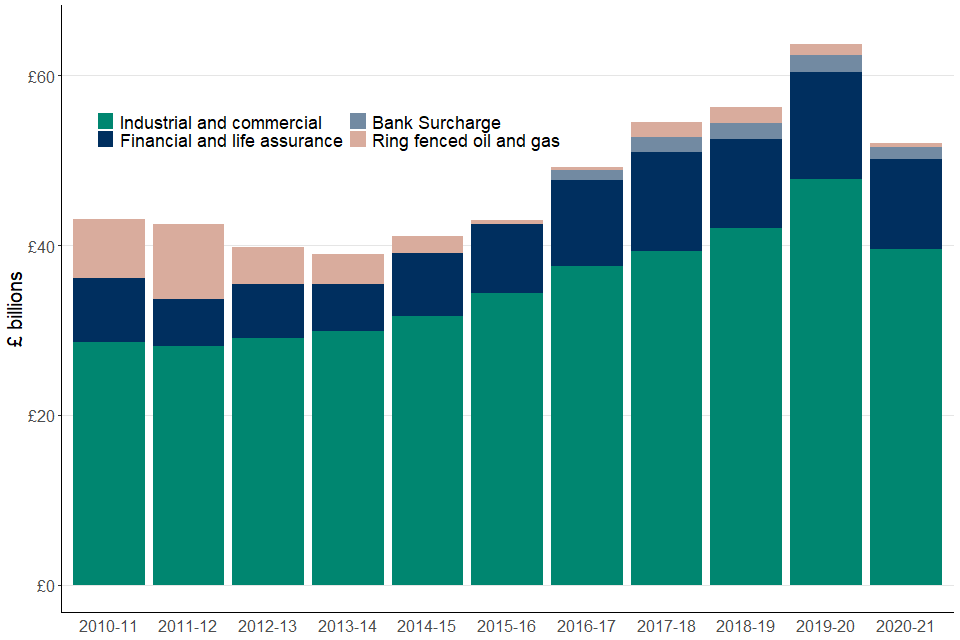
Chart 2 above shows CT receipts for the last 10 tax years, with each year split into the categories of industrial and commercial; financial and life assurance; bank surcharge; and ring-fenced oil and gas.
The chart shows that CT receipts have decreased across all broad industry sectors in the latest tax year – 2020 to 2021. Key statistics to note include:
- for onshore CT, the largest percentage decreases were seen in the Distribution and Manufacturing sectors with reductions of 28% (£1.5 billion) and 26% (£1.5 billion) respectively
- receipts from ring fenced oil and gas companies decreased by over 60%, to £498 million, largely driven by the oil price crash in 2020 caused by the COVID-19 pandemic
- the bank surcharge, which is an additional charge on the profits of banks, saw a 29%, or £570 million, decrease on the previous tax year. This was a greater percentage reduction in CT receipts than the overall Finance sector
- Financial and Life Assurance sector receipts totalled £10.6 billion in tax year 2020 to 2021 – a decrease of 16% from the previous year
- despite the significant decrease in receipts, the percentage contribution of each sector to the overall CT receipts total, has remained very similar
- the industrial and commercial sector contributed approximately 76% to the overall CT receipts total, finance and life assurance contributed 20%, bank surcharge 3%, and offshore corporation tax 1%
8. Corporation Tax liabilities by sector
Chart 3: Corporation Tax liabilities by SIC sector, tax years 2018 to 2019 and 2019 to 2020
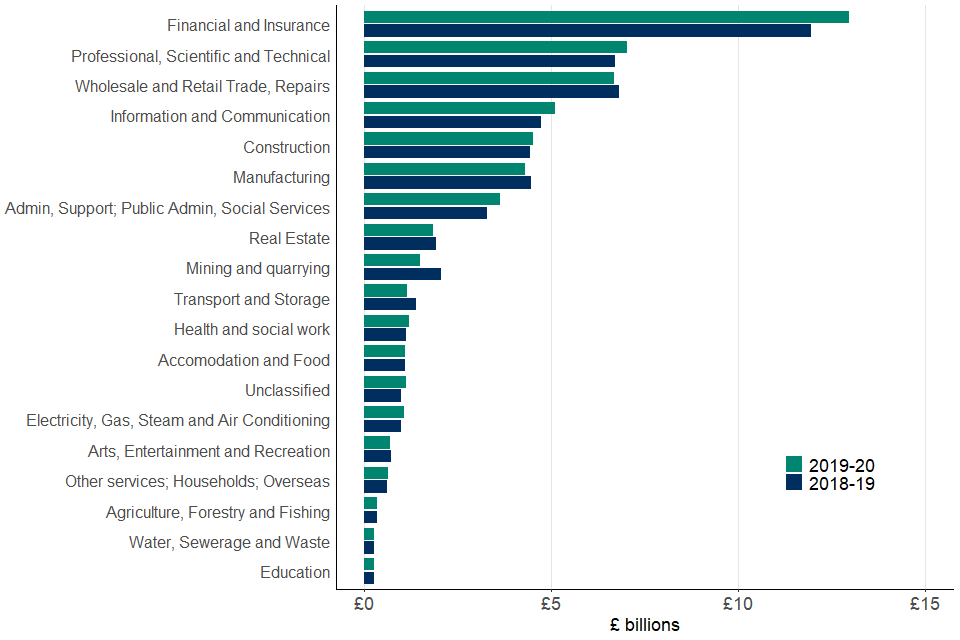
Chart 3 above shows CT liabilities by SIC sector for both tax year 2018 to 2019 and 2019 to 2020, ordered by size of liabilities. Some sectors have been combined in order to protect taxpayer confidentiality.
The main points to note in chart 3 are:
- of the 18 sectors represented, 12 saw a year-on-year increase in CT liabilities, and 6 a year-on-year decrease
- the largest liabilities increase occurs in the Financial and Insurance SIC sector, increasing by £1 billion or 8%; this growth was driven by an almost 200% increase (£1.7 billion) in liabilities accrued by life assurance companies
- the reason for this growth was an increase in bond prices over the course of 2019, resulting in large profits for life assurance companies with significant bond holdings
- the Mining and Quarrying sector saw the largest decrease in liabilities, dropping by 28%, or £580 million; a complete reversal on last year’s statistics which saw Mining and Quarrying have the greatest proportional increase
- in tax year 2019 to 2020 the Financial and Insurance sector contributed 23% of total CT liabilities, however this sector represents only 2.6% of companies who paid CT
- the sector that contained the largest proportion of CT taxpayers was Professional, Scientific and Technical, with 21% of the total
9. Companies liable for Corporation Tax
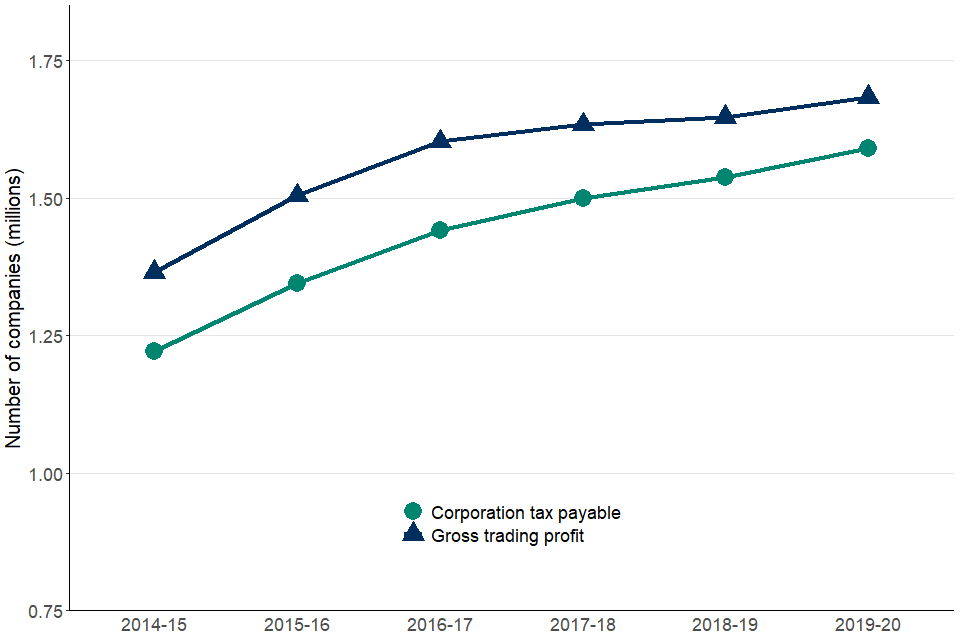
Chart 4 below compares the number of companies who reported gross taxable trading profits with the number of companies who were ultimately required to pay CT, over the last 6 available tax years.
The chart indicates that tax year 2019 to 2020 continued the recent trend of narrowing the gap between the number of companies declaring gross taxable trading profits, and the number who are required to pay CT. There was a 15% year-on-year reduction of this gap.
Companies with gross taxable trading profit grew by 2% to 1.68 million, whereas the number of companies required to pay CT increased by 3% to 1.59 million.
Chart 4: Companies with gross taxable trading profit and CT payable, between tax year 2014 to 2015 and tax year 2019 to 2020
10. How are chargeable profits calculated?
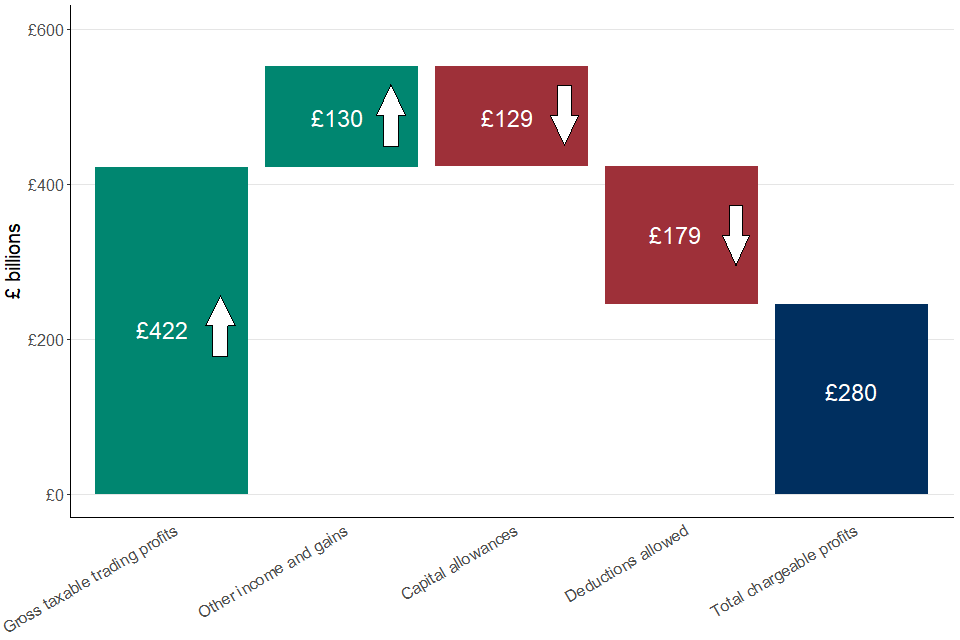
Gross taxable trading profits are added to other taxable income and net capital gains. Capital allowances and trading losses brought forward from previous years are then set against these profits. Charges, other allowable deductions and group relief are then subtracted, to obtain profits chargeable to CT.
For tax year 2019 to 2020, chart 5 below visualises the main components and amounts that transform gross trading profit into total chargeable profits.
It shows that set-offs, including capital allowances and other allowable deductions, reduced companies’ CT liability by 56% or £308 billion in tax year 2019 to 2020. This increased from 55% (£300 billion) in tax year 2018 to 2019 and 54% (£297 billion) in 2017 to 2018, indicating that companies were able to offset slightly more of their gross trading profits and other income.
The components of chart 5 sum to £244 billion total chargeable profits rather than the £280 billion displayed, as not all reliefs can be claimed.
Chart 5: Profits, losses and deductions leading to total chargeable profits in tax year 2019 to 2020
11. Corporation Tax liabilities by ‘size’ of company
Chart 6 below groups CT liabilities into the bands £0 to £9,999; £10,000 to £49,999; £50,000 to £999,999; and above £1 million. For the tax year 2019 to 2020, it then shows the number of companies and the total liability that sit in each band.
The chart illustrates how the majority of CT liabilities are accrued from a relatively small number of companies.
In tax year 2019 to 2020, approximately 4,300 companies (0.3% of all companies who had an amount of tax to pay) had liabilities over £1 million, yet these contributed 56%, or £30.9 billion, of total CT liabilities.
In contrast, approximately 1.1 million companies (67% of all companies who had an amount of tax to pay) had liabilities of less than £10,000 and these contributed just 6%, or £3.5 billion, of the CT liability total.
Chart 6: Number of companies and their CT liabilities by liability band, tax year 2019 to 2020
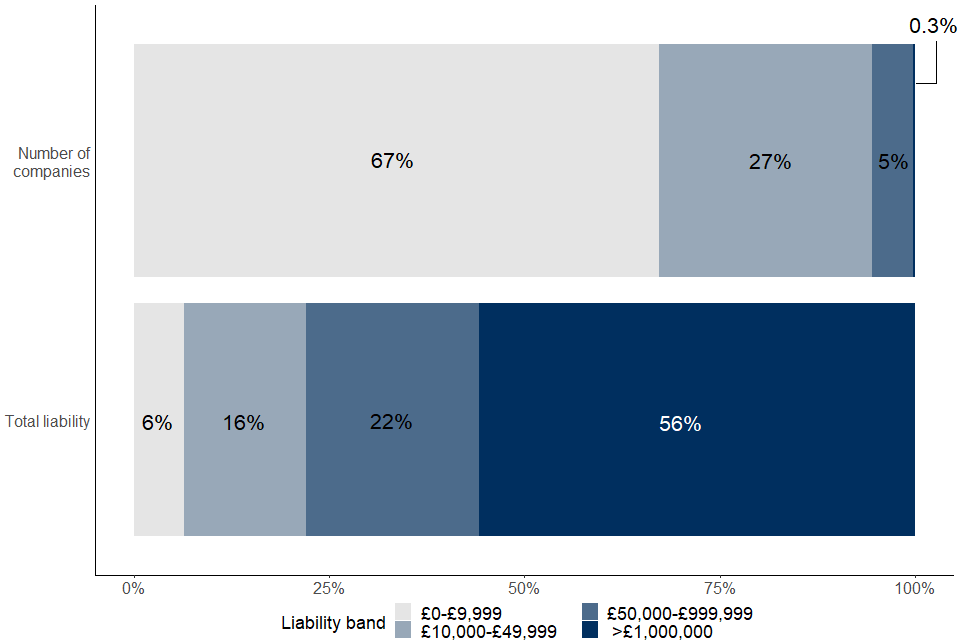
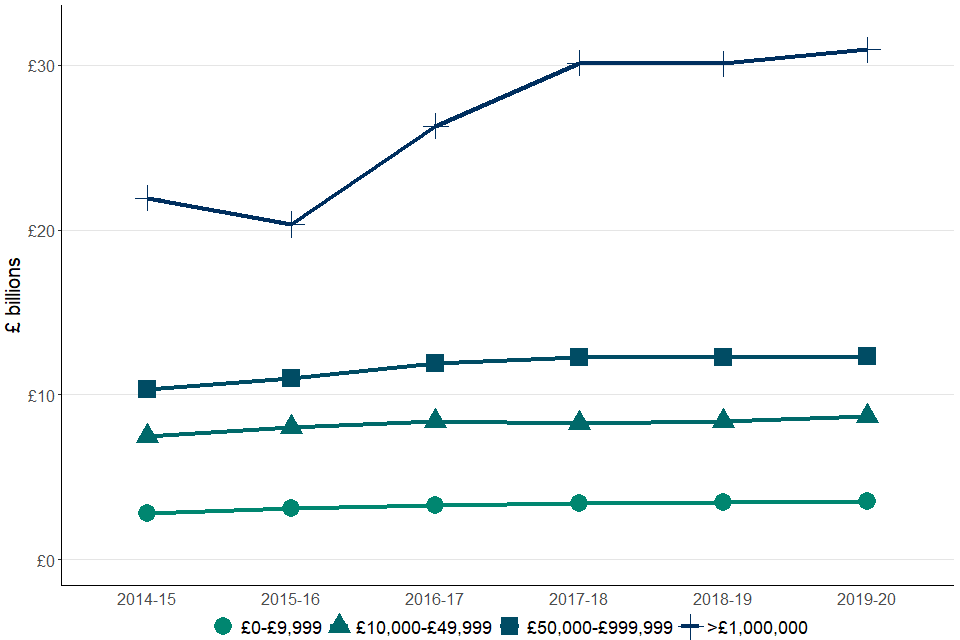
Chart 7 below shows how the amount of liabilities within each tax band has changed over the last 6 available tax years.
Liabilities from the highest band (above £1 million) have increased steadily since tax year 2015 to 2016 (£20.3 billion) before plateauing in 2017 to 2018 at £30.1 billion. Tax year 2019 to 2020 saw them increase again to £30.9 billion, an increase of 3%. This increase over the last 4 years has been primarily due to the growth in liabilities in the Finance and Insurance sector.
Liabilities from the lowest band (£0 to £9,999) show the smallest year-on-year growth at just 0.6% in tax year 2019 to 2020.
Chart 7: Total CT liability by liability band, between tax year 2014 to 2015 and 2019 to 2020
12. Capital allowances
Capital allowances are a deduction made against taxable profits for items of capital investment. The most common ways of claiming capital allowances are Annual Investment Allowances, Main & Special Rate Writing Down Allowances, and other allowances designed to encourage investment in certain sectors and locations.
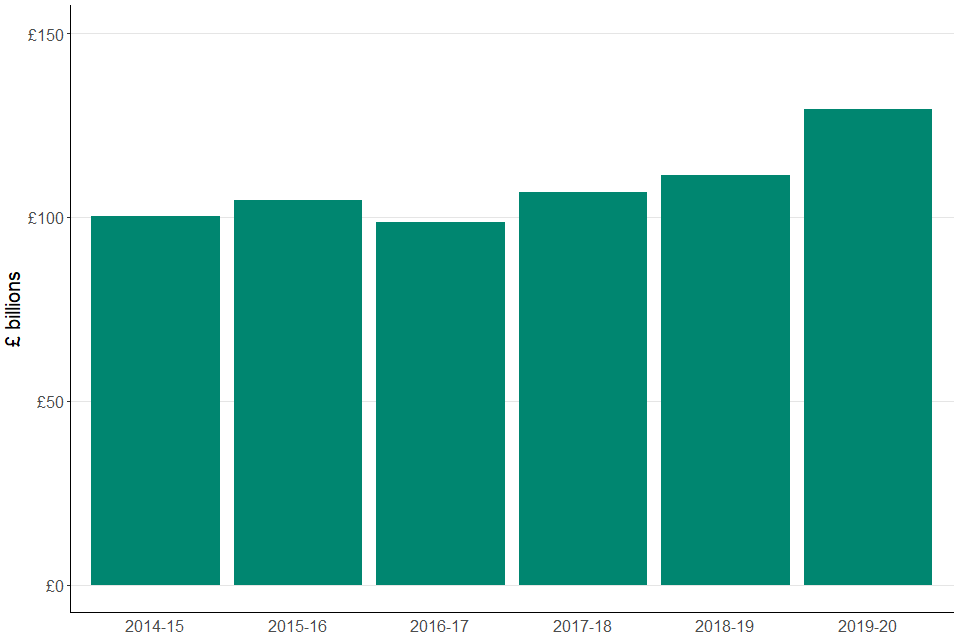
Chart 8 below shows how capital allowances minus balancing charges, have changed between tax year 2014 to 2015 and tax year 2019 to 2020.
In 2019 to 2020 net capital allowance claims increased to £129 billion – a 16% increase on the previous year. Over the 6 tax years displayed in the chart, net capital allowances have increased by almost 30% or £29 billion.
Chart 8: Capital allowance claims minus balancing charges, between 2014 to 2015 and 2019 to 2020
Annual Investment Allowance (AIA)
There was a large increase in AIA claims in tax year 2019 to 2020, increasing by 55% or £8 billion, to £22.7 billion.
The most likely reason for this significant jump was a rise in the AIA threshold on the 1 January 2019, from £200,000 to £1 million. This temporary threshold increase expired on 31 December 2020 but meant that the full 2019 to 2020 tax year was included.
Similar increases and decreases in AIA claims in past years have appeared to follow changes to the AIA threshold.
Capital allowance claims by SIC Sector
Chart 9: Capital allowance claims by SIC sector, tax year 2019 to 2020

Chart 9 above breaks down capital allowance claims by type of claim and SIC sector for tax year 2019 to 2020.
The main themes displayed in chart 9 are that:
- the Manufacturing sector claims the greatest amount of capital allowances, accounting for £17.8 billion or 14% of the total
- five sectors make up 52% or £67 billion of the capital allowance claims: Manufacturing; Wholesale and Retail Trade, Repairs; Admin and Support Services, Public Admin, Defence and Social Services; Financial and Insurance; and Information and Communication
- the highest proportional year-on-year increase in capital allowance claims occurred in the Agriculture, Forestry and Fishing sector, which increased by 35% or £676 million
- all sectors saw an increase in AIA claims in tax year 2019 to 2020, with the largest occurring in Manufacturing which saw a £1.5 billion or 70% increase
- the Mining and Quarrying and Information and Communication sectors have the highest proportions of capital allowances in the ‘Other assets’ category, with 49% and 23% of their claims being recorded in this category respectively
13. Publication Information
This is an annual publication published on 23 September 2021. The next release is scheduled for autumn 2022.
For press queries, please contact:
- HMRC Press Office on 03000 585 018
For statistical queries or feedback on this publication, please contact:
- D Pritchard – CT receipts
- N Yates – CT liabilities