Commentary - Company Insolvency Statistics January to March 2021
Published 30 April 2021

© Crown copyright 2021
This publication is licensed under the terms of the Open Government Licence v3.0 except where otherwise stated. To view this licence, visit nationalarchives.gov.uk/doc/open-government-licence/version/3 or write to the Information Policy Team, The National Archives, Kew, London TW9 4DU, or email: psi@nationalarchives.gov.uk.
Where we have identified any third party copyright information you will need to obtain permission from the copyright holders concerned.
This publication is available at https://www.gov.uk/government/statistics/company-insolvency-statistics-january-to-march-2021/commentary-company-insolvency-statistics-january-to-march-2021
Released
30 April 2021
Next release
30 July 2021
Media enquiries
Steven Fifer
+44 (0)30 3003 1568
Statistical enquiries
Becca Wedge-Roberts (author)
Kate Palmer (responsible statistician)
1. Main messages for England and Wales
- One in 396 active companies (at a rate of 25.3 per 10,000 active companies) entered liquidation between 1st April 2020 and 31st March 2021. This is a decrease from the 40.5 per 10,000 active companies that entered liquidation in the 12 months ending 31st March 2020.
- During Q1 2021, there were 2,384 (seasonally adjusted) registered company insolvencies, as shown in Figure 1, comprising 2,047 creditors’ voluntary liquidations (CVLs), 108 compulsory liquidations, 192 administrations and 37 company voluntary arrangements (CVAs). There were no receivership appointments.
- After seasonal adjustment, the number of company insolvencies was 22% lower than in Q4 2020 and 38% lower than in Q1 2020. This was driven by a drop in all company insolvency procedures.
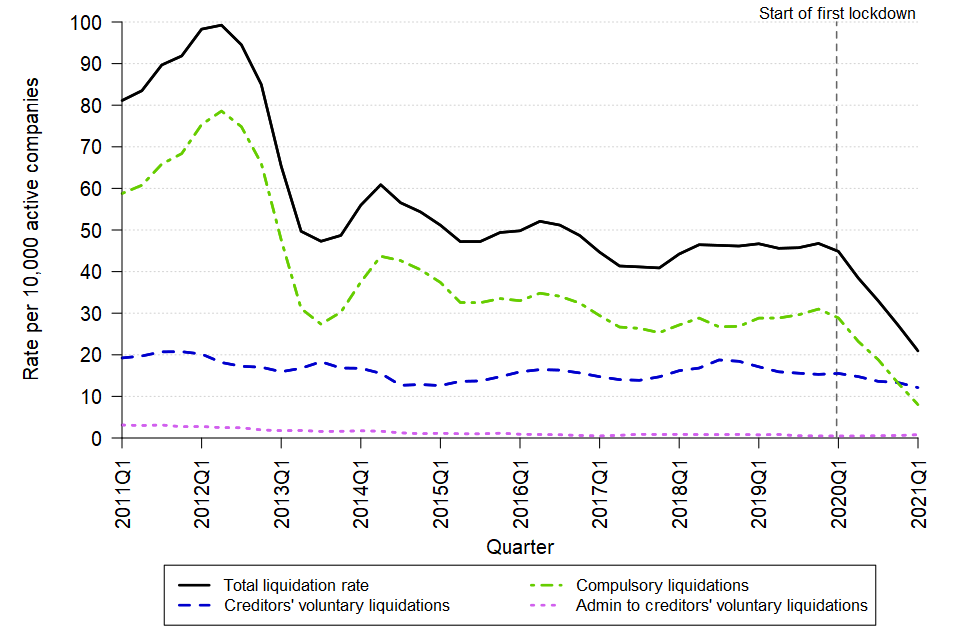
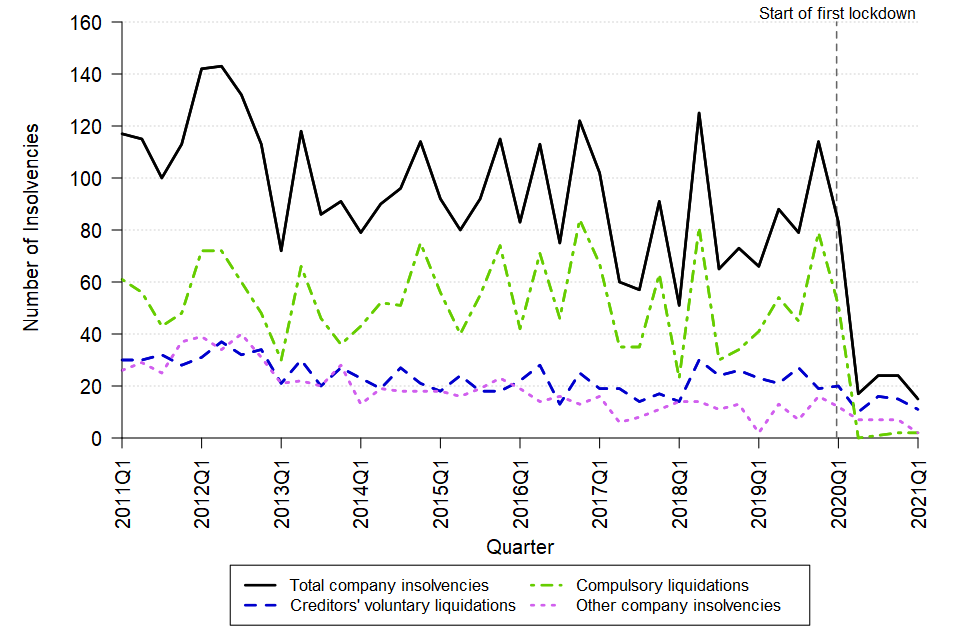
Figure 1: Registered company insolvencies continued to drop in Q1 2021 across all insolvency procedures
England and Wales, Q1 2011 to Q1 2021, seasonally adjusted
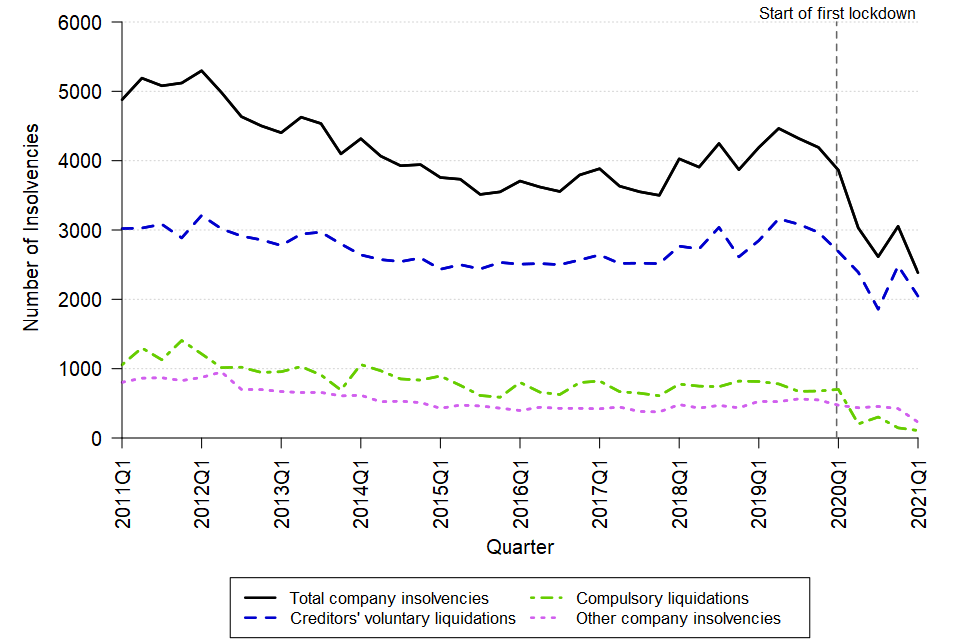
A line chart showing the change over time in the quarterly number of company insolvencies in England and Wales between Q1 2011 and Q1 2021. The data can be found in Table 1a of the accompanying tables. [Sources: Insolvency Service (compulsory liquidations only); Companies House (all other insolvency procedures)]
Note that bulk CVLs were previously presented in Figure 1. These have been removed but can be found in the accompanying tables. Further information on bulk CVLs can be found in the Glossary.
The long-term series prior to Q1 2011 can be found in the csv file that accompanies this release.
Overall numbers of company insolvencies have remained low since the start of the first UK lockdown in March 2020, when compared with pre-pandemic levels. This is likely to be partly driven by government measures put in place in response to the coronavirus (COVID 19) pandemic, including:
- Temporary restrictions on the use of statutory demands and certain winding-up petitions (leading to company compulsory liquidations).
- Enhanced government financial support for companies and individuals.
As the Insolvency Service does not record whether an insolvency is directly related to the coronavirus pandemic, it is not possible to state its direct effect on insolvency volumes.
2. Things you need to know about this release
This statistics release contains the latest data on company insolvency in the UK, presenting the numbers of companies who have entered a formal insolvency procedure after being unable to pay their debts. Information is presented separately for England and Wales, Scotland and Northern Ireland.
The Insolvency Service separately publishes monthly experimental statistics to provide more up to date information on the numbers of company and individual insolvencies during this time of economic uncertainty. However, they have not replaced the quarterly National Statistics, since the information presented on a monthly basis is less granular and is less reliable for monitoring changes in trends over time. Note that the monthly statistics on company insolvencies may not be consistent with data presented within this statistical release.
Underlying data for these quarterly statistics for England and Wales were adjusted where there was evidence of seasonality, to account for variation in company insolvencies across the year and allow for comparison to the most recent period within years. Data for Scotland and Northern Ireland were not adjusted. The seasonal adjustment models are typically reviewed on an annual basis. However, the trend in individual insolvencies during the 2020/21 financial year has reflected a very different pattern to that seen in previous years; largely a result of the coronavirus (COVID-19 pandemic). Therefore the 2021 review was not conducted, and 2021 data will continue to be seasonally adjusted using the 2020 model. See methodology section for further details.
Quarters referred to in this publication are calendar year quarters, such that Q1 2021 is the period from 1st January to 31st March 2021.
2.1 Designation as National Statistics
The United Kingdom Statistics Authority has designated these statistics as National Statistics, in accordance with the Statistics and Registration Service Act 2007 and signifying compliance with the Code of Practice for Statistics. Once statistics have been designated as National Statistics it is a statutory requirement that the Code of Practice shall continue to be observed.
The last compliance review was conducted in July 2019.
Designation can be broadly interpreted to mean that the statistics meet identified user needs; are well explained and readily accessible; are produced according to sound methods, and are managed impartially and objectively in the public interest.
3. Company insolvency in England and Wales
3.1 Numbers of company insolvencies
After seasonal adjustment, there were 2,384 company insolvencies registered in Q1 2021, 22% lower than the number of company insolvencies registered in the previous quarter and 38% lower than during the same quarter in the previous year.
Creditors’ voluntary liquidations (CVLs) were the most common company insolvency procedure (86% of cases), followed by administrations (8% of cases), compulsory liquidations (5% of cases) and company voluntary arrangements (CVAs; 2% of cases). There were no receivership appointments, which are now rare (see glossary for further details) and due to small numbers percentage changes were not calculated. A summary of company insolvencies since Q1 2020 can be found in Table 1. The long-term series prior to Q1 2020 can be found in the excel and csv files that accompany this release.
Unlike the monthly statistics, quarterly statistics are seasonally adjusted to account for seasonal variation in insolvencies across the year and allow for comparison to the most recent period within years.
Table 1: The number of company insolvencies in Q1 2021 continued to be lower than pre-pandemic levels
England and Wales, Q1 2020 to Q1 2021, seasonally adjusted
| Total company insolvencies | Compulsory Liquidations | CVLs | Administrations | CVAs | Receiverships | |
|---|---|---|---|---|---|---|
| 2020Q1 | 3,863 | 701 | 2,689 | 403 | 69 | 1 |
| 2020Q2 | 3,029 | 203 | 2,390 | 388 | 47 | 1 |
| 2020Q3 | 2,615 | 302 | 1,858 | 391 | 63 | 1 |
| 2020Q4 | 3,053 | 146 | 2,483 | 344 | 80 | 0 |
| 2021Q1 | 2,384 | 108 | 2,047 | 192 | 37 | 0 |
| Percentage change, latest quarter (2021 Q1) compared with: | ||||||
| 2020Q4 | -22% | -26% | -18% | -44% | -54% | - |
| 2020Q1 | -38% | -85% | -24% | -52% | -46% | - |
Sources: Insolvency Service (compulsory liquidations only); Companies House (all other insolvency procedures)
CVLs
The overall decrease in company insolvencies in Q1 2021 was mainly driven by a drop in CVLs which accounted for 86% of all company insolvencies. These decreased by 18% from Q4 2020 and were 24% lower than during the same quarter last year.
Compulsory liquidations
The number of compulsory liquidations in Q1 2021 was lower than numbers in both the previous quarter and the same quarter of 2020 (by 26% and 85% respectively).
Administrations
The number of administrations in Q1 2021 was lower than the numbers in both the previous quarter and the same quarter of the 2020 (by 44% and 52% respectively).
CVAs
The number of CVAs was lower in Q1 2021 than in Q4 2020 and Q1 2020 (by 54% and 46% respectively).
Receivership appointments
There were no receiverships in Q1 2021, or in the previous quarter.
Since the start of the first UK lockdown the overall numbers of company insolvencies have remained low compared to pre-pandemic levels. The overall reduction in company insolvencies is likely to be in part driven by the range of government support put in place to financially support companies in response to the coronavirus (COVID-19) pandemic. Further details can be found on the Gov.uk website.
The Corporate Insolvency and Governance Act 2020 that came into force on 26 June 2020 introduced new measures to support businesses including: a new moratorium to give companies breathing space from their creditors while they seek a rescue, and a new Companies Act procedure, known as a restructuring plan that allows companies to restructure unmanageable debt. The aim behind both measures is to rescue eligible companies as a going concern where possible, rather than jumping straight into an insolvency procedure.
Between 26 June 2020 and 31 March 2021, four companies had obtained a moratorium and five companies had a restructuring plan sanctioned by the court. Moratoriums and restructuring plans are not formal insolvency procedures and are therefore not presented in the accompanying tables.
3.2 Liquidation rates per 10,000 active companies
In the four quarters ending Q1 2021, the company liquidation rate was 25.3 per 10,000 active companies in England and Wales (Table 2 and Figure 2). This corresponds to 1 in 396 companies becoming liquidated in the 12 months ending Q1 2021.
The insolvency rate gives an indication of the probability of a company entering liquidation in the previous 4 quarters. As the rates are calculated as a proportion of the total number of adults, they are more comparable over longer time periods than the absolute numbers.
The rates presented for each quarter reflect a 4-quarter rolling rate per 10,000 active companies. Therefore, the Q1 2021 rates, for example, were calculated using data covering the period Q2 2020 to Q1 2021.
Table 2: The liquidation rate in the 12-month period ending Q1 2021 was lower than in the 12-month period ending Q1 2020
England and Wales, 4-quarter rolling rate per 10,000 active companies
| Company insolvencies | Compulsory Liquidations | CVLs | CVL following Administration | |
|---|---|---|---|---|
| 2020Q1 | 40.5 | 7.6 | 31.6 | 1.3 |
| 2020Q2 | 36.9 | 6.0 | 29.5 | 1.4 |
| 2020Q3 | 32.2 | 4.9 | 25.9 | 1.3 |
| 2020Q4 | 29.2 | 3.5 | 24.3 | 1.5 |
| 2021Q1 | 25.3 | 1.9 | 21.8 | 1.5 |
| Change in rate per 10,000 active companies, 12 months ending latest quarter (2021 Q1) compared with: | ||||
| 2020Q4 | -3.9 | -1.6 | -2.4 | 0.1 |
| 2020Q1 | -15.3 | -5.7 | -9.8 | 0.2 |
Source: Insolvency Service (compulsory liquidations only); Companies House (all other insolvency procedures)
Change in rate numbers may not equal the difference in rates presented due to rounding.
The long-term series prior to Q1 2011 can be found in the excel and csv files that accompany this release.
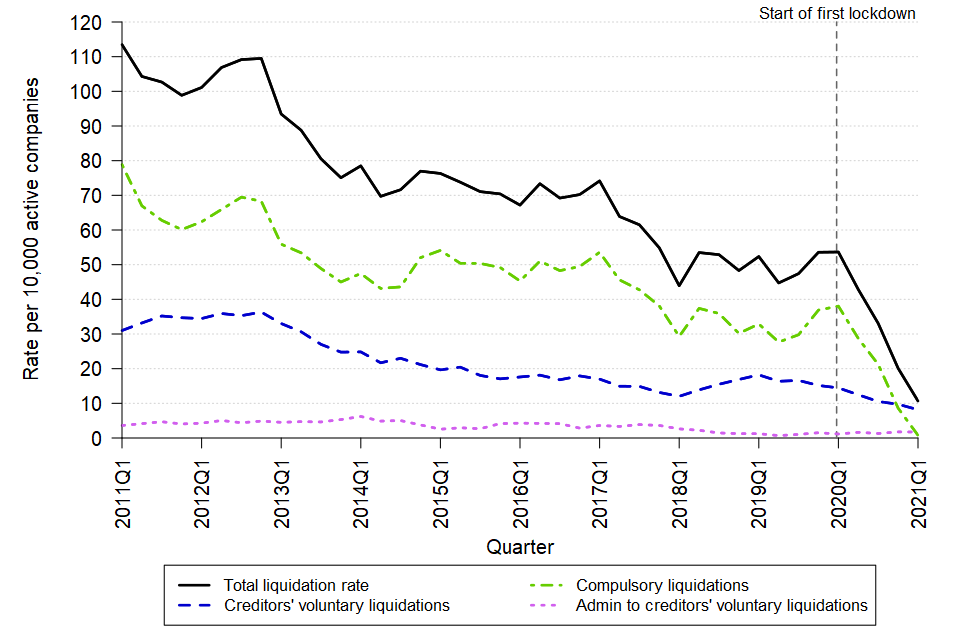
The overall rate of company insolvency for the four quarters ending Q1 2021 was lower than the rates of company insolvency for both Q4 2020 and Q1 2020.
In the four quarters ending Q1 2021:
- The rate of compulsory liquidation fell by 1.6 from Q4 2020, and by 5.7 from Q1 2020;
- the rate of CVLs fell by 2.4 from Q4 2020, and by 9.8 from Q1 2020; and
- the rate of CVLs after administration increased by just 0.1 from Q4 2020 and by 0.2 from Q1 2020. Note that CVLs following administration are not new insolvency procedures, and are counted as administrations in Table 1.
Figure 2: The liquidation rate in the 12 months ending Q1 2021 fell compared to the 12 months ending Q1 2020
England and Wales, 4-quarter rolling rate per 10,000 active companies, not seasonally adjusted
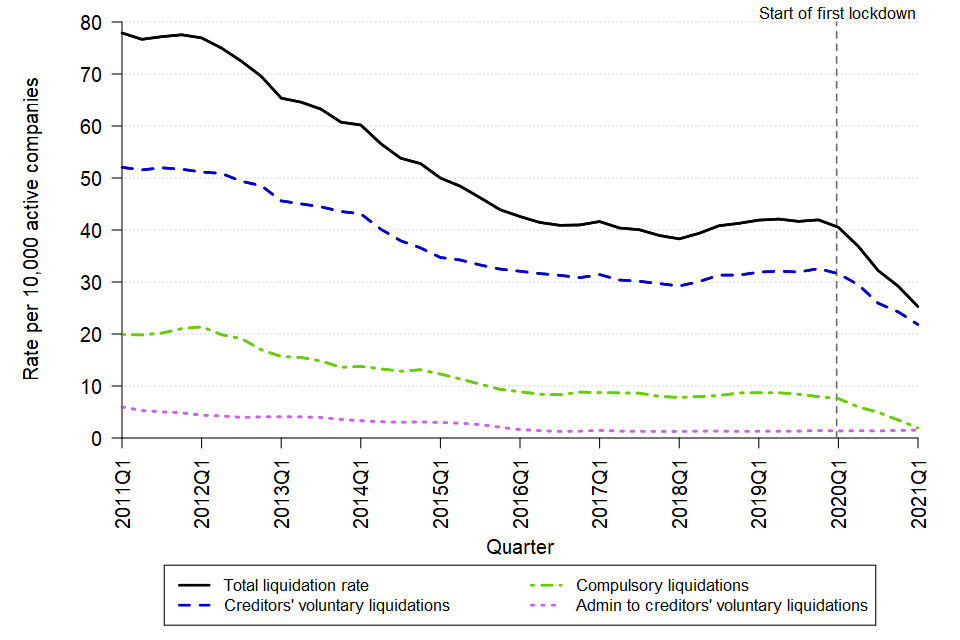
A line chart showing the change over time in the liquidation rate in England and Wales between Q1 2011 and Q1 2021. The data can be found in Table 3a of the accompanying tables. [Sources: Insolvency Service (compulsory liquidations only); Companies House (all other insolvency procedures)]
3.3 Company insolvencies by industry (SIC 2007)
The following analysis excludes insolvencies where the company was unknown, non-trading or dormant (261 in the 4 quarters ending Q1 2021, compared to 303 in the 4 quarters ending Q1 2020). In some cases, confirmation of industry sector for compulsory liquidations may be delayed by one quarter or more and therefore overall insolvencies by industry are provisional.
The three industries (in accordance with SIC 2007) that experienced the highest number of insolvencies in the 12 months ending Q1 2021 were:
- Construction (1,721 insolvencies, 16% of cases with industry captured);
- Wholesale and retail trade; repair of vehicles (1,425 insolvencies, 13% of cases with industry captured); and
- Accommodation and food services activities (1,404 insolvencies,13% of cases with industry captured).
The construction industry tends to have the highest quarterly level of insolvencies of any industrial grouping.
Decreases in insolvencies were seen across most industries in the previous 4 quarters compared to the 12 months ending Q1 2020, as shown in Figure 3. Notably, insolvencies in the construction industry were 44% lower than during the 12 months ending Q1 2020.
The numbers in these categories may likely to be driven by the number of active companies in a given category rather than the relative likelihood of companies in each industry entering insolvency.
Figure 3: Most industries saw fewer insolvencies in the four quarters ending Q1 2021 than in the period ending Q1 2020
England and Wales, Q2 2019 to Q1 2021, non-seasonally adjusted
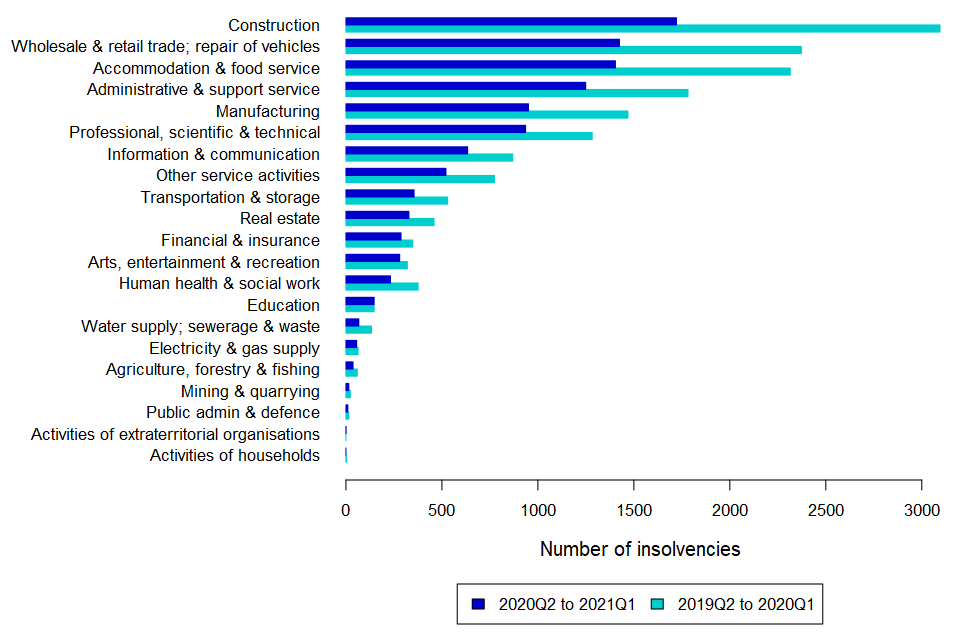
A bar chart showing number of company insolvencies by industry in England and Wales in the four quarters ending Q1 2021 and the four quarters ending Q1 2020. The data can be found in Table A1a of the accompanying industry tables. [Sources: Insolvency Service (compulsory liquidations only); Companies House (all other insolvency procedures)]
4. Company insolvency in Scotland
Legislation relating to company insolvency in Scotland is devolved. The Accountant in Bankruptcy, Scotland’s Insolvency Service, administers company insolvency in Scotland. The figures below are not seasonally adjusted.
In Q1 2021, there were 91 total company insolvencies in Scotland, 61% lower than during the same quarter of 2020. This comprised 30 compulsory liquidations, 54 CVLs, 5 administrations and 2 CVAs. There were no receivership appointments. These numbers are shown in Figure 4.
Figure 4: Company insolvencies were lower in Q1 2021 than in the same quarter last year
Scotland, Q1 2011 to Q1 2021, not seasonally adjusted
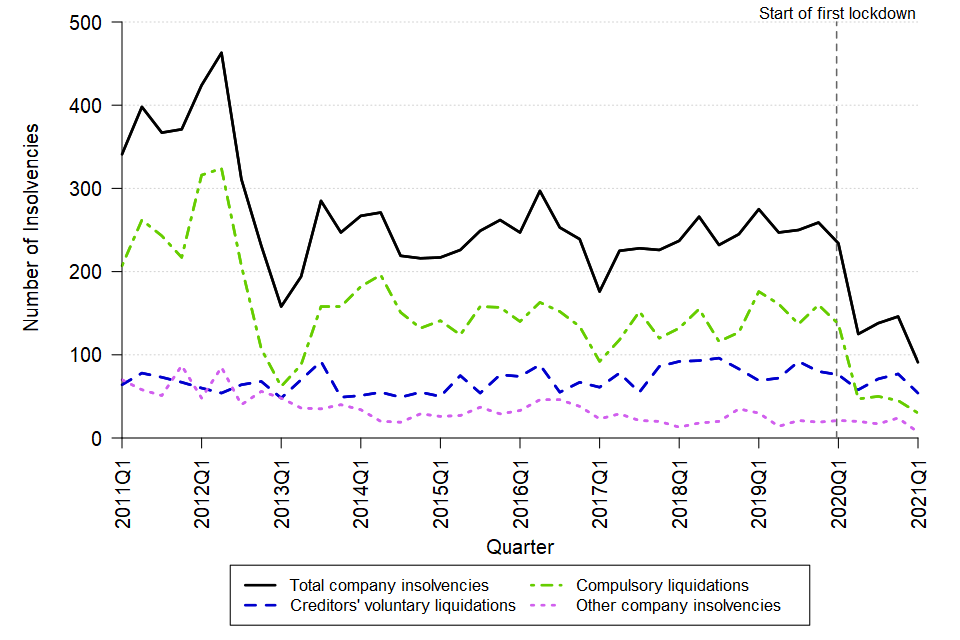
A line chart showing the change over time in the quarterly number of company insolvencies in Scotland between Q1 2011 and Q1 2021. The data can be found in Table 4 of the accompanying tables. [Source: Companies House]
Historically, the numbers of company insolvencies in Scotland have been driven by compulsory liquidations. However, in the last four quarters there have been fewer compulsory liquidations than CVLs.
The total liquidation rate in Scotland for the 12 months ending Q1 2021 was 20.9 per 10,000 active companies, as shown in Figure 5. This is down by 23.9 (from a rate of 44.9 per 10,000 active companies) from the 12 months ending Q1 2020.
Figure 5: Overall liquidation rates in Scotland fell in the 12 months ending Q1 2021 compared to the 12 months ending Q1 2020
Scotland, Q1 2011 to Q1 2021, not seasonally adjusted
A line chart showing the change over time in the liquidation rate in Scotland between Q1 2011 and Q1 2021. The data can be found in Table 5 of the accompanying tables. [Source: Companies House]
5. Company insolvency in Northern Ireland
Company insolvency in Northern Ireland is governed by separate, but broadly similar, legislation to England and Wales, and so figures are presented separately.
There were 15 company insolvencies in Northern Ireland in Q1 2021, a fall of 82% on the same quarter of 2020. This comprised 11 CVLs, 1 administration, 1 CVA and 2 compulsory liquidations. There were no administrative receiverships. These numbers can be seen in Figure 6.
Figure 6: Company insolvencies were lower in Q1 2021 than in the same quarter last year
A line chart showing the change over time in the quarterly number of company insolvencies in Northern Ireland between Q1 2011 and Q1 2021. The data can be found in Table 6 of the accompanying tables. [Sources: Department for the Economy, Northern Ireland (compulsory liquidations only); Companies House (all other insolvency procedures)]
Northern Ireland, Q1 2011 to Q1 2021, not seasonally adjusted
The total liquidation rate in the 12 months ending Q1 2021 in Northern Ireland was 10.7 per 10,000 active companies, as shown in Figure 7. This is a decrease of 43.0 (from a rate of 53.7 per 10,000 active companies) from the 12 months ending Q1 2020.
Figure 7: Liquidation rates in Northern Ireland fell in the 12 months ending Q1 2021 compared to the 12 months ending Q1 2020
Northern Ireland, Q1 2011 to Q1 2021, not seasonally adjusted
A line chart showing the change over time in the liquidation rate in Northern Ireland between Q1 2011 and Q1 2021. The data can be found in Table 5 of the accompanying tables. [Sources: Department for the Economy, Northern Ireland (compulsory liquidations only); Companies House (all other insolvency procedures)]
6. Data and Methodology
6.1 Data Sources
Company insolvency data were sourced from Companies House, except for compulsory liquidation data for England and Wales which were sourced from the Insolvency Service, and compulsory liquidation data for Northern Ireland which were sourced from the Department for the Economy.
Companies House data were used to determine all active companies registered in each quarter in the previous twelve months, to calculate insolvency rates for England and Wales. These data are separately published by Companies House on the Gov.uk website.
More information on the administrative systems used to compile insolvency statistics can be found in the Statement of Administrative Sources.
6.2 Methodology and data quality
Seasonal adjustment
To aid analysis between quarters, underlying data for England and Wales were adjusted where there was evidence of seasonality to minimise the effect of the time of year and provide a true picture of the trends in insolvency. Full details on the models used to adjust the data can be found in the Seasonal Adjustment Review published in April 2020.
The data series for Scotland and Northern Ireland do not demonstrate consistent seasonality and only the unadjusted series have been presented, as agreed with the appropriate officials in the devolved administrations.
The seasonal adjustment models for England and Wales are typically reviewed on an annual basis, in accordance with the Insolvency Service Official Statistics Revisions Policy. However, the trend in company insolvencies during the 2020 reflected a very different pattern to that seen in previous years; largely a result of the coronavirus (COVID-19) pandemic. Therefore the 2021 review was not conducted and data for 2021 will continue to be seasonally adjusted using the 2020 model.
Rates of insolvency
Insolvency rates were calculated for England and Wales, Scotland and Northern Ireland. The total number of companies entering insolvency in each location during the previous twelve months was divided by the mean average number of all active companies registered with Companies House in that location in the same twelve-month period.
Main quality and coverage issues to note
- This statistical release presents the numbers of creditors’ voluntary liquidations (CVLs), administrations, company voluntary arrangements (CVAs) and receivership appointments based on their registration date at Companies House, and therefore reflect company insolvency registrations rather than insolvency procedure start dates.
- Compulsory liquidation numbers are marked provisional as any cases that are later annulled or rescinded will be removed from future releases to avoid duplication should the company enter insolvency again in the future.
- These statistics may not equal the sum of monthly statistics, published separately, which cover the period January 2019 to March 2021, due to differing methodologies including seasonal adjustment. In addition, the administrative systems used to capture data are live systems and are subject to amendments.
- These statistics may not align with information published separately by Companies House, or with data extracted from the Gazette. Further information on why numbers may not align can be found in the accompanying Methodology and Quality document.
Further details on the methodology and quality information for these statistics can be found in the accompanying Quarterly Statistics Methodology and Quality document.
6.3 Revisions
These statistics are subject to scheduled revisions, as set out in the published Revisions Policy. Other revisions tend to be made as a result of data being entered onto administrative systems after the cut-off date for data being extracted to produce the statistics. Any revisions to these statistics will be marked with an ‘r’ in the relevant table.
Non-routine revisions since previous release
There were several methodology changes to the validation and processing of liquidation data, resulting in revisions to the overall numbers of compulsory liquidations presented in the accompanying tables. Any revised figures have been marked with an ‘r’. The impact of these revisions is considered minimal since the overall total number of compulsory liquidations reduced by just 1.5% and the trends over time remained the same.
Since the release of the Q4 2020 statistics errors were identified in the process of assigning SIC 2007 classifications to the company insolvency data. The process has now been amended to obtain more accurate industry classification. This has resulted in a large number of small changes in the accompanying industry tables. The relevant tables have been marked with an r. The impact of these revisions is considered minimal. Whilst some of the numbers changed, the percentage of all insolvencies within each industry remained unchanged in most cases. Any percentage changes identified were by no more than 1% at top-level SIC.
Further details on routine and non-routine revisions can be found in the accompanying Quarterly Statistics Methodology and Quality document.
7. Glossary
7.1 Key Terms used within this statistical bulletin
| Administration | The objective of administration is the rescue of the company as a going concern, or if this is not possible then to obtain a better result for creditors than would be likely if the company were to be wound up. A licensed insolvency practitioner, ‘the administrator’, is appointed to manage a company’s affairs, business and property for the benefit of the creditors. |
|---|---|
| Bulk Creditors’ voluntary liquidation | IR35 rules are intended to prevent the avoidance of tax and National Insurance contributions using personal service companies and partnerships. Between April 2016 and early 201, following changes to the IR35 rules and/or changes in VAT flat rate, some directors of personal service companies had cited these changes as the primary reason that their company’s activities had become unviable, therefore leading to creditors’ voluntary liquidation (CVL) of large numbers of these companies. These additional CVLs are referred to as “bulk insolvencies”. |
| Company voluntary arrangement (CVA) | CVAs are another mechanism for business rescue. They are a voluntary means of repaying creditors some or all of what they are owed. Once approved by 75% or more of creditors, the arrangement is binding on all creditors. CVAs are supervised by licensed insolvency practitioners. |
| Compulsory liquidation | A winding-up order obtained from the court by a creditor, shareholder or director. See Liquidation for details on the process. |
| Creditors’ voluntary liquidation (CVL) | Shareholders of a company can themselves pass a resolution that the company be wound up voluntarily. See Liquidation for details on the process. Administrations which result in a Creditors’ Voluntary Liquidation are recorded separately by Companies House and are excluded from CVL figures as they do not represent a new company entering into an insolvency procedure for the first time. These cases are only ever recorded as Administrations. |
| Liquidation | Liquidation is a legal process in which a liquidator is appointed to ‘wind up’ the affairs of a limited company. The purpose of liquidation is to sell the company’s assets and distribute the proceeds to its creditors. At the end of the process, the company is dissolved – it ceases to exist. Statistics on compulsory liquidations and creditors’ voluntary liquidations are presented in these statistics. A third type of winding up, members’ voluntary liquidation is not included because it does not involve insolvency. |
| Moratorium | Moratoriums were introduced under the Corporate Insolvency and Governance Act 2020 to give struggling businesses formal breathing space in which to explore rescue and restructuring options, free from creditor or other legal action. Except in certain circumstances, no insolvency proceedings can be instigated against the company during the moratorium period. It also prevents legal action being taken against a company without permission from the court. |
| Partnership Winding-up Orders | This is similar to the liquidation of a company. When the partners have decided that the partnership has no viable future or purpose then a decision may be made to cease trading and wind up the partnership. There are two basic ways that the partnership can be wound up: the creditors petition and a partner’s petition. |
| Receivership Appointments | Administrative receivership is where a creditor with a floating charge (often a bank) appoints a licensed insolvency practitioner to recover the money it is owed. Before 2000 receivership appointments also included other, non-insolvency, procedures, for example under the Law of Property Act 1925. The use of this procedure is restricted to certain types of company, or to floating charges, created before September 2003. |
| Restructuring Plan | New restructuring measures were introduced under the Corporate Insolvency and Governance Act 2020 to support viable companies struggling with unmanageable debt obligations to restructure under a new procedure. They allow the court to sanction a plan that binds creditors to a restructuring plan if it is fair and equitable. Creditors vote on the plan, but the court can impose it on dissenting classes of creditors (‘cram down’) provided that the necessary conditions are met. |
| Standard Industrial Classification (SIC 2007) | Used in classifying business establishments and other statistical units by the type of economic activity in which they are engaged. Further information can be found on the ONS website |