Civic Engagement and Social Action - Community Life Survey 2020/21
Published 29 July 2021
Applies to England

© Crown copyright 2021
This publication is licensed under the terms of the Open Government Licence v3.0 except where otherwise stated. To view this licence, visit nationalarchives.gov.uk/doc/open-government-licence/version/3 or write to the Information Policy Team, The National Archives, Kew, London TW9 4DU, or email: psi@nationalarchives.gov.uk.
Where we have identified any third party copyright information you will need to obtain permission from the copyright holders concerned.
This publication is available at https://www.gov.uk/government/statistics/community-life-survey-202021-civic-engagement-and-social-action/civic-engagement-and-social-action-community-life-survey-202021
The Community Life Survey is a household self-completion survey (online survey, with paper survey for adults not digitally engaged) of adults aged 16+ in England. This chapter summarises results related to civic engagement and social action from the 2020/21 survey, which ran from April 2020 to March 2021.
Differences between groups are only reported on in this publication where they are statistically significant i.e. where we can be confident that the differences seen in our sampled respondents reflect the population[footnote 1].
Civic Engagement
In the Community Life Survey, civic engagement is measured in the following ways:
Civic participation: engagement in democratic processes, both in person and online, including contacting a local official (such as a local councillor or MP), signing a petition, or attending a public rally (excludes voting).
Civic consultation: taking part in a consultation about local services or problems in the local area through completing a questionnaire, attending a public meeting or being involved in a face-to-face or online group.
Civic activism: involvement in activities in the local community such as being a local councillor, school governor, volunteer special constable or magistrate (for those aged 18 or over). Civic action also includes involvement (in person or online) in decision making groups in the local area, for example, a group making decisions about local health or education services, a tenants’ decision making group or a group set up to tackle local crime problems or to regenerate the local area.
1. Civic participation
Civic participation is defined in the survey as engagement in democratic processes, both in person and online, including contacting a local official (such as a local councillor or MP), signing a petition, or attending a public rally (excludes voting).
In 2020/21, 41% of respondents said they had engaged in some form of civic participation at least once in the last 12 months. This is in line with reported participation in 2019/20.
Demographic breakdown
-
Those aged 75+ were less likely to have engaged in civic participation (26%) than all other age groups (37-48%). Respondents in the age group 16-24 years old were more likely to engage in civic participation (48%) than those in 50-64, 65 to 74 and 75 and over age group (26-41%). Respondents in the 16 to 24 age group were more likely to engage in civic participation in 2020/21 than in 2019/20 (37%).
-
Some regional variability was seen whereby respondents in London were more likely to engage in civic participation (47%) than the North East, the North West, Yorkshire and the Humber, the East Midlands, the West Midlands and the East of England (37-40%).
-
Those living in the least deprived areas showed higher engagement (46%) than those in the most deprived areas (37%).
-
Women were more likely to engage in civic participation than men (44% vs 39% respectively). The number of respondents who reported their gender as ‘other’ was too small and so no analysis has been conducted here to avoid being disclosive.
-
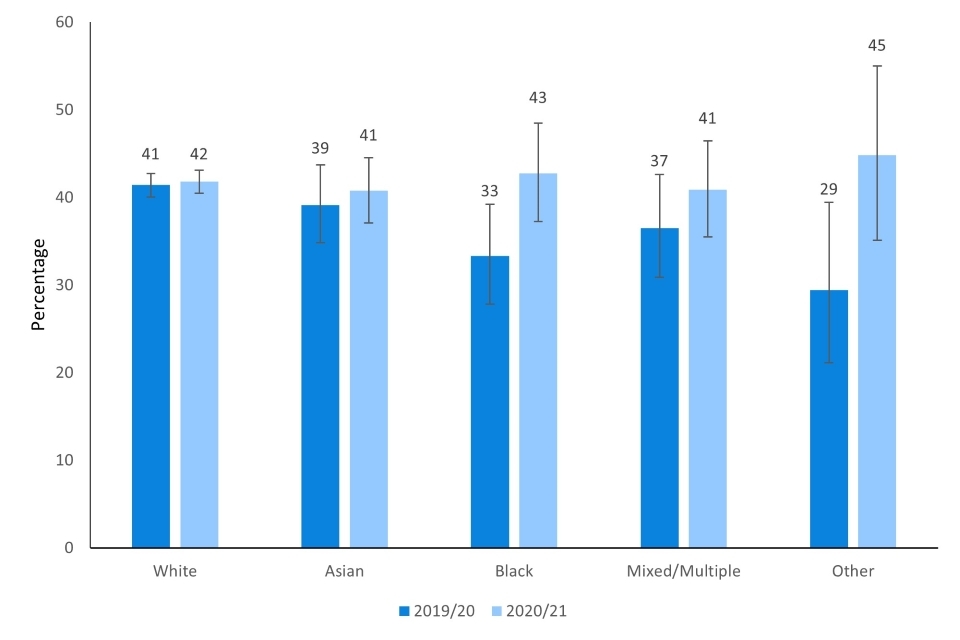
No significant variability was seen between those with or without a disability or long term limiting illness, between respondents from a rural or urban area, and respondents from different ethnic backgrounds.
Figure 4.1 - Percentage of respondents taking part in civic participation at least once in the 12 months prior to completing the survey by ethnic group, 2019/20 – 2020/21
2. Civic consultation
Civic consultation is defined in the survey as taking part in a consultation about local services or problems in the local area through completing a questionnaire, attending a public meeting or being involved in a face-to-face or online group.
In 2020/21, 19% of respondents took part in civic consultation at least once in the last 12 months, a similar level to 2019/20 (21%).
-
Those in the 35-49 and 50-64 age groups were more likely to have engaged in civic consultation in the past 12 months than respondents from 16-24, 25-34 and 75 and over (21-22% vs 15-16%). The proportion of those ages 65-74 who were engaged in civic consultation decreased from 2019/20 to 2020/21 (from 25% to 20% respectively).
-
There was a decrease in civic consultation in respondents from rural areas from 2019/20 to 2020/21 (from 28% to 21%).
-
Those from the least deprived areas showed higher levels of civic consultation (22%) than those from the most deprived areas (17%).
-
Respondents from a Black ethnic group were more likely to engage in civic consultation than respondents from a White ethnic group and respondents from an Asian ethnic group (25% vs 18-19% respectively) .
-
Respondents from London and the South West were more likely to engage in civic consultation than both the East Midlands and the West Midlands (23% vs 16-19%)
-
No variability was seen between the different gender or disability categories.
3. Civic activism
Civic activism is defined in the survey as involvement in activities in the local community such as being a local councillor, school governor, volunteer special constable or magistrate (for those aged 18 or over). Civic action also includes involvement (in person or online) in decision making groups in the local area, for example, a group making decisions about local health or education services, a tenants’ decision making group or a group set up to tackle local crime problems or to regenerate the local area.
In 2020/21, 7% of respondents had engaged in civic activism at least once in the last 12 months, similar to 2019/20.
-
Those aged 65-74 showed higher engagement with civic activism (9%) than 16-24 year olds (6%) and and 25-34 year olds (4%).
-
Respondents from a Black ethnic group reported the highest engagement in civic activism in 2020/21 (13%), compared to 7% for respondents from a White ethnic group.
-
Respondents from the least deprived areas engaged in more civic activism than the most deprived respondents (9% vs 6% respectively).
-
No variability was seen between different demographic splits of gender, disability or region.
Figure 4.2 - Percentage of respondents taking part in civic participation, consultation or activism at least once in the 12 months prior to completing the survey, 2013/14 – 2020/21

4. Influencing local decisions
Feeling able to influence decisions
In 2020/21, 27% of respondents either definitely or tended to agree that they personally can influence decisions affecting their local area. This is similar to 2019/20. This figure has not varied much over the last 7 years since data collection began.
-
Those aged 35-49 (29%) agreed more that they could influence decisions than those aged 25-34 (24%).
-
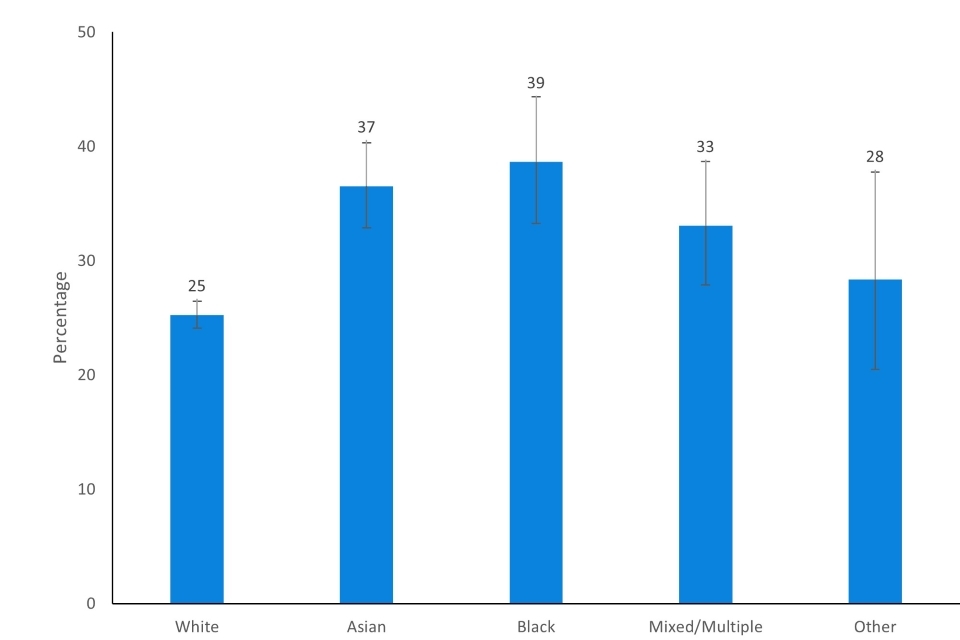
Respondents from a White ethnic group (25%) felt less able to influence decisions than respondents with an Asian ethnic group, Black ethnic group or Mixed/Multiple ethnic group (33% to 39%).
Figure 4.3 - Percentage who feel agree they personally can influence decisions affecting their local area by ethnic group, 2020/21
-
Those with a limiting long term illness or disability (23%) were less likely to say they felt able to influence decisions than those without (28%).
-
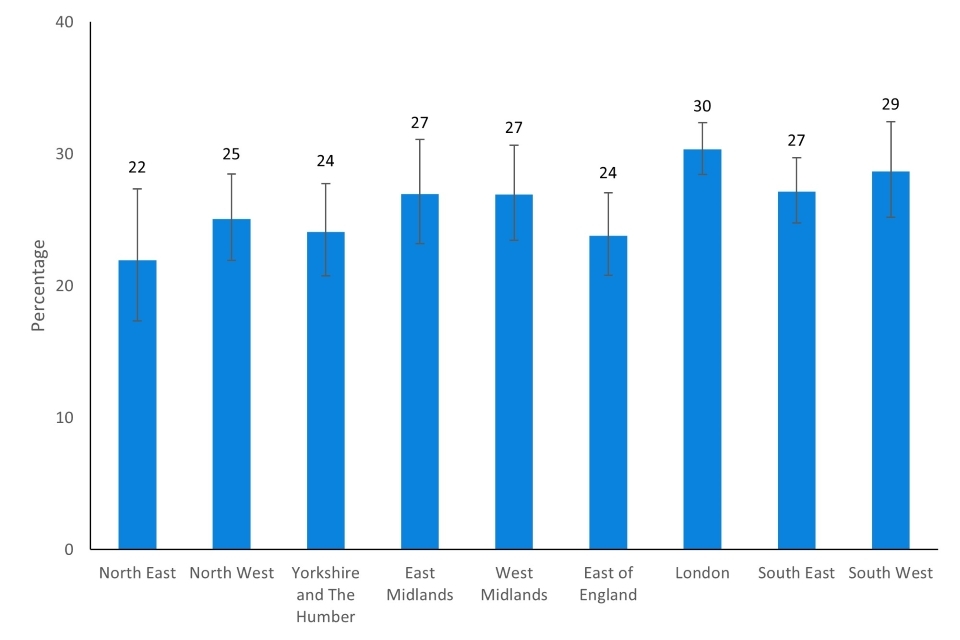
Some regional variability was seen, with those in London (30%) feeling more able to influence decisions than those in the East of England and the North East (24% and 22% respectively).
Figure 4.4 - Percentage who feel agree they personally can influence decisions affecting their local area by region, 2020/21
- No variability was seen between gender, urban/rural status or deprivation categories.
Importance and desire to influence local decisions
Respondents were asked how important it was for them personally to be able to influence local decisions. In 2020/21, 54% said it was important. This was lower than 2019/20 where 57% responded in this manner.
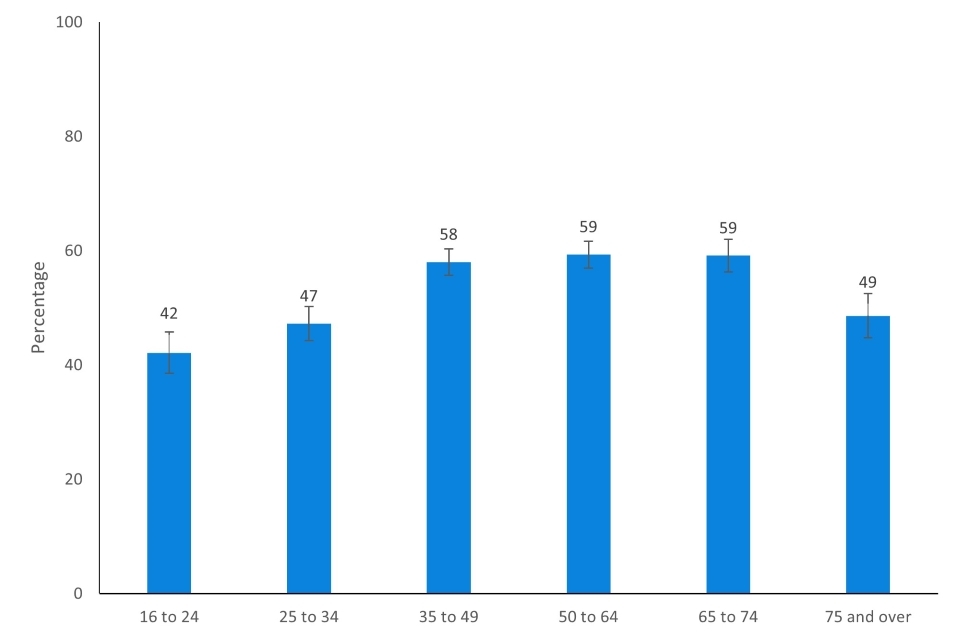
- Respondents from the age groups 35-49, 50-64, and 65-74 years old responded that it was important (58-59%) the ability to influence decisions in the local area. This was higher than those in the age groups 16-24, 25-34, and 75+ years old (42-49%).
Figure 4.5 - Percentage agreeing by it is important to be able to influence decisions in their local area by age, 2020/21
-
Respondents from a Black ethnic group were more likely to respond that it was important to influence decisions in their local area (65%) than respondents from a White ethnic group or Mixed/Multiple ethnic group (53% and 54% respectively).
-
Some regional variability was seen with London showing higher incidence (59%) of responding that it was important to influence decisions in their local area than the North East, the North West, the East Midlands, and the West Midlands (49-52%).
-
Those living in rural areas were more likely to say it was important (58%) than those living in urban areas (53%).
-
The least deprived respondents (57%) were more likely to say it was important than those from the most deprived areas (48%).
-
No variability was seen between the gender or disability categories.
Wanting to be more involved in local decisions
Respondents were asked if generally speaking, they would like to be more involved in the decisions their local council makes which affect their local area[footnote 2]. In 2020/21, 50% said yes and 48% said no. A further 2% said it depends on the issue. These proportions were all similar to those in 2019/20.
5. Enabling decision making
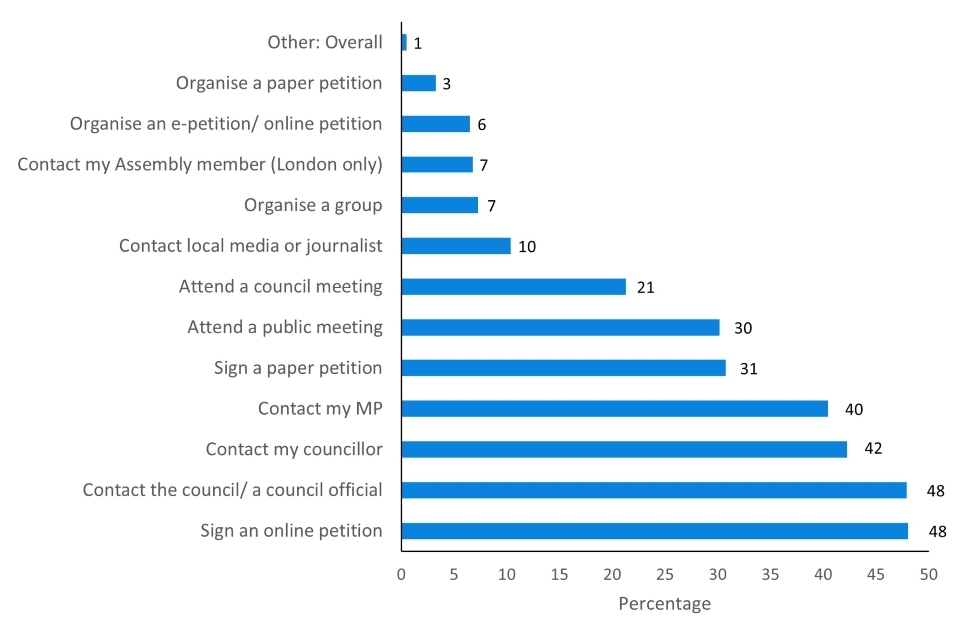
Respondents were asked: ‘If you wanted to influence decisions in your local area how would you go about it?’ and were presented with a list of options, of which they could select all that applied. The three most common responses were ‘sign an online petition’, ‘contact the council/ a council official’, and ‘contact my councillor’, the same as in 2019/20.
Figure 4.6 - If you wanted to influence decisions in your local area how would you go about it? - 2020/21
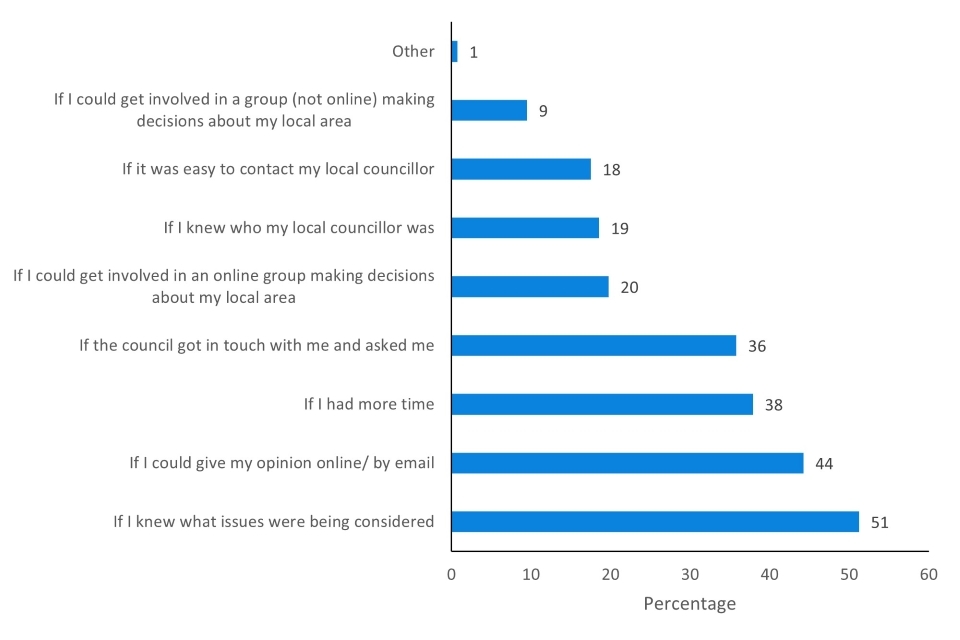
Respondents were then asked, what would make it easier to influence decisions in their local area and asked to select all options that applied. The most common response was ‘If I knew what issues were being considered’, followed by ‘If I could give my opinion online/ by email’ and ‘If I had more time’. These were similar proportions to 2019/20.
Figure 4.7 - What would make it easier to influence decisions in the local area? - 2020/21
6. Social action
In the Community Life Survey, social action refers to involvement with issues affecting the local area by doing things like:
-
Setting up a new service/amenity.
-
Stopping the closure of a service/amenity.
-
Stopping something happening in the local area.
-
Running a local service on a voluntary basis.
-
Helping to organise a street party or community event.
This definition of social action has been preserved here for legacy reasons, but the UK government currently defines Social Action as also including all volunteering, civic engagement, and charitable giving.
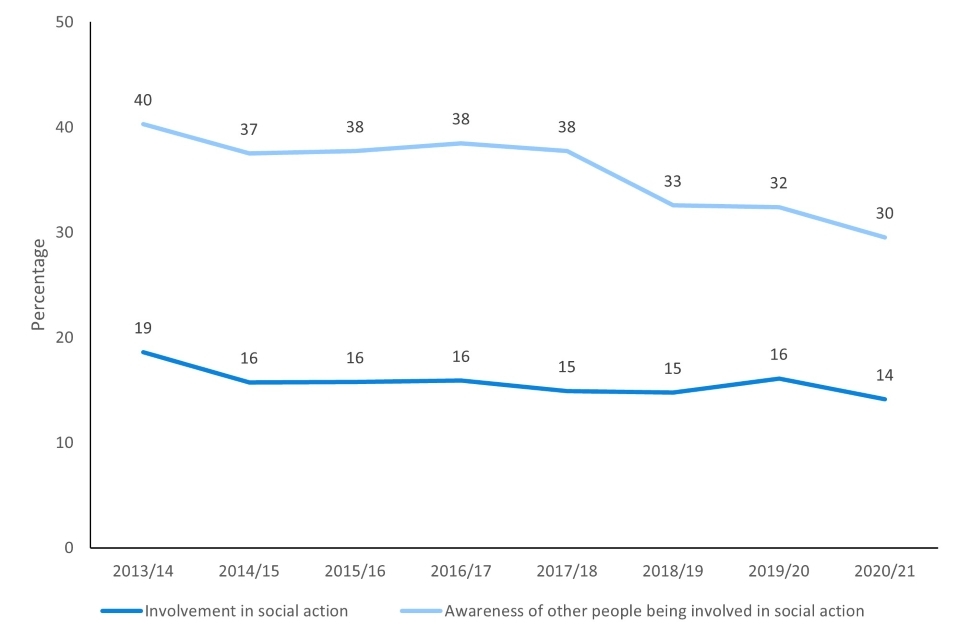
In 2020/21, 14% of respondents had been involved in social action at least once in the last 12 months, lower than in 2019/20 (16%) and lower than in 2013/14, when data collection began (19%). Awareness of other people being involved in social action was reported by 30% of respondents, lower than 2019/20 (32%), and lower than in 2013/14 (40%).
Figure 4.8 - Percentage of respondents who had been involved in social action and who were aware of others being involved, 2013/14 – 2020/21
For being personally involved with social action:
-
The 65-74 and 50-64 year old age groups showed a higher incidence of social action (both 16%) than those ages 25-34 (11%). Those in the 65-74 age group showed a lower involvement in social action than in 2019/20 (24%). No variability from 2019/20 to 2020/21 was seen in other age groups.
-
Those living in rural areas were more likely to have participated in social action (19%) than those living in urban areas (13%).
-
A higher proportion of the least deprived respondents (18%) had participated in social action than those from the most deprived respondents (12%).
-
No variability was seen between gender, ethnic group, disability, or region categories.
-
The 95% confidence intervals are indicated by error bars on the charts. They show the range that we are 95% confident the true value for the population falls between. When there is no overlap between the error bars for two or more groups, we can be more confident that the differences between groups represent true differences between these groups in the population. ↩
-
In 2016/17, the option ‘depends on the issue’ changed from being available up front to only being available if the respondent tried to move on without answering. While this is likely to have reduced the number of respondents selecting that response, it is less clear how this would have impacted the other two response options. ↩