Volunteering and Charitable Giving - Community Life Survey 2019/20
Published 14 July 2020

© Crown copyright 2020
This publication is licensed under the terms of the Open Government Licence v3.0 except where otherwise stated. To view this licence, visit nationalarchives.gov.uk/doc/open-government-licence/version/3 or write to the Information Policy Team, The National Archives, Kew, London TW9 4DU, or email: psi@nationalarchives.gov.uk.
Where we have identified any third party copyright information you will need to obtain permission from the copyright holders concerned.
This publication is available at https://www.gov.uk/government/statistics/community-life-survey-201920-volunteering-and-charitable-giving/volunteering-and-charitable-giving-community-life-survey-201920
The Community Life Survey is a household self-completion survey (online or paper) of adults aged 16+ in England. This chapter summarises results related to volunteering and charitable giving from the 2019/20 survey, which ran from April 2019 to March 2020.
Differences between groups are only reported on in this publication where they are statistically significant i.e. where we can be confident that the differences seen in our sampled respondents reflect the population [footnote 1].
1. Volunteering Participation Levels
1.1 Formal volunteering
In the Community Life Survey, formal volunteering refers to those who have given unpaid help to groups or clubs, for example, leading a group, administrative support or befriending or mentoring people.
In 2019/20, 23% of respondents took part in formal volunteering at least once a month, similar to recent years but lower than in 2013/14 (27%). In 2019/20, 37% of respondents reported taking part in formal volunteering at least once in the last year. This is similar to 2018/19 and lower than in 2013/14 (45%).
Figure 5.1 Participation in formal volunteering, 2013/14 – 2019/20
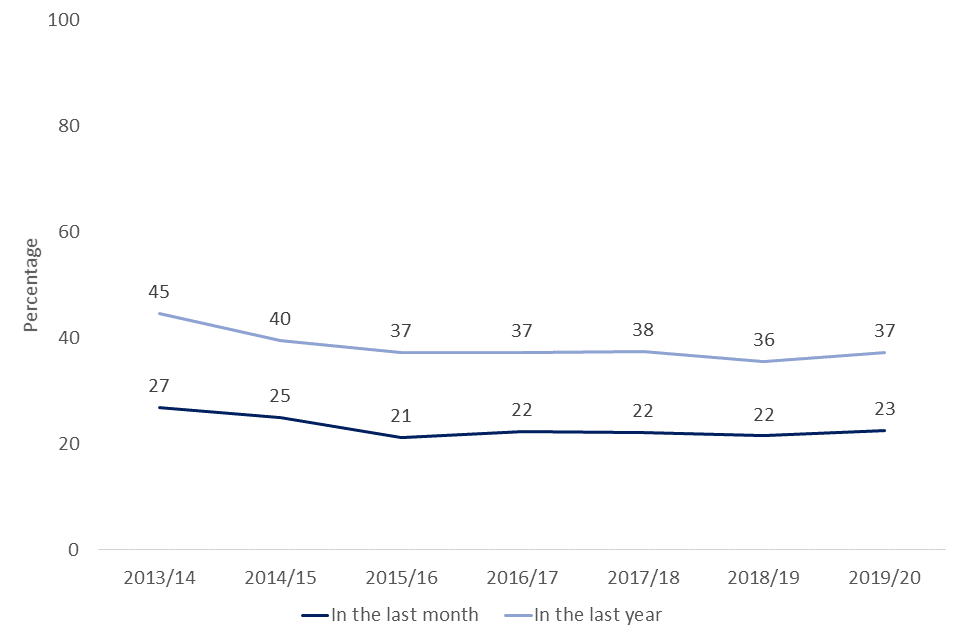
Line chart showing participation in formal volunteering at least once in the last month and in the last year, from 2013/14 to 2019/20
For formal volunteering in either the last month or the last year:
- The age group 25-34 (16% at least once in the last month, 29% at least once in the last year) showed the lowest participation in volunteering compared to most other age groups.
- White (23%) and Black (24%) respondents showed higher participation in volunteering in the last month than Asian respondents (15%), though no variability was seen with ethnicity for volunteering in the last year.
- Volunteering in the last month was significantly higher for those economically inactive (29%) compared to those either employed or unemployed, though no significant variability was seen for volunteering at least once in the last year.
- Those living in rural areas showed higher participation in volunteering than those in urban areas (29% vs 21% in the last month, 46% vs 35% in the last year).
- Those from the least deprived areas showed higher participation than those from the most deprived areas (31% vs 15% in the last month, 48% vs 26% in the last year).
- No significant variability was seen between gender, disability or region categories.
1.2 Informal volunteering:
In the Community Life Survey, informal volunteering is defined as giving unpaid help to individuals who are not a relative. For example, babysitting or caring for children, keeping in touch with someone who has difficulty getting out and about, or helping out with household tasks such as cleaning, laundry or shopping.
In 2019/20, 28% of respondents had taken part in informal volunteering at least once a month, similar to 2018/19 but lower than in 2013/14 when 31% took part. In 2019/20, 53% of respondents had taken part at least once in the last year, again similar to 2018/19 but lower than in 2013/14 when 58% took part.
Figure 5.2 Participation in informal volunteering, 2013/14 – 2019/20
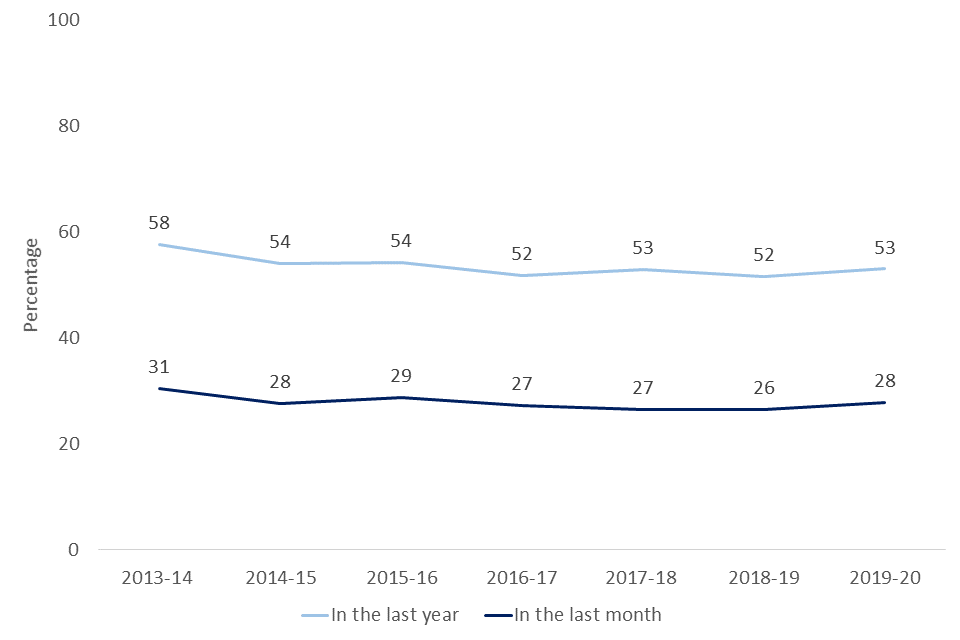
Line chart showing participation in informal volunteering at least once in the last month and in the last year, from 2013/14 to 2019/20
- Informal volunteering was more popular for women than men (31% vs 25% in the last month, 57% vs 50% in the last year).
- The age group 65-74 years old showed the highest participation in informal volunteering (36% at least once a month, 61% at least once in the last year) compared to most other age groups. Over 75s also participated more in the last month (33%) than age groups below 65 years old (24-30%).
- Black respondents participated in informal volunteering at least once a month (37%) more than White and Asian respondents (27-28%). Furthermore, Black respondents participated in informal volunteering in the last year (60%) more than White and Mixed respondents (48-53%).
- Those with a long term limiting illness or disability participated more in informal volunteering in the last month than those without (33% vs 28%). No significant difference was seen for informal volunteering in the last year.
- Volunteering at least once a month was significantly higher for those economically inactive (35%) compared to those either employed or unemployed (25-26%), though no significant variability was seen for volunteering at least once in the last year.
- No significant variability was seen between regions.
- Those living in rural areas showed higher participation in volunteering in the last year than those in urban areas (57% vs 52%).
- Those from the least deprived areas showed higher participation than those from the most deprived areas in the last year (56% vs 49%), though no significant variability was seen for in the last month.
1.3 Formal/Informal Volunteering
In 2019/20, 39% of respondents had taken part in either formal or informal volunteering at least once a month. This is similar to 2018/19 but lower than in 2013/14 (44%). In the same period, 64% had taken part in either formal or informal volunteering at least once in the last 12 months. This is similar to 2018/19 (62%) but lower than in 2013/14 (70%).
Figure 5.3 Participation in any formal or informal volunteering, 2013/14 – 2019/20

Line chart showing participation in informal or formal volunteering at least once in the last month and in the last year, from 2013/14 to 2019/20
2. Motivators and barriers to volunteering
Respondents who reported volunteering were asked about their reasons for participating in formal volunteering. Those who didn’t volunteer regularly were asked about their barriers to doing so. They were invited to select all responses that applied.
Most common reasons for formal volunteering
- ‘I wanted to improve things/help people’ – 47%
- ‘The cause was really important to me’ – 32%
Most common barriers for formal volunteering
- ‘I have work commitments’ – 53%
- ‘I do other things in my spare time’ – 37%
Figure 5.4 shows the percentage for all reasons listed:
Figure 5.4 Reasons for taking part in formal volunteering, 2019/20

Bar chart showing the popularity of responses around motivations for formal volunteering, 2019/20
Respondents who did not indicate they had taken part in formal volunteering, or who did formal volunteering less frequently than once a month were asked about their reasons for not volunteering/ not volunteering more frequently. Work commitments, doing other things in their spare time and looking after children were commonly cited as barriers to volunteering.
Having work commitments became more common as a response, increasing from 49% in 2018/19 to 53% in 2019/20. Additionally, having to look after children was chosen by 26% of respondents in 2019/20, a significant increase from 23% in 2018/19.
Figure 5.5 Reasons given for not taking part in formal volunteering or not volunteering more frequently, 2019/20
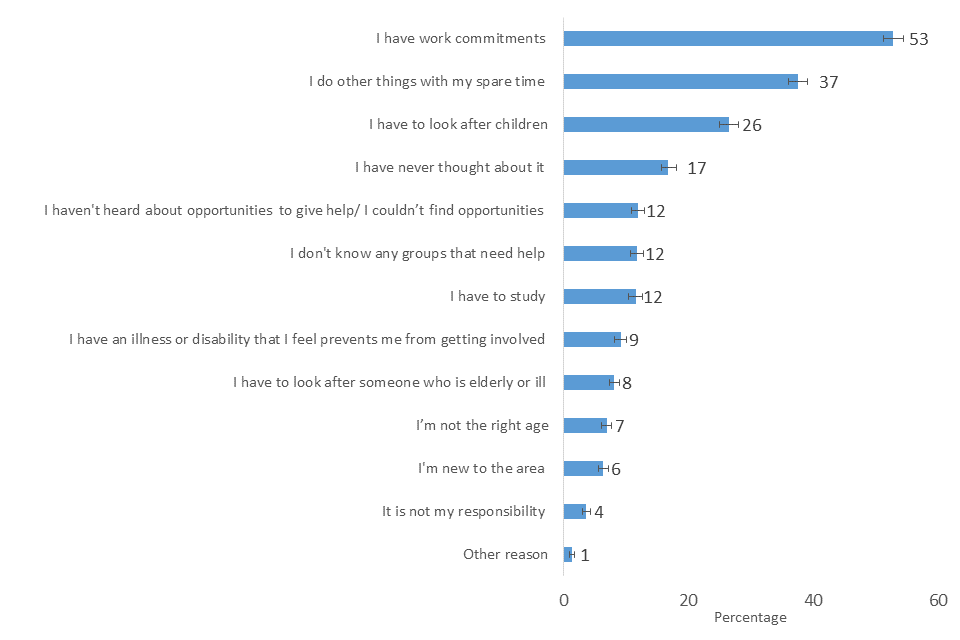
Bar chart showing the popularity of responses around barriers for formal volunteering, 2019/20
3. Charitable giving
In 2019/20, 75% of respondents said they had given money to charitable causes in the last 4 weeks, the same as in recent years, but lower than 2013/14 when 82% had given to charitable causes. The rate in 2013/14 is higher than all other subsequent survey years. Without comparable data for years prior to this, it is not possible to conclude whether 2013/14 had unusually high levels of charitable giving, or whether this was part of a longer downward trend.
Figure 5.6 Percentage who gave to charitable causes in the 4 weeks prior to completing the survey, 2013/14 – 2019/20
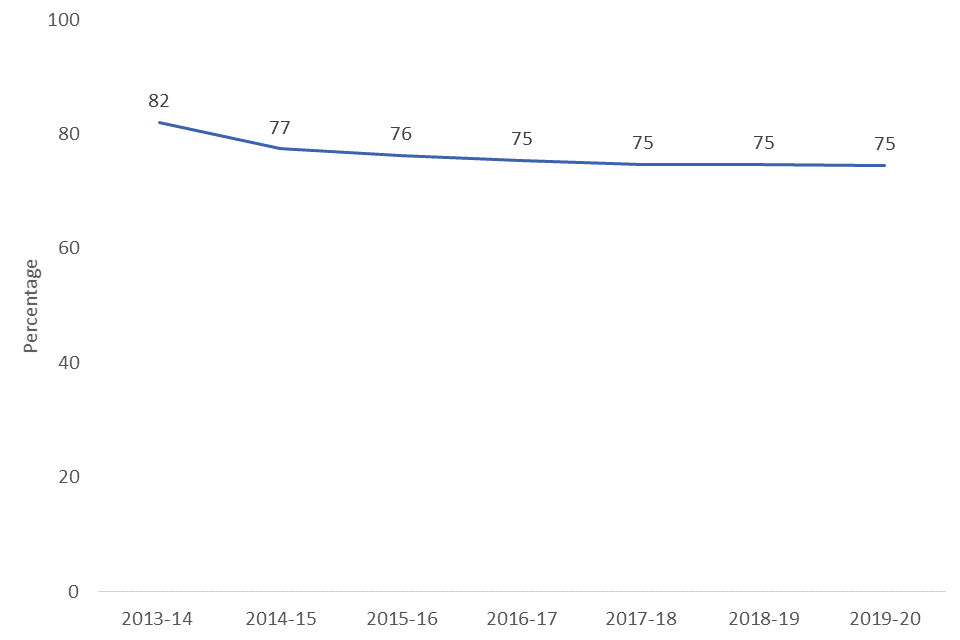
Line chart showing whether respondents gave to charitable causes in the last 4 weeks, from 2013/14 to 2019/20
- Women were more likely than men to have given to charity in the last 4 weeks (79% vs 70%).
- The lowest proportion of charitable giving was from the 16-24 age group (55%) and the highest proportions from the 65-74 and 75+ age groups (84% and 85% respectively).
- White respondents were more likely to have given to charity in the last 4 weeks than those of ‘Other’ ethnicities (i.e. not White, Asian, Black or Mixed ethnicities).
- The proportion of respondents giving to charity in the last 4 weeks was higher for those living in rural areas (81%) than urban areas (73%).
- Those from the least deprived areas were more likely to have given to charity in the last 4 weeks (79%) than those from the most deprived areas (68%).
- No significant variability was seen between disability or region categories.
Figure 5.7 Percentage who gave to charitable causes in the 4 weeks prior to completing the survey by age, 2019/20

Bar chart showing whether respondents gave to charitable causes in the last 4 weeks by age group, 2019/20
The average amount given was £24 (excluding those who donated £300 or more). In 2019/20, 15% of respondents gave over £50, similar to 2018/19. In addition, 13% of respondents donated £4 or less.
3.1 Methods of giving to charitable causes
Giving through collection tins (28%) and through charity shops or catalogues (28%) were the most common methods for donating, the percentage giving to each causes is shown below:
Figure 5.8 Methods of giving to charitable causes in the last four weeks, 2019/20

Bar chart showing the popularity of methods for giving to charity in the last four weeks, 2019/20
No methods for donating have significantly changed in popularity since 2018/19.
3.2 Charitable causes donated to
Of those who gave to charitable causes, 27% gave to medical research, 25% gave to hospitals and hospices and 19% gave to animal welfare.
Giving to ‘conservation, the environment and heritage’ increased from 7% in 2018/19 to 9% in 2019/20.
Figure 5.9 Types of causes given to in the last four weeks, 2019/20
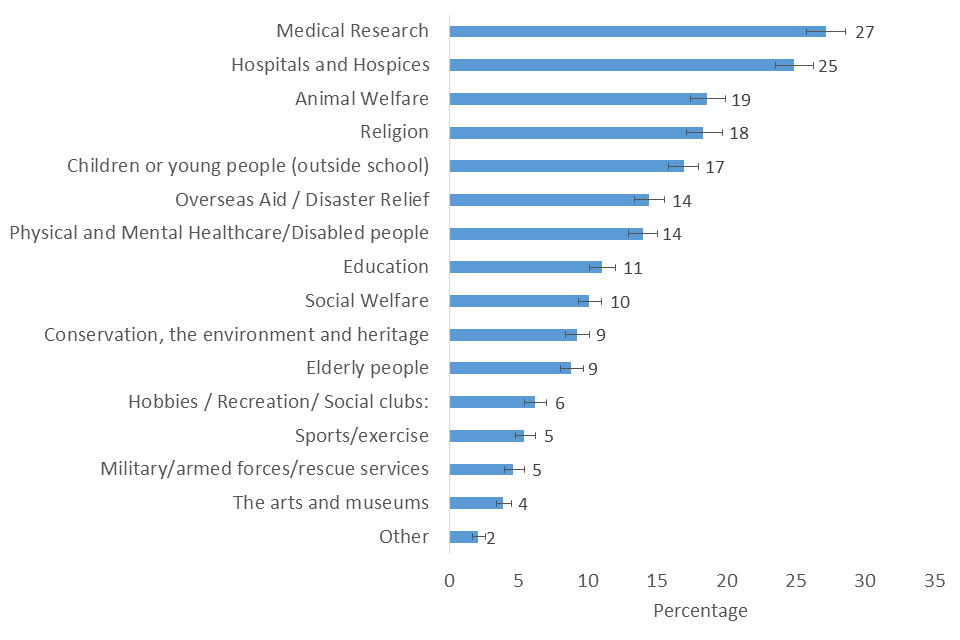
Bar chart showing the popularity of types of cause given to in the last four weeks, 2019/20
3.3 Factors which would encourage respondents to give more
When respondents were asked what would either encourage them to start giving to charitable causes, or to increase the amount they currently donate, 38% said having more money, 29% said having confidence that the charity or organisation uses the money effectively and 18% said knowing that their money was going to be spent locally. 31% said none of the options listed would encourage them to start giving or to give more.
Figure 5.10 What would make respondents more likely to give to charitable causes or to increase the amount they gave, 2019/20

Bar chart showing the popularity of factors that would encourage people to give more to charitable causes, 2019/20
-
The 95% confidence intervals are indicated by error bars on the charts. They show the range that we are 95% confident the true value for the population falls between. When there is no overlap between the error bars for two or more groups, we can be more confident that the differences between groups represent true differences between these groups in the population. ↩