7. Wellbeing and loneliness - Community Life COVID-19 Re-contact Survey 2020
Published 8 December 2020
Applies to England

© Crown copyright 2020
This publication is licensed under the terms of the Open Government Licence v3.0 except where otherwise stated. To view this licence, visit nationalarchives.gov.uk/doc/open-government-licence/version/3 or write to the Information Policy Team, The National Archives, Kew, London TW9 4DU, or email: psi@nationalarchives.gov.uk.
Where we have identified any third party copyright information you will need to obtain permission from the copyright holders concerned.
This publication is available at https://www.gov.uk/government/statistics/community-life-covid-19-re-contact-survey-2020-main-report/7-wellbeing-and-loneliness-community-life-covid-19-re-contact-survey-2020
The 2018-19 and 2019-20 Community Life Survey (referred to as wave 1) and the Community Life Re-contact Survey (referred to as wave 2) uses the Government Statistical Service (GSS) harmonised principle for the four personal measures of wellbeing[footnote 1] and measures of loneliness.[footnote 2]
This chapter explores personal wellbeing and loneliness during the pandemic, and how the pattern of these measures has changed since before the pandemic.
7.1 Interpretation and limitations
This chapter examines both net and gross change in personal wellbeing and loneliness at wave 1 and wave 2. Net change refers to the overall differences in personal wellbeing at wave 1 and wave 2, while gross change refers to change at the level of the individual (see Glossary for further details).
Measuring wellbeing
Personal wellbeing is a subjective assessment of how people feel about their own lives. The GSS measures of personal wellbeing ask people to evaluate, on a scale of 0-10, satisfaction with life, the extent to which the things they do are worthwhile (self-worth) and daily emotions such as happiness and anxiety.
In this chapter, net change analysis of personal wellbeing is presented by comparing both average means and GSS harmonised thresholds (see Table 7.1).[footnote 3]
Table 7.1: Government Statistical Service (GSS) harmonised personal wellbeing thresholds
| Life satisfaction, worthwhile and happiness scores | |
|---|---|
| Response on an 11-point scale | Label |
| 0 to 4 | Low |
| 5 to 6 | Medium |
| 7 to 8 | High |
| 9 to 10 | Very high |
| Anxiety scores | |
|---|---|
| Response on an 11-point scale | Label |
| 0 to 1 | Very low |
| 2 to 3 | Low |
| 4 to 5 | Medium |
| 6 to 10 | High |
Source: Office for National Statistics
Measuring loneliness
The Government Statistical Service (GSS) harmonised principle of loneliness used in this report are outlined in Table 7.2 below.
Table 7.2: Government Statistical Service (GSS) harmonised principle of loneliness[footnote 4]
| Question | Response options |
|---|---|
| How often do you feel that you lack companionship? | Hardly ever or never, Some of the time, Often |
| How often do you feel left out? | Hardly ever or never, Some of the time, Often |
| How often do you feel isolated from others? | Hardly ever or never, Some of the time, Often |
| How often do you feel lonely? | Often or Always, Some of the time, Occasionally, Hardly ever, Never |
7.2 How have levels of personal wellbeing changed during the COVID-19 pandemic?
7.2.1 Net change in personal wellbeing
This section covers net changes in wellbeing between wave 1 (before the pandemic) and wave 2 (during the pandemic).
Overall, average wellbeing scores have deteriorated across all four measures of personal wellbeing between wave 1 and wave 2.
-
Life satisfaction decreased from an average score of 7.00 (out of 10) in wave 1 to 6.78 in wave 2.
-
Average ratings for happiness decreased from 7.00 in wave 1 to 6.83 in wave 2.
-
Average ratings of self-worth decreased from 7.20 in wave 1 to 7.03 in wave 2.
-
Average levels of anxiety have increased from 3.64 in wave 1 to 3.78 in wave 2.
Although covering a different time period, data published by ONS[footnote 5] also showed that wellbeing ratings were lower throughout March-June 2020, than at the end of 2019 before the pandemic. ONS findings also suggest that levels of happiness and anxiety improved between March 2020 (at the beginning of the pandemic) and June 2020, but life satisfaction and self-worth remained unchanged over this period.
The decline in some wellbeing scores is driven by the reduction in respondents reporting ‘very high’ scores (9-10).[footnote 6] See Figure 7.3.
Compared with other personal wellbeing measures, there were more pronounced changes in anxiety levels, with differences observed at both ends of the scale. The proportion of respondents reporting “high” levels of anxiety (6-10) increased from 28% in wave 1 to 30% in wave 2 and the proportion of respondents reporting “very low” levels of anxiety (0-1) decreased from 29% in wave 1 to 26% in wave 2. This suggests that anxiety levels decreased for some of those with high levels of anxiety at wave 1, while some with lower levels saw an increase.
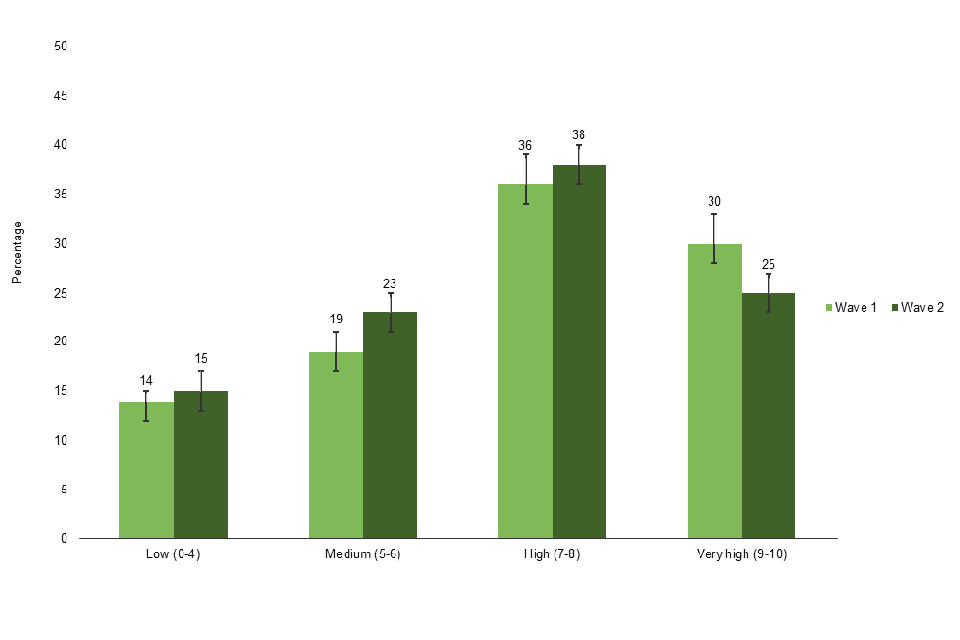
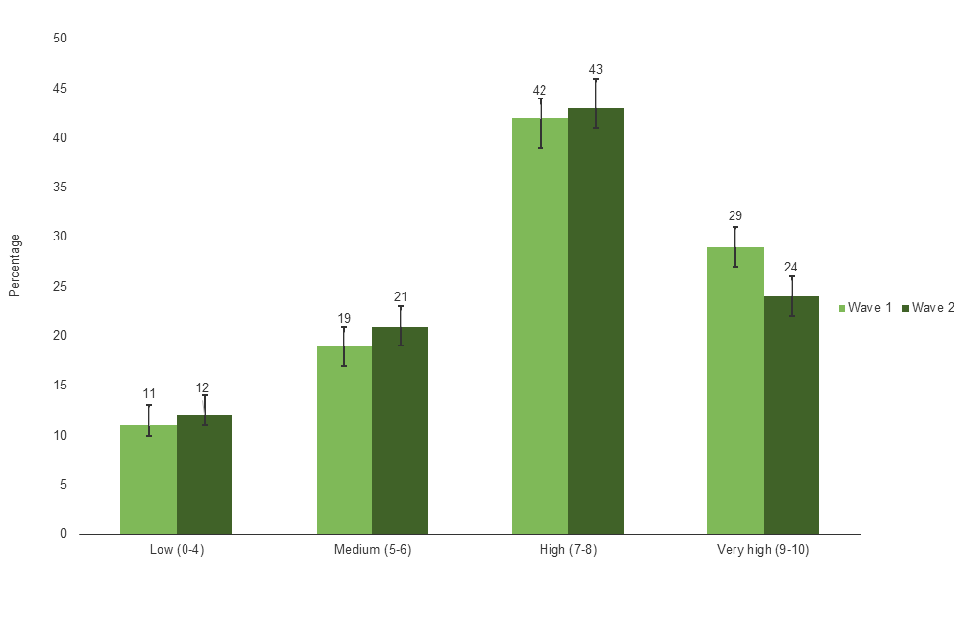
Figure 7.3: Personal wellbeing measures (net change)
Life satisfaction scores
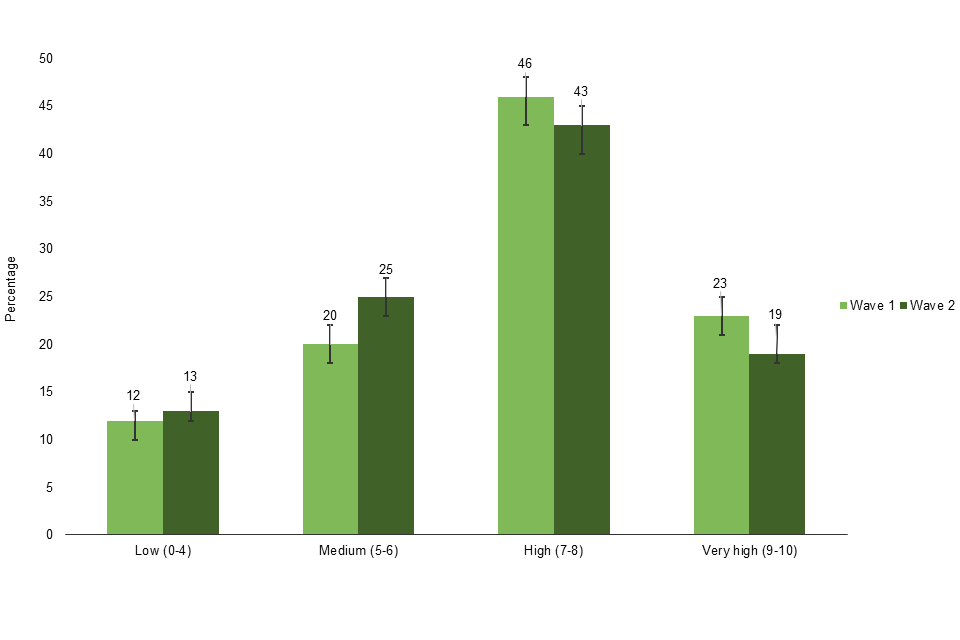
All respondents excluding don’t know and refused responses: Wave 1 (2,791); Wave 2 (2,806).
Happiness scores
All respondents excluding don’t know and refused responses: Wave 1 (2,796); Wave 2 (2,811).
Self-worth scores
All respondents excluding don’t know and refused responses: Wave 1 (2,787); Wave 2 (2,804).
Anxiety scores
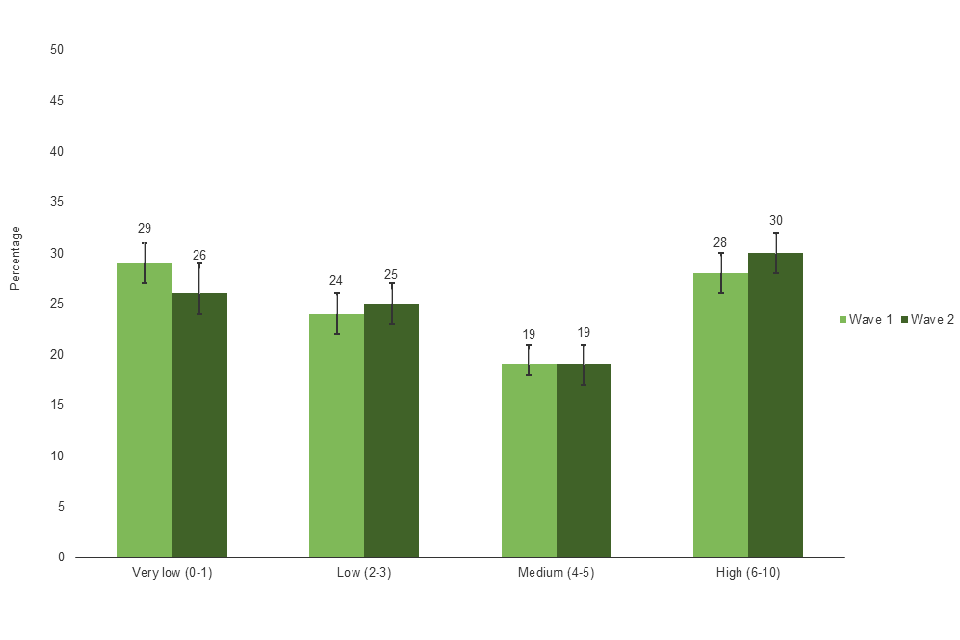
All respondents excluding don’t know and refused responses: Wave 1 (2,789); Wave 2 (2,807).
7.2.2 Gross change in personal wellbeing
Gross change refers to the change at the level of the individual (see Glossary).
The classification used for this analysis is summarised in Table 7.4 below.
Table 7.4: Categories of gross change
| Gross change category | Description |
|---|---|
| Increased personal wellbeing | Wellbeing scores increased by 1 point or more (out of 10) between waves |
| No change | The same wellbeing score was given at both waves |
| Decreased personal wellbeing | Wellbeing scores decreased by 1 point or more (out of 10) between waves |
Overall, wellbeing was more likely to have deteriorated than improved at wave 2:[footnote 7]
-
39% reported a decrease in life satisfaction at wave 2 (29% reported an increase)
-
40% reported a decrease in self-worth (30% reported an increase)
-
42% reported a decrease in happiness (33% reported an increase).
However, the dynamics of change differed slightly for levels of anxiety with roughly equal proportions either feeling more (39%) or less (36%) anxious at wave 2 than at wave 1.
Figure 7.6: Change in personal wellbeing between wave 1 and wave 2 (gross change)
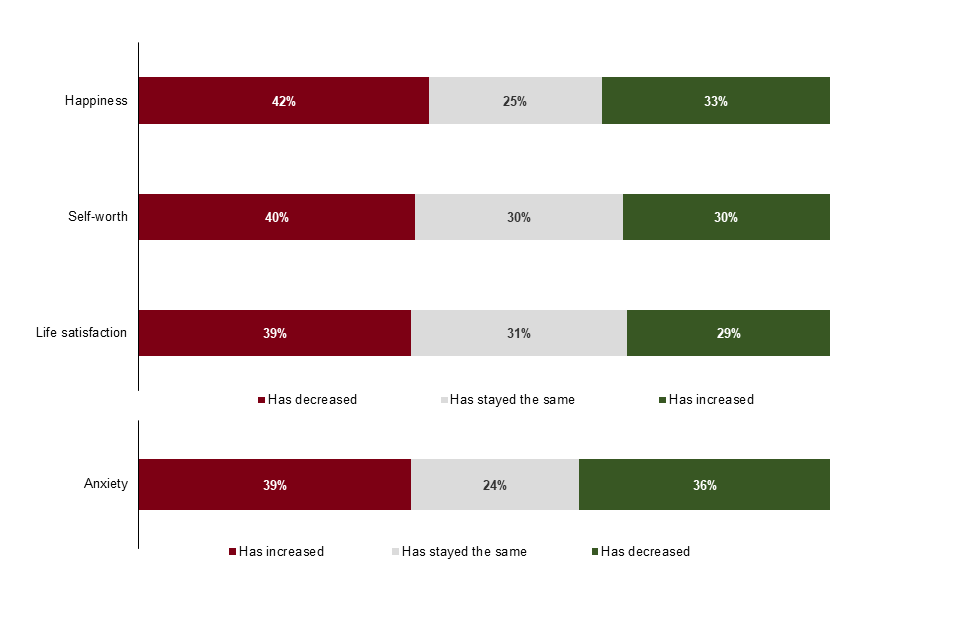
All respondents excluding don’t know and refused responses: happiness (2,795); feeling that things done in life are worthwhile (2,780); life satisfaction (2,785); anxiety (2,785).
7.3 How have levels of loneliness changed during the COVID-19 pandemic?
7.3.1 Net change in levels of loneliness
This section covers net changes in loneliness between wave 1 (before the pandemic) and wave 2 (during the pandemic). On the whole, there was little net change over time on these measures.
Overall, 8% of wave 2 respondents said they felt lonely “often or always”. This is the same as in wave 1 (8%).
Other measures of loneliness included in the survey also showed little variation between waves:
-
In wave 2, 13% of respondents reported that they lacked companionship often, similar to wave 1 (12%)
-
11% reported feeling left out often (compared with 11% in wave 1)
-
15% reported feeling isolated from others often (compared with 12% in wave 1).
7.3.2 Gross change in levels of loneliness
This section covers gross change in levels of loneliness. Most respondents reported the same level of loneliness at wave 1 and at wave 2, across all loneliness measures. See Figure 7.6.
Where change did occur, respondents at wave 2 were slightly more likely to report an increase in loneliness than a decrease, across all loneliness measures.
-
Around three in ten (28%) respondents reported that they felt lonely more often at wave 2, while a quarter (25%) reported they felt lonely less often.
-
The findings for the other three measures of loneliness were very similar: 18% reported that they lacked companionship more often,19% felt left out more often, and 20% felt isolated more often at wave 2.
-
Slightly smaller proportions of respondents reported that they lacked companionship less often (14%), felt isolated less often (14%), and felt left out less often (15%).
Figure 7.7: Change in levels of loneliness between wave 1 and wave 2 (gross change)
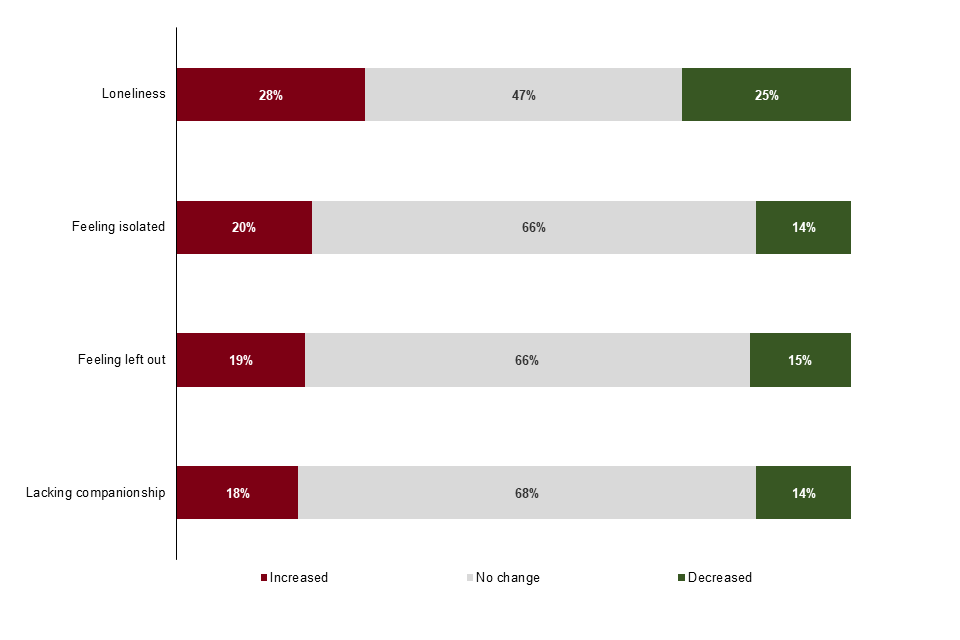
All respondents excluding don’t know and refused responses: loneliness (2,796); feeling isolated (1,914); feeling left out (1,911); lacking companionship (1,912).
7.3.3 Who has seen a change in levels of loneliness?
Certain groups within the population were more likely than others to report a change in levels of loneliness at wave 2, during the pandemic. See Table A.1 in Appendix A.
People with a long-term limiting illness
-
Respondents with a long-term limiting illness[footnote 8] were more likely than those without to report that they felt lonely less often at wave 2 than at wave 1 (28% vs. 21%).
-
Conversely those without a long-term limiting illness were more likely to report that they felt lonely more often at wave 2 than at wave 1 (30%, compared with 22% of respondents with a long-term limiting illness).
Although conducted over a different time period, research conducted by ONS[footnote 9] found that there was no evidence of a link between lockdown loneliness and more objective indicators of health or wellness, such as having an underlying health condition or disability. ONS highlighted that it is possible that those with a long-term limiting illness may have received more support during the lockdown than they would have otherwise had, or that they were able to engage in a wider range of activities offered virtually than was previously possible. Although fieldwork for the CLRS took place in July, just after restrictions had begun to ease, those with a long-term limiting illness may still have had access to additional support and a wider range of virtual activities in this period than before the pandemic.
Despite respondents with a long-term limiting illness being more likely than those without to feel lonely less often at wave 2 than at wave 1, it is worth emphasising that data from a wide range of studies (including the annual Community Life Survey) shows that adults with a long-term limiting illness are more likely to feel lonely, and less likely to say they never feel lonely, than those who do not have a long-term limiting illness.[footnote 10]
Ethnic minorities (excluding White minorities)
- Ethnic minorities (excluding White minorities) were more likely than respondents from a White background to feel isolated less often at wave 2 than at wave 1 (19% vs. 14%).
People living in the 20% most deprived areas (LSOAs)
- Respondents living in the 20% most deprived areas were more likely than those living in the 20% least deprived areas to report feeling lonely less often at wave 2 than at wave 1 (31% vs. 20%).
Young people aged 16-24
-
Young people aged 16-24 were more likely than older people aged 70+ to report that they felt lonely more often at wave 2 than at wave 1 (36% compared with 24%).
-
They were also more likely than older age groups aged 40 or over to report that they lacked companionship more often at wave 2 (28% compared with no higher than 16% across all other age groups aged 40 or over).
-
They were more likely than older people aged 70+ to report that they felt left out more often at wave 2 (28% vs. 13%).
Research conducted by ONS[footnote 11], covering the period between 3rd April 2020 and 10th May 2020, found that during lockdown young people aged 16-29 were more likely than older age groups to say they felt bored and lonely. ONS also noted that younger people were more likely than older groups to be worried about the impact of the pandemic on their relationships with others such as friends and partners (with whom young people are less likely to live, so may have been unable to see during lockdown). Although it is worth emphasising that at the time of the ONS research, government advice was to stay at home and only go out for specified reasons. Whereas the CLRS took place in July 2020, when restrictions were starting to ease, and people were able to meet up with other people outside of their household.
People living in urban areas
-
Respondents living in urban areas were more likely than those living in rural areas to report they felt less lonely at wave 2 than at wave 1 (26% vs. 20%) and that they felt left out less often (16% vs. 10%).
-
However, they were more likely to report that they lacked companionship more often (19% vs. 11%) and that they felt isolated more often (21% vs. 14%).
-
https://www.ons.gov.uk/peoplepopulationandcommunity/wellbeing/methodologies/surveysusingthe4officefornationalstatisticspersonalwellbeingquestions ↩
-
https://gss.civilservice.gov.uk/policy-store/loneliness-indicators/ ↩
-
https://www.ons.gov.uk/peoplepopulationandcommunity/wellbeing/methodologies/personalwellbeingsurveyuserguide ↩
-
The first three measures of loneliness were added to the 2019-20 CLS, after some initial experimental work commissioned by ONS. As such the base sizes are smaller for these measures. ↩
-
https://www.ons.gov.uk/peoplepopulationandcommunity/wellbeing/bulletins/personalandeconomicwellbeingintheuk/june2020 ↩
-
This applies to average ratings for life satisfaction, self-worth, and happiness. ↩
-
On a scale of 0-10. ↩
-
This measure was collected at wave 1. ↩
-
https://www.ons.gov.uk/peoplepopulationandcommunity/wellbeing/bulletins/coronavirusandlonelinessgreatbritain/3aprilto3may2020 ↩
-
https://www.gov.uk/government/publications/community-life-survey-201920-wellbeing-and-loneliness/wellbeing-and-loneliness-community-life-survey-201920 ↩
-
https://www.ons.gov.uk/peoplepopulationandcommunity/birthsdeathsandmarriages/ageing/articles/coronavirusandthesocialimpactsonyoungpeopleingreatbritain/3aprilto10may2020 ↩