5. Charitable giving - Community Life COVID-19 Re-contact Survey 2020
Published 8 December 2020
Applies to England

© Crown copyright 2020
This publication is licensed under the terms of the Open Government Licence v3.0 except where otherwise stated. To view this licence, visit nationalarchives.gov.uk/doc/open-government-licence/version/3 or write to the Information Policy Team, The National Archives, Kew, London TW9 4DU, or email: psi@nationalarchives.gov.uk.
Where we have identified any third party copyright information you will need to obtain permission from the copyright holders concerned.
This publication is available at https://www.gov.uk/government/statistics/community-life-covid-19-re-contact-survey-2020-main-report/5-charitable-giving-community-life-covid-19-re-contact-survey-2020
In the 2018-19 and 2019-20 Community Life Survey (referred to as wave 1) and the 2020 Community Life Re-contact Survey (referred to as wave 2), charitable giving is defined as donating money to charity excluding donating goods or prizes.
This chapter explores charitable giving behaviours and views during the four-month period following the start of the pandemic, and how the pattern of these has changed since before the pandemic.
5.1 Interpretations and limitations
This chapter compares charitable giving behaviours and views at wave 1 and wave 2, examining both net and gross change. Net change refers to the overall differences in rates of charitable giving at wave 1 and wave 2, while gross change refers to change at the level of the individual (see Glossary for further details).
The recall period for charitable giving at both wave 1 and wave 2 was four weeks and therefore findings can be broadly compared on a like-for-like basis. Fieldwork for wave 2 ran from 7th June through to 26th June 2020, so the recall period covers May-June 2020 depending on the date of interview.
While all findings presented in this chapter are broadly comparable between the two waves it is important to note that, as outlined in section 2.2 and section 2.5, questionnaire content varies according to the mode of survey administration.
The following questions include data collected via online and postal at wave 1, but online only at wave 2 for reasons of practicality, affecting their comparability:
- Donation to charity in the past four weeks
- Amount given to charity
- Methods of giving to charitable causes
- Factors that would encourage respondents to give more.
Data was collected online only at both waves 1 and 2 for the question about charitable causes donated to.
5.2 How has the amount of charitable giving changed since the start of the COVID-19 pandemic?
This section examines the proportion of respondents giving to charitable causes in the past four weeks and the amount they gave. It covers both net and gross changes between wave 1 (before the pandemic) and wave 2 (during the pandemic).
5.2.1 Net change in the percentage who gave to a charitable cause in the past four weeks
In summary, the following net changes in charitable giving behaviour were observed:
-
The percentage of respondents who reported that they had given money to charitable causes in the past four weeks decreased from 73% at wave 1 to 62% at wave 2. However, while there was a decrease in the proportion making a donation, the average amount each donor gave had increased between wave 1 and wave 2 (see 5.2.2).
-
There was no change in the percentage of 16-24-year olds who had donated in the past four weeks (58% at both waves 1 and 2). However, all other age groups saw a decline of ten percentage points or more. Of all the age groups, those aged 70+ recorded the largest fall, from 85% at wave 1 to 70% at wave 2.
-
The proportion of respondents from a White background who had given to charitable causes in the past four weeks decreased from 75% at wave 1 to 63% at wave 2. There was no significant change in the equivalent proportion of ethnic minorities (excluding White minorities) over the same period (61% at both wave 1 and wave 2).
-
The percentage of those who gave to charitable causes in the past four weeks declined more in rural areas (79% at wave 1, compared with 61% at wave 2) than in urban areas (72% at wave 1, compared with 63% at wave 2).
5.2.2 Net change in the amount given to charitable causes in the past four weeks
In summary, the following net changes in amount given were observed:
-
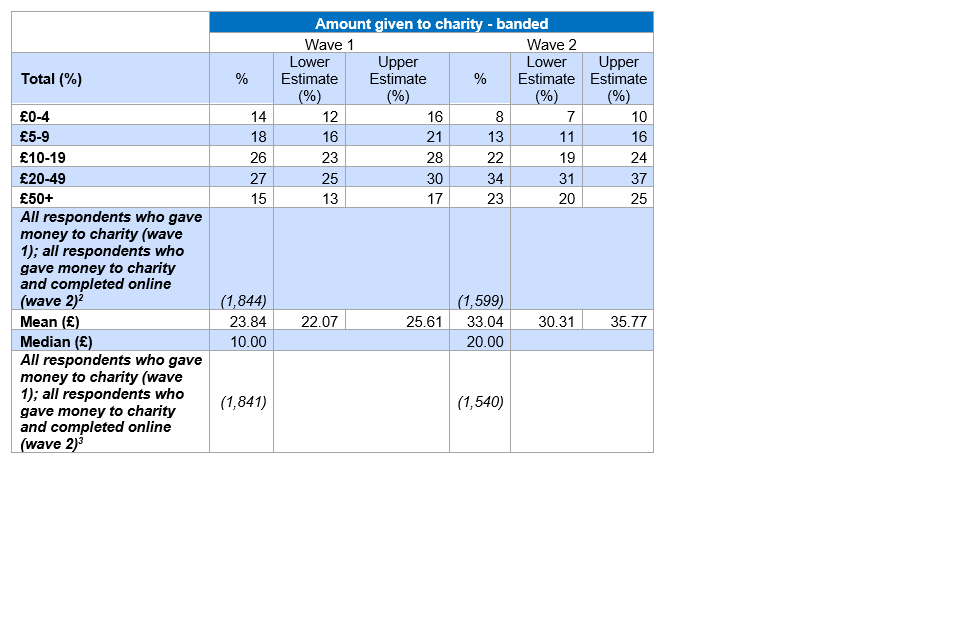
Among those who had given to charity in the past four weeks, the proportion giving £20 or more increased from 42% at wave 1 to 57% at wave 2, during the pandemic. The percentage who donated £50 or more increased from 15% at wave 1 to 23% at wave 2.
-
Accordingly, the mean amount given (excluding those who donated £300 or more) increased from £24 at wave 1 to £33 at wave 2.[footnote 1]
Table 5.1: Amount given to charity in past four weeks among those donating (net change)
5.2.3 Gross change in the amount given to charitable causes in the past four weeks
The classification used for the gross change analysis of the amount given to charitable causes is summarised in Table 5.2 below.
Table 5.2: Charitable giving - categories of gross change
| Gross change category | Description |
|---|---|
| New or renewed donors | Had not donated in the past four weeks at wave 1 but had donated in the past four weeks at wave 2 |
| Continuing donor, increased amount | Had donated in the past four weeks at wave 1 and had donated a higher amount in the past four weeks at wave 2 |
| Continuing donor, no change | Had donated in the past four weeks at wave 1 and had donated the same amount in the past four weeks at wave 2 |
| Continuing donor, reduced amount | Had donated in the past four weeks at wave 1 and had donated a lower amount in the past four weeks at wave 2 |
| Lapsed or intermittent donor | Had donated in the past four weeks at wave 1 but had not donated in the past four weeks at wave 2 |
Most respondents changed their donation behaviour in the past four weeks between wave 1 and wave 2:
-
Around one in ten respondents (11%) were new or renewed donors
-
A higher proportion (24%) were lapsed or intermittent donors
-
A third (34%) were continuing donors who had given a higher amount at wave 2
-
A fifth (20%) were continuing donors who had given a lower amount at wave 2
-
One in ten (10%) donated the same amount at both wave 1 and 2.
The gross change analysis also revealed changes in charitable giving varied by age, ethnicity and whether someone lived in a rural/urban area.
New or renewed donors
-
Those aged 16-24 were more likely than any other age group to be new or renewed donors (20%, compared with a low of 5% among those aged 70+).
-
Around one in eight (13%) respondents in urban areas were new or renewed donors, a higher proportion than was found in rural areas (6%).
-
Ethnic minorities (excluding White minorities) were more likely to be new or renewed donors (20%) than those from a White background (10%).
Increased donation
-
Compared with the other age groups, those aged 70+ were most likely to report that they had donated at both waves and had increased their donation amount at wave 2, during the pandemic (44%, compared with a low of 26% among those aged 25-39).
-
Those in the 20% least deprived areas were more likely than those in more disadvantaged areas to report that they had donated at both waves and had increased their donation amount at wave 2 (42%, compared with values of between 31% and 32% for each of the other four area deprivation quintiles).
Lapsed or intermittent donors
-
There were more lapsed or intermittent donors in rural areas (28%) than in urban areas (23%).
-
Compared to other regions in England, respondents living in the North East (34%) and East Midlands (30%) were the most likely to be lapsed or intermittent donors, while those in Yorkshire and Humberside (17%) and London (18%) were the least likely to fall into this category.
Figure 5.3: Charitable giving in past four weeks (gross change)

All respondents excluding don’t know and refused responses (2,025); 16-24 (139); 70+ (281); Urban (1,719); Rural (306).
The other questions relating to charitable giving were not well suited to gross change analysis. As such, the rest of this chapter focuses on net change between wave 1, before the pandemic and wave 2, during the pandemic.
5.3 How have the methods of donation changed?
Respondents who had made a charity donation in the past four weeks were asked which methods, if any, they had used to donate.
-
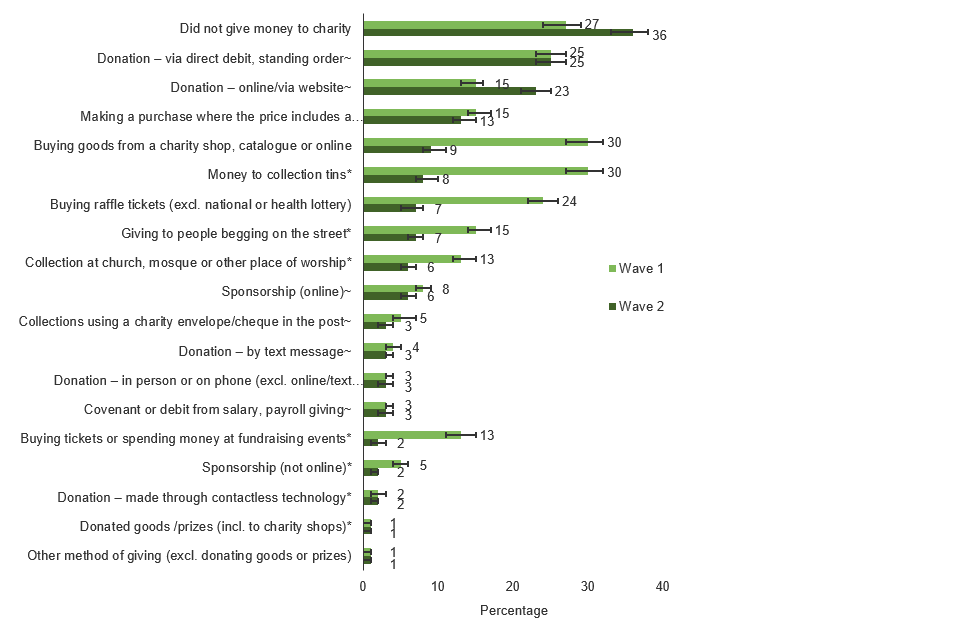
Donation made online/via a website was the only method of charitable giving which was more widely used by respondents at wave 2 (23%), during the pandemic than at wave 1 (15%), before the pandemic.
-
Automated donation methods which involved repeat payments were relatively resilient in the face of the challenges posed by the pandemic. A quarter of respondents (25% at both waves 1 and 2) reported that they had donated by direct debit or standing order in the past four weeks.
-
Donation by covenant, direct debit from salary or payroll giving was also stable (3% at both waves).
-
The incidence of charitable giving via purchases where the price includes a charitable donation (or where a charitable donation can be added to the purchase) also remained stable (15% at wave 1, compared with 13% at wave 2).
-
Many of the previously most common means of charitable giving were much less widely used at wave 2 than at wave 1:
-
The proportion of respondents who had given money to collection tins (e.g. door-to-door, in the street, in a pub, at work, on a shop counter, etc.) fell from 30% at wave 1 to 8% at wave 2.
-
The proportion of respondents who had bought goods from a charity shop, catalogue or online fell from 30% at wave 1 to 9% at wave 2.
-
The proportion of respondents who had bought raffle tickets (excluding the National and Health Lotteries) fell from 24% at wave 1 to 7% at wave 2.
-
The proportion of respondents giving to beggars on the street fell from 15% at wave 1 to 7% at wave 2.
-
The proportion of respondents who had bought tickets or spent money at fundraising events (e.g. charity dinners, fetes, jumble sales) fell from 13% at wave 1 to 2% at wave 2.
-
The main factor underlying these widespread changes appears to be whether the method of donation involves in-person contact or is conducted remotely.
Looking at these methods of donation in combination, at wave 1 around half (51%) of respondents had given to charity through one of the in-person methods in the past four weeks. At wave 2 this proportion had fallen to around one in five (22%).
Meanwhile, the proportion who had given to charity via any of the remote methods remained relatively stable (44% at wave 2, compared with 41% at wave 1). There was, however, an increase in the proportion of 16-24-year olds donating by remote methods, from 21% at wave 1 to 41% at wave 2. Given that it is not possible to classify all of the response categories as being either ‘in-person’ or ‘remote’, these findings should only be considered as indicative. Nevertheless, there does appear to be an underlying trend away from in-person giving in wave 2, during the pandemic.
Figure 5.4: Methods of donation to charity (net change)
All respondents who gave to charity in the past four weeks apart from those who made a donation through contactless technology, excluding don’t know and refused responses: Wave 1 (2,455); Wave 2 (2,428).
All respondents who gave to charity in the past four weeks and who made a donation through contactless technology, excluding don’t know and refused responses: Wave 1 (1,487); Wave 2 (2,428).[footnote 2]
Categories flagged with ‘*’ are classified as ‘in person’. Categories flagged with ‘~’ are classified as ‘remote’.
Please note - this question was only asked of online respondents at wave 2
5.4 Changes in the drivers of donation since the start of the COVID-19 pandemic
The changes in recent donation behaviours outlined above did not correspond with any substantial change in the drivers of donation. While there were practical barriers to donating using face-to-face methods during the period of restrictions, the reasons for donation appear to be largely unchanged.
The top three motivators at both waves were:
-
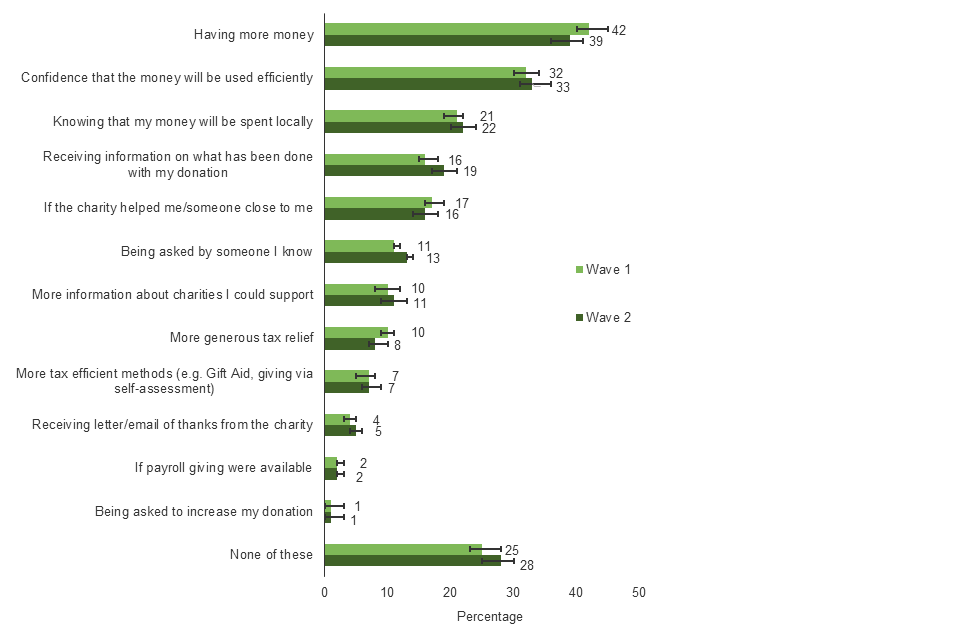
Having more money’ (42% at wave 1, 39% at wave 2)
-
‘Confidence that the money will be used efficiently’ (32% at wave 1, 33% at wave 2)
-
‘Knowing that my money will be spent locally’ (21% at wave 1, 22% at wave 2).
The proportion of respondents who said that none of the options presented in the questionnaire would motivate them to start donating or donate more increased from 25% at wave 1 to 28% at wave 2. This suggests a slight decrease in willingness to donate.
The drivers of charitable giving had also remained largely stable across most of the key demographic groups, but there were some differences.
-
Those living in rural areas had become more likely to say that knowing that the money would be spent locally was a motivator (24% at wave 2, compared with 19% at wave 1).
-
The proportion of 55-69-year olds who said that ‘having more money’ would be a motivator decreased from 38% at wave 1 to 31% at wave 2.
-
Conversely, the proportion of 16-24-year olds who said that having more money would be a motivator increased from 50% at wave 1 to 65% at wave 2.
16-24-year olds selected a larger number of different motivators on average at wave 2 compared with wave 1, suggesting that their perceptions around charitable giving may have been more affected than those from older groups, for whom differences between wave 1 and wave 2 were much less pronounced.
Figure 5.5: Factors that would encourage respondents to start donating or to give more (net change)
All respondents excluding don’t know and refused responses: Wave 1 (2,464); Wave 2 (2,460).
Please note - this question was only asked of online respondents at wave 2.
5.5 Changes in causes to which donations are made
The proportion of respondents reporting that they had donated to almost all of the prompted causes decreased between wave 1, before the pandemic and wave 2, after the pandemic.
The largest percentage point falls were for:
-
Medical research (22% at wave 1 vs. 14% at wave 2)
-
Physical/Mental Healthcare/Disabled people (13% at wave 1 vs. 7% at wave 2)
-
Schools, colleges, universities or other education (8% at wave 1 vs. 3% at wave 2)
-
Religion/place of worship (14% at wave 1 vs. 8% at wave 2).
The proportion of respondents reporting that they had donated to hospitals and hospices in the past four weeks remained stable (19% at wave 1 vs. 16% at wave 2). This meant that hospitals and hospices overtook medical research as the most common beneficiary of donations at wave 2.
Focusing on the largest percentage point falls, as above, gives a useful indication of the causes which have seen the largest reduction in donors in absolute terms. However, by definition, it is not possible for the less widely supported causes to see such large percentage point declines (given that the size of the falls outlined above is larger than the proportion of respondents who supported some of the smaller causes at wave 1). When considering the data in Figure 5.6, below, it is therefore important to bear in mind that a small percentage point change between waves may nevertheless equate to the loss of a large proportion of donors for the less widely supported causes.
Figure 5.6: Causes to which money was given in the past four weeks (net change)
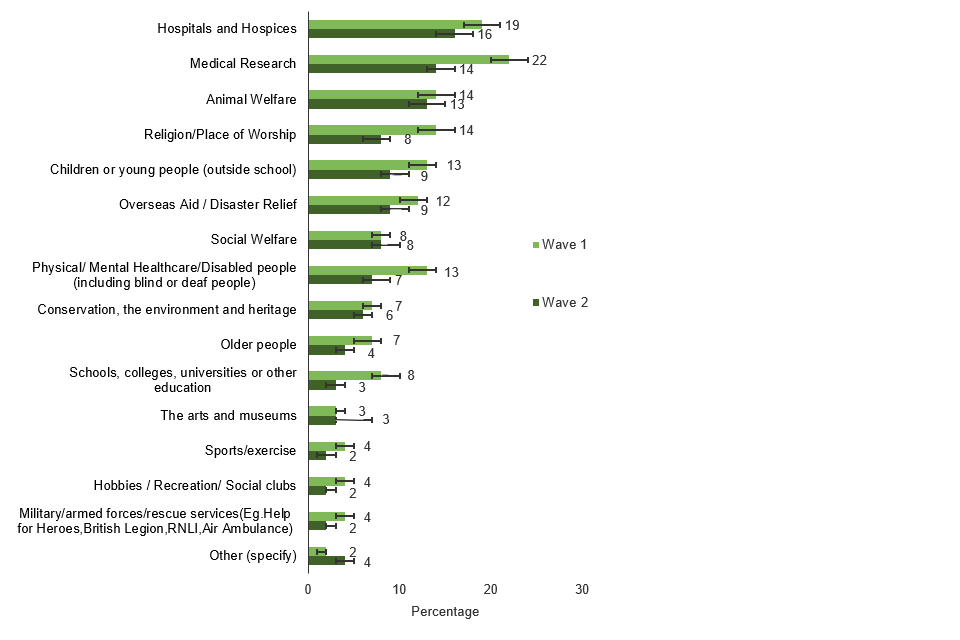
All respondents who gave to charity in the past four weeks and completed online: Wave 1 (2,317); Wave 2 (2,292)