3. Formal Volunteering - Community Life COVID-19 Re-contact Survey 2020
Published 8 December 2020
Applies to England

© Crown copyright 2020
This publication is licensed under the terms of the Open Government Licence v3.0 except where otherwise stated. To view this licence, visit nationalarchives.gov.uk/doc/open-government-licence/version/3 or write to the Information Policy Team, The National Archives, Kew, London TW9 4DU, or email: psi@nationalarchives.gov.uk.
Where we have identified any third party copyright information you will need to obtain permission from the copyright holders concerned.
This publication is available at https://www.gov.uk/government/statistics/community-life-covid-19-re-contact-survey-2020-main-report/3-formal-volunteering-community-life-recontact-survey-2020
In the 2018-19 and 2019-20 Community Life Surveys (referred to as wave 1) and the 2020 Community Life Re-contact Survey (referred to as wave 2), formal volunteering is defined as giving unpaid help to groups or clubs, for example, leading a group, providing administrative support or befriending or mentoring people.
This chapter explores the rate of formal volunteering during the four-month period following the start of the pandemic, and how the pattern of formal volunteering has changed since before the pandemic.
3.1 Interpretation and limitations
This chapter compares the prevalence and profile of formal volunteers at wave 1 and wave 2, examining both net and gross change. Net change refers to the overall differences in rates of formal volunteering at wave 1 and wave 2, while gross change refers to change at the level of the individual (see Glossary for further details).
While all findings presented in this chapter are broadly comparable between the two waves it is important to note the following limitations:
Wording changes (affects net change and gross change measures)
-
There were a small number of minor question wording changes between wave 1 and wave 2 to take account of the unique circumstances during the pandemic. At question ‘FGroup’[footnote 1] where respondents were asked about volunteering activities, wave 2 respondents were asked to include participation in online as well as face-to-face activities. The descriptions of volunteering sectors were also slightly edited in some cases to include additional ‘new’ types of post-pandemic volunteering such as NHS volunteer responders, helping NHS staff, and helping people affected by coronavirus. It is likely that these instances of volunteering would have been captured even without the changes in wording and therefore the impact of these wording changes is likely to be small.
-
As noted in section 2.4 , most wave 2 respondents (88%) completed the survey by web and 12% competed by telephone (CATI). The full version of ‘FGroup’ was too challenging for telephone survey administration given the need for the interviewer to read out the full text. As a result, some of the categories were edited slightly in the CATI version to reduce word length; for example, in some volunteering categories, CATI respondents were presented with fewer examples of volunteering types compared with the web survey.
Length of recall period (affects overall rates of volunteering, gross change measure only)
- As the wave 2 recall period (4 months) is shorter than the wave 1 recall period (12 months), the wave 2 survey will not capture volunteers who volunteer very infrequently, that is less than once every 4 months but at least every 12 months. This means that overall rates of volunteering (used in the gross change measure) cannot be compared on a like-for-like basis at wave 1 and wave 2 at wave 2.
As a result of the above, while rates of formal volunteering at wave 1 and wave 2 are broadly comparable, some caution should be applied when drawing conclusions about change over time.
3.2 How have levels of formal volunteering changed during the COVID-19 pandemic?
3.2.1 Net change in levels of volunteering
This section covers net changes in formal volunteering between wave 1 (before the pandemic) and wave 2 (during the pandemic). Regular formal volunteering is defined as volunteering at least once a month.
-
Overall, 21% of wave 2 respondents took part in regular formal volunteering which is similar to the rate at wave 1 (23%).
-
Among regular formal volunteers at wave 1 and wave 2, the amount of time spent volunteering was similar. The median amount of time spent volunteering in the past 4 weeks among regular formal volunteers was 6 hours at wave 2 which was similar to wave 1 (7 hours).
Table 3.1: Participation in regular formal volunteering and hours spent volunteering (net change)[footnote 2]

3.2.2 Gross change in levels of volunteering
Classification of gross change
Gross change refers to the change at the level of the individual (see Glossary). Given the limitations noted in section 3.1, only an approximate measure of gross change can be produced. The classification used for this analysis is summarised in Table 3.2 below.
Table 3.2: Formal volunteering - categories of gross change
Categorisation is approximate and should be interpreted with caution due to differences in the way data were collected at wave 1 and wave 2 (see section 3.1 above)
| Gross change category | Description |
|---|---|
| New formal volunteer | Did not volunteer over the 12-month period at wave 1 but did volunteer over the 4-month period at wave 2 |
| Continuing formal volunteer, increased frequency | Volunteered over a 12-month period at wave 1 and volunteered with increased frequency over a 4-month period at wave 2 |
| Continuing formal volunteer, unchanged | Volunteered over a 12-month period at wave 1 and volunteered with the same regularity over a 4-month period at wave 2 |
| Non-formal volunteer, unchanged | Did not volunteer either over the 12-month period at wave 1 or over the 4-month period at wave 2 |
| Continuing formal volunteer, reduced frequency | Volunteered over a 12-month period at wave 1 and volunteered with reduced frequency over a 4-month period at wave 2 |
| Lapsed or paused formal volunteer | Volunteered over a 12-month period at wave 1 but did not volunteer over the 4-month period at wave 2 |
Examining gross change in formal volunteering reveals that there was more change at the individual level than the relatively stable net change figures may suggest.
-
Overall, 62% of respondents at wave 2 had the same formal volunteering status as at wave 1: 53% remained non-volunteers while 9% took part in formal volunteering with the same frequency at both waves. This left 38% who had done either more or less formal volunteering at wave 2 compared with wave 1.
-
Breaking this down further, 23% had done less formal volunteering at wave 2 (20% had stopped or paused and 3% had continued but with reduced frequency) while 15% had done more formal volunteering (9% had started volunteering during this period while 6% had continued but with increased frequency).
-
The overall gross change profile is displayed in Figure 3.3.
Figure 3.3: Changes in formal volunteering behaviour between wave 1 and wave 2 at the individual level (gross change)
Findings are approximate and should be interpreted with caution due to differences in the way data were collected at wave 1 and wave 2 (see section 3.1).

Findings are approximate and should be interpreted with caution due to differences in the way data were collected at wave 1 and wave 2 (see section 3.1).
All respondents excluding don’t know and refused responses (2,767).
Who has changed their pattern of formal volunteering?
The following groups were most likely to have lapsed or paused formal volunteering at wave 2, following the pandemic:
-
Female respondents (22%, compared with 18% of male respondents)
-
Younger respondents aged 16-24 (28% of those aged 16-24 which is higher than those aged 25-39, 17%)
-
Respondents with a limiting long-term illness or disability (26%, compared with 19% who do not have this).
Focusing on those who started formal volunteering at wave 2 (‘new volunteers’):
-
There was little variability by demographic subgroups
-
Ethnic minorities (excluding White minorities) were however more likely to start volunteering at wave 2 compared with those from a White background (12% vs. 8%).
3.3 Are people doing different types of formal volunteering during the COVID-19 pandemic?
Overall, 27% of wave 2 respondents had taken part in any formal volunteering in the four months following the pandemic (March-July) and 13% of wave 2 respondents had taken part in formal volunteering during this time that was specifically related to helping people affected by COVID-19 or associated restrictions.
This means that about half (48%) of wave 2 respondents who had volunteered in the four months following the pandemic were helping people affected by the pandemic.
Although the overall rate of regular volunteering remained similar across wave 1 and wave 2, there were significant shifts in the nature of volunteering activities carried out by regular formal volunteers at wave 1 and wave 2.
As shown in Figure 3.4, at wave 2, regular formal volunteers were less likely than at wave 1 to take part in many traditional forms of volunteering activity such as:
-
Helping to run an event (49% at wave 1 vs. 21% at wave 2)
-
Fundraising or sponsoring (42% at wave 1 vs. 19% at wave 2)
-
Leading a group (41% at wave 1 vs. 30% at wave 2)
-
Getting others involved (35% at wave 1 vs. 24% at wave 2).
Figure 3.4: Ways in which regular formal volunteers have given unpaid help to groups, clubs or organisations (net change)
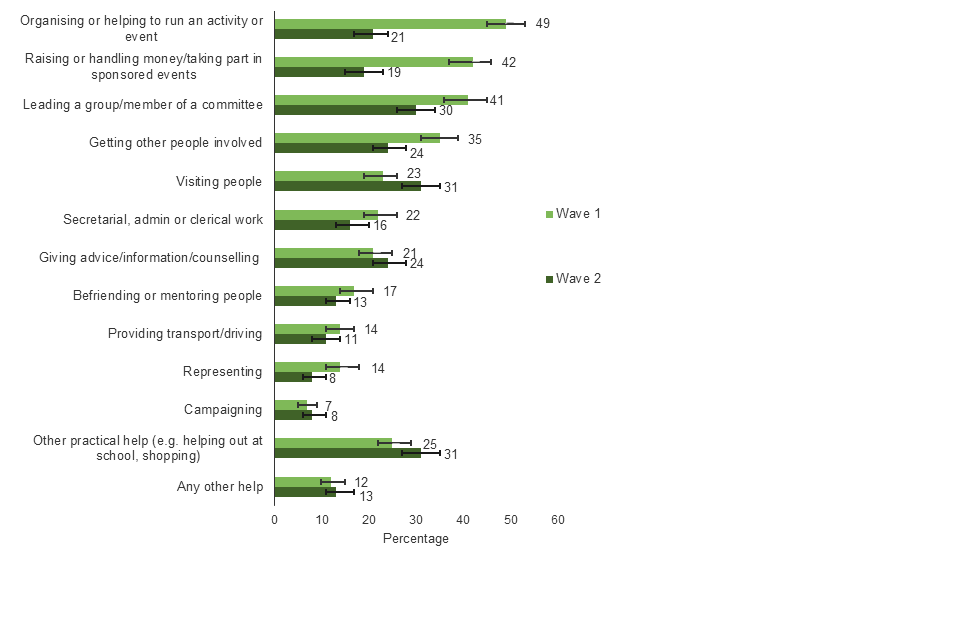
All regular formal volunteers excluding those who gave a don’t know or refused response: Wave 1 (843); Wave 2 (750).
3.4 What was the nature of COVID-19 related volunteering following the pandemic?
Of those wave 2 respondents who were doing COVID-19 related formal volunteering, 44% said that this was organised through an independent local community group such as a mutual aid group, community forum or neighbourhood group. This emphasises the role of community networks in enabling formal volunteering during this period.
Respondents who had volunteered formally since the pandemic were asked if they had signed up to COVID-19 related formal volunteering activities after the pandemic or if they were already involved in these sorts of activities before the pandemic.[footnote 3] Of those who volunteered since COVID-19, many did volunteering activities that only started after the pandemic (56%) versus 44% that continued doing something they were already involved in before the pandemic.
Table 3.5: When respondents started doing formal volunteering that contributed to the COVID-19 response, wave 2 [footnote 4]

Table 3.6 displays the profile of respondents who took part in COVID-19 related formal volunteering compared with respondents who took part in other types of formal volunteering at wave 2.
-
COVID-19 related formal volunteers were more likely than other formal volunteers to be female (59% vs. 43%) and to be aged between 25 and 69 years old (80% vs. 66%).
-
COVID-19 related formal volunteers were also more likely than other formal volunteers to have key worker status during the pandemic (33% vs. 24%).
-
In addition, COVID-19 related formal volunteers were more likely than other formal volunteers to have switched to home working during the four months since the start of the pandemic (29% vs. 20%).
Table 3.6: Profile of respondents who had participated in COVID-19 related formal volunteering and other types of formal volunteering, wave 2 [footnote 5]

3.5 Do people want to continue or do more formal volunteering once COVID-19 restrictions are lifted?
Overall, 54% of wave 2 respondents said they would like to either start, continue or do more formal volunteering once restrictions end and life starts to get back to normal. However, this varied considerably by experiences of volunteering in the four-month period following the pandemic.
-
86% of respondents who had formally volunteered at wave 2 were interested in volunteering in the future compared with 42% who had not formally volunteered at wave 2.
-
91% of wave 2 respondents who took part in regular formal volunteering at least once a month wanted to continue compared with 72% of wave 2 respondents who volunteered less than once a month.
3.6 What are the barriers to formal volunteering during the COVID-19 pandemic?
Those who did not formally volunteer regularly were asked about their reasons for not doing so. The barriers at wave 1 and wave 2 were very similar and the top three barriers continued to be:
-
‘I have work commitments’ (52% at wave 1, 50% at wave 2)
-
‘I do other things in my spare time’ (36% at both wave 1 and wave 2)
-
‘I have to look after children’ (27% at wave 1, 26% at wave 2).
At wave 2 an additional option was offered ‘Too difficult during the coronavirus outbreak’ and 26% of wave 2 respondents who had not volunteered regularly cited this as a barrier.
-
The questionnaire can be found in the Technical Note. ↩
-
Excluding those who gave a don’t know or refused response and respondents who completed via postal questionnaire at wave 1. ↩
-
For example, a respondent may have been helping at a foodbank before the pandemic and continued to provide this help during the pandemic. ↩
-
Excluding those who gave a don’t know or refused response. ↩
-
Excluding those who gave a don’t know or refused response. ↩