Civil Justice Statistics Quarterly: January to March 2021
Published 3 June 2021

© Crown copyright 2021
This publication is licensed under the terms of the Open Government Licence v3.0 except where otherwise stated. To view this licence, visit nationalarchives.gov.uk/doc/open-government-licence/version/3 or write to the Information Policy Team, The National Archives, Kew, London TW9 4DU, or email: psi@nationalarchives.gov.uk.
Where we have identified any third party copyright information you will need to obtain permission from the copyright holders concerned.
This publication is available at https://www.gov.uk/government/statistics/civil-justice-statistics-quarterly-january-to-march-2021/civil-justice-statistics-quarterly-january-to-march-2021
1. Main Points
| Covid-19 and associated actions have had an impact on all civil actions | This quarter, civil justice actions remain below pre-Covid-19 levels. However, the marked recovery seen last quarter has continued for some actions following the impact of measures undertaken by the courts. |
| Decrease in County Court claims driven by specified money claims | In January to March 2021, County Court claims were down 18% on the same period in 2020, to 403,000. Of these, 340,000 were specified money claims (down 15%). |
| Unspecified money claims were up 10% to 33,000 | The increase in unspecified money claims was driven by an uptick in Other unspecified money claims (up 135% to 8,700). This was partially offset by Personal Injury claims (down 7% to 25,000). |
| The number of claims defended and number of trials has decreased | There were 69,000 claims defended (down 8%) and 14,000 claims that went to trial in January to March 2021 (down 16%). |
| Mean time taken from claim to hearing has increased | The mean time taken for small claims and multi/fast track claims to go to trial was 51.5 weeks and 73.4 weeks, 11.9 weeks longer and 14.0 weeks longer than the same period in 2020 respectively. |
| Judgments were down 13% and default judgments were also down 13% | Judgments were down 13% (to 260,000) in January to March 2021, compared to the same period in 2020; with 89% of these being default judgments. |
| 18,000 enforcement applications and 10,000 enforcement orders made | Enforcement applications were down 20% while enforcement orders were down 36%. |
| 68,000 warrants were issued | Warrants issued were down 37% when compared to same quarter in 2020 - driven by a decrease in warrants of control. |
| 610 judicial review applications in 2021 | There were 610 applications for Judicial Reviews in the first quarter of 2021, down 23% on the same period in 2020. Of the 140 cases in 2021 that reached the permission stage, 11 (8%) were found to be ‘totally without merit’. |
This publication gives civil county court statistics for the latest quarter (January to March 2021), compared to the same quarter of the previous year. The judicial review figures cover the period up to January to March 2021, and The Royal Courts of Justice statistics (published annually) cover the period January to December 2020. For more details, please see the supporting document.
Statistics on the Business and Property Court for England and Wales have also been published alongside this quarterly bulletin as Official Statistics. For technical detail, please refer to the accompanying support document.
For general feedback related to the content of this publication, please contact us at: CAJS@justice.gov.uk
2. Statistician’s comment
The recovery from the impact of Covid-19 continues to be seen across all Civil Justice data this quarter. Though volumes are still significantly below previous (pre-Covid) levels, they are comparable to levels seen in the same period last year, at the start of the pandemic in the UK. This is particularly evident in the volume of claims defended which increased further compared to last quarter and volumes are now just 8% lower than the same period last year. Compared to the first quarter in 2019 (pre-Covid), volumes of claims defended are even closer to trend levels, at just 5.5% lower. However, the mean time taken from claim to hearing remains significantly negatively impacted by Covid-19.
The only increase in claim volumes was in “other” unspecified money claims (up 135% on the same quarter in 2020). As noted last quarter, this increase is as a result of PPI-related claims that rely on a section of the Consumer Credit Act that relates to unfair relationships and follows a series of court rulings on the matter.
Due to the nature of Civil claims, especially as Covid-19 restrictions come to an end, claim volumes are likely to return closer to historic trend levels but we expect timeliness measures to remain impacted. As timeliness measures are taken from the initial claim date, data for the next few quarters is likely to include cases issued before or during the early stages of the pandemic. Measures implemented following the pandemic, such as the opening of Covid secure courtrooms and the increase in hearings by remote means, will have benefited later cases and as such should show in timeliness measures towards the end of 2021.
Nightingale courts continue to be used to provide additional venues to help cope with demand.
3. Claims Summary
County court claims were down 18% on the same quarter of 2020, driven by money claims.
There were 403,000 County Court claims lodged in January to March 2021. Of these, 373,000 were money claims (down 13% from January to March 2020).
Non-money claim volumes were at 30,000, down 49% when compared to the same quarter last year.
Mortgage and landlord possession claims were down 76% over the same period to 7,100, ‘other non-money claims’ were down 20% to 22,000 and claims for return of goods were down 42% to 1,400.
Figure 1: County Court claims by type, Q1 (January to March) 2016 to Q1 (January to March) 2021 (Source: table 1.2)
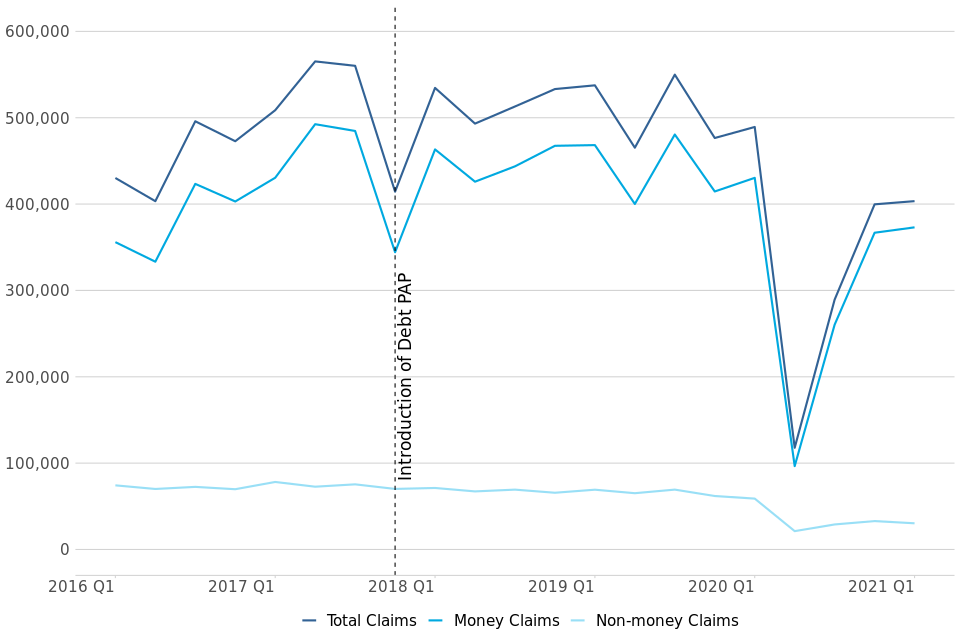
In the most recent quarter, total claims were down 18% compared to the same period in 2020 (from 489,000 to 403,000). Of these, 373,000 were money claims, down 13% from January to March 2020 (from 430,000). Money claims made up 92% of all claims in January to March 2021 in comparison to 88% of total claims in January to March 2020 (up 5pp).
Prior to the sharp fall in 2020, County Court claims had been generally increasing from 2015, reaching a peak of 565,000 claims in April to June 2017. This increase was driven by a rise in money claims, which make up the majority of claims received. Prior to 2020, claim volumes have been relatively unchanged but volatile, driven by a few “bulk issuers” slowing down and then ramping up their volume of claims. Claim volumes decreased significantly following the outbreak of Covid 19, with volumes this quarter continuing the recovery towards pre-Covid levels.
Non-money claims have been generally decreasing since 2015. While these showed less of an impact following Covid-19 in contrast to money claims, the recovery of the volumes of non-money claims to pre-Covid volumes has been slow. In the current quarter, these claims were down 49% (from 59,000 to 30,000) compared to the same period in 2020.
Within non-money claims, ‘other’ non-money claims have shown a decline since 2018. In the most recent quarter, these were down 20% (from 27,000 to 22,000) compared to the same period in 2020.
The overall trend in Mortgage and Landlord Possession claims has been decreasing since a peak of 60,000 in January to March 2014. There were 7,100 claims in January to March 2021, down 76% compared to the same quarter of 2020 (29,000 claims). This decrease has been driven by a fall in all claims types since March 2020 due to actions following Covid19. Further details can be found in the Mortgage and Landlord Possessions publication annex here.
Claims for return of goods increased steadily to a high of over 3,000 in July-September 2018, with this trend stabilising in recent quarters. This quarter, as for other claim types, claims for return of goods were down 42% (from 2,500 to 1,400) in January to March 2021 compared to the same period in 2020.
4. Money Claims
Specified money claims were down 15% (to 340,000 claims) in January to March 2021 compared to the same quarter in 2020, driving the overall trend in money claims.
Specified money claims of up to (and including) £1,000 were down 16% over this period to 206,000, driving the overall trend in specified money claims.
Unspecified claims were up 10% to 33,000, driven solely by a rise in Other - unspecified money claims (up 135% to 8,700) compared to the same quarter in 2020.
Personal Injury claims accounted for 74% of all unspecified money claims in the most recent quarter, down 14pp on January to March 2020, when they accounted for 88% of all claims.
Figure 2: Specified money claims by monetary value, Q1 (January to March) 2016 to Q1 (January to March) 2021 (Source: civil workload CSV)
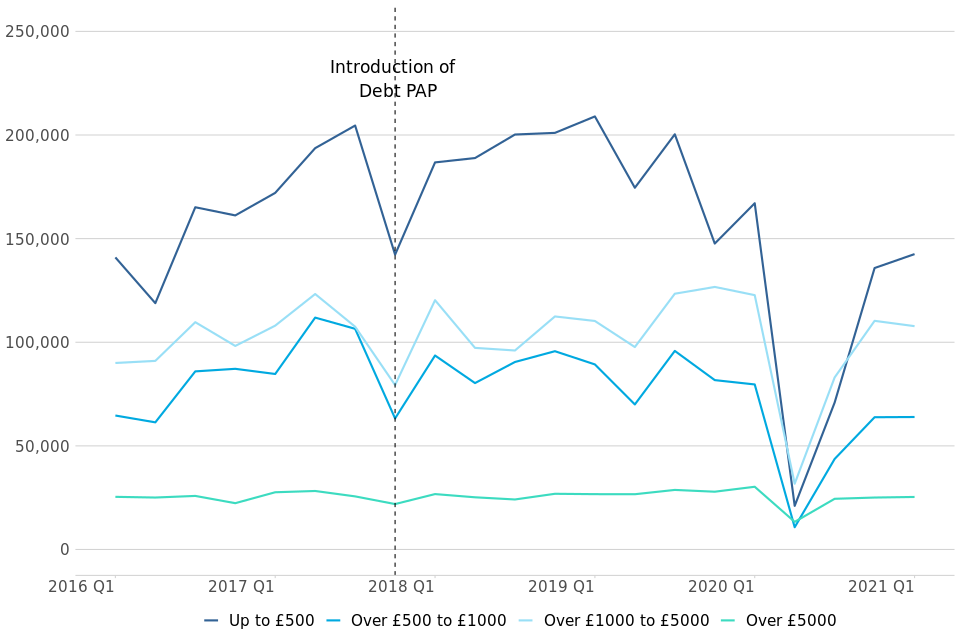
Historically, specified money claims reached a peak in October to December 2017, at which point the implementation of the Pre-Action Protocol (PAP) for Debt Claims in October 2017 led to a sharp drop in claims. An increasing trend resumed the following quarter, suggesting that the impact of the PAP on claim volumes was temporary. The main aim of the protocol is to encourage early engagement between parties to resolve disputes without needing to start court proceedings. In the most recent quarter (January to March 2021), there were 340,000 claims, down 15% on the same quarter in 2020 (400,000 claims).
This quarter, the majority (84%) of specified money claims were processed and issued at the County Court Business Centre (CCBC). There were 286,000 such claims at the CCBC in January to March 2021 (down 13% on the same quarter in 2020). CCBC claims have been particularly affected by Covid-19 and associated actions, with a more significant decrease than other specified money claims but they are now returning to historic trend levels. For comparison, they made up 82% of specified money claims in January to March 2020). This is as a result of bulk issuers almost completely ceasing their issue during the immediate response to the pandemic and now starting to increase these volumes.
The change in specified money claims is driven by lower value claims (under £1,000). These were down 16% to 206,000 claims in the period January to March 2021, compared to 2020, and account for just 61% of total specified money claims in the most recent quarter. This is a return to historical levels following the previously noted significant decline, with this category makeing up 62% of total specified money claims in January to March 2020. When compared to the same quarter in the previous year, the next claim band (above £1,000 up to and including £5,000) was similarly affected, down 12% to 108,000 claims. As a result, this value bracket made up 32% of total specified money claims in the most recent quarter, compared to 31% in January to March 2020.
Other than Q2 2020, unspecified money claims have fluctuated between 20,000 and 40,000 claims each quarter over the last five years (since January to March 2016). More recently, the volumes were up 10% in January to March 2021 compared to the same period in 2020 (up from 30,000 to 33,000). This was driven solely by other unspecified money claims, up 135% from 3,700 to 8,700; this is at its highest level since quarter 1 of 2012 (when there were 14,000 claims). This was partially offset by a fall in personal injury claims, down 7% compared to the same period in 2020 (from 27,000 to 25,000). The increase in other unspecified money claims is as a result of PPI-related claims that rely on a section of the Consumer Credit Act that relates to unfair relationships and follows a series of court rulings on the same matter.
4.1 County court claims by month and 5-year average
Claims for quarters 2 to 4 of 2020 and quarter 1 of 2021 – which covers the peak Covid-19 period, have been shown by month (figure 3) to further examine the impact of Covid-19 and related actions on claim volumes in county courts.
Figure 3: Monthly county court claims by type, January-December 2019, April 2020 to March 2021, and 5-year average
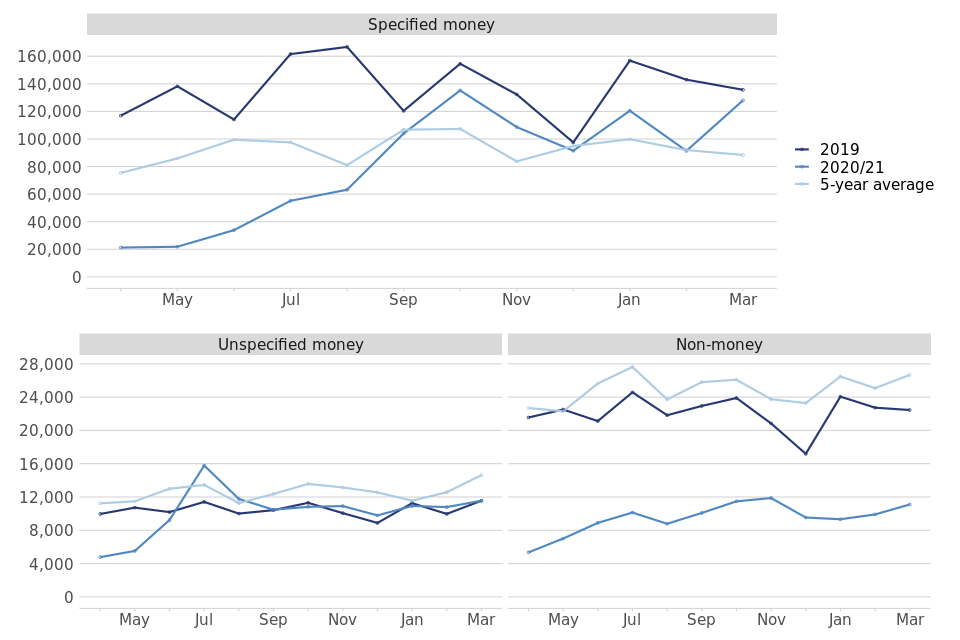
A pronounced trend is visible for specified money claims; the initial fall in volumes was seen in March (down 6% on 2019 and up 45% on the five-year average - not shown in figure 3), coinciding with wide-scale closure of courts[footnote 1] across England and Wales as a result of Covid-19, and many bulk claim issuers “pausing” new claims following guidance from the FCA[footnote 2]. This was followed by further falls in April and May with just 21,000 and 22,000 claims respectively (down more than 70% on the five-year average in both cases).
The first significant uptick was seen in June, with 34,000 claims. Similar rises were then seen throughout Q3 of 2020; with 55,000 and 63,000 claims in July and August (down 43% and down 22% on the five-year average respectively). After the continued recovery in September 2020, October claim volumes, at 135,000 claims, were up 26% on the 5-year average, although still down 13% on the higher volumes seen in 2019. This recovery seems to have continued over the last few months with the levels remaining between the 5-year average and the higher 2019 levels. The latest three months (120,000, 91,000 and 128,000 claims respectively) have continued this trend.
Unspecified money claim volumes did not see such a significant decline; at the lowest points this reached 4,800 claims in April, down 57% on the five-year average. A partial recovery to pre-Covid levels had commenced by June, with claim volumes only down 29% on the five-year average. By July, volumes had risen to 16,000, up 17% on the five-year average. Following this, claim volumes declined slightly, returning to volumes consistent with previous years in August and September and this pattern has continued (11,000, 11,000 and 12,000 claims for January, February and March respectively).
In contrast, non-money claim volumes had declined significantly by April, reaching just 5,400 claims, down 76% on the five-year average. Following this, volumes rose slightly through May-July, reaching a high of 10,000 in July, still down 63% on the five-year average. Claim volumes have fluctuated slightly since then (9,300, 9,900 and 11,000 claims respectively for the first three months of 2021). March was down 58% compared to the 5-year average and showed no signs of returning to pre-Covid levels yet.
4.2 Allocations (table 1.3)
In January to March 2021, 41,000 money claims were allocated to track, down 5% (from 43,000) on the same period in 2020. A decrease was seen across all tracks, with small claims allocations showing the largest decline. Compared to January to March 2020, of these allocations:
- 25,000 were allocated to small claims, down 6% on January to March 2020. This accounts for 60% of all allocations (compared to 60% of all allocations in the same quarter of 2020);
- 14,000 were allocated to fast track, down 3% on January to March 2020. This accounts for 34% of all allocations (compared to 33% of all allocations in the same quarter of 2020);
- 2,700 were allocated to multi-track, down 6% on January to March 2020. This accounts for 7% of all allocations (compared to 7% of all allocations in the same quarter of 2020);
5. Defences (including legal representation) and Trials
The number of claims defended was down 8% to 69,000 compared to the same quarter in 2020.
Of those claims defended, 60% had legal representation for both claimant and defendant, 22% had representation for claimant only, and 3% for defendant only.
The number of trials was down 16% to 14,000 compared to the same quarter in 2020
Average time taken for small claims was 51.5 weeks (11.9 weeks longer compared to the same quarter in 2020) and for multi and fast track claims it was 73.4 weeks (14.0 weeks longer than January to March in 2020).
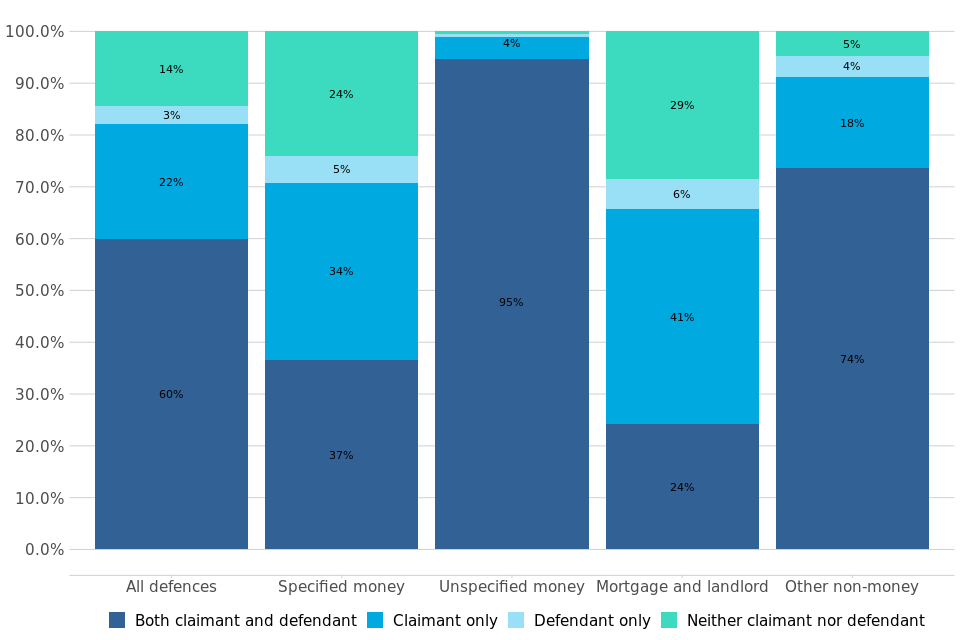
Of those claims defended in January to March 2021, 60% had legal representation for both claimant and defendant, 22% had representation for claimant only, and 3% for defendant only. Almost all (95%) unspecified money defences had legal representation for both the defendant and claimant, compared with 37% of specified money defences.
Changes in representation compared to the same quarter last year is primarily influenced by the larger fall in specified money claim volumes in comparison to unspecified money claims, with the latter being more likely to have representation for both parties. It should also be noted that the proportion of unspecified money claims where only the claimant has representation remains at 4%. This is the highest proportion noted since 2013 (when these figures were first provided) - both parties in such cases usually have representation.
Figure 4: Proportion of civil defences and legal representation status, January to March 2021 (Source: table 1.6)
The total number of claims defended was down 8% in January to March 2021 compared to the same quarter in 2020, from 75,000 to 69,000 cases. This was driven by decreases across all claim types, with the most significant impact from specified money claims being defended (down 15% from 47,000 to 39,000). However, it should be noted that this fall in specified money claims defended (down 15%) is similar to the fall in specified money claims issued (down 15%).
Figure 5: Monthly county court claims defended, January-December 2019, April 2020 to March 2021, and 5-year average
As with total claims, the monthly breakdown of claims defended in figure 5 shows variance throughout the past three quarters. Due to the time taken from claim to defence, the initial decline in defence volumes was not seen until April, where claims defended were down 10% to 19,000, followed by a more significant fall in May to 12,000 defences. Defence volumes then showed a steady recovery through June and July (14,000 and 17,000 defences respectively). By August, defence volumes were up 1% on the five-year average (20,000 defended claims) and continued to rise, with September 2020 volumes (25,000 defended claims) being up 19% on the 5-year average, as well as up 4% on the higher volumes seen in 2019.
This recovery continued in Q4 2020 and Q1 2021 but has not been steady until the last two months. The most recent monthly figures (21,000, 21,000 and 28,000 defended claims for January, February and March respectively) have started to show a return to pre-Covid levels. For example, February was up 7% on the 5-year average and down 8% on the higher volumes seen in 2019, and December was up 2% on the 5-year average and down 8% on 2019.
5.1 Trials and Time Taken to Reach Trial (table 1.5)
Defended cases which are not settled or withdrawn, generally result in a trial. In total, there were 14,000 trials in January to March 2021, down 16% compared to the same period in 2020. Of the claims that went to trial, 11,000 (76%) were small claims trials (down 15% compared to the same quarter in 2020) and 3,400 (24%) were fast and multi-track trials (down 18% from the same quarter of 2020).
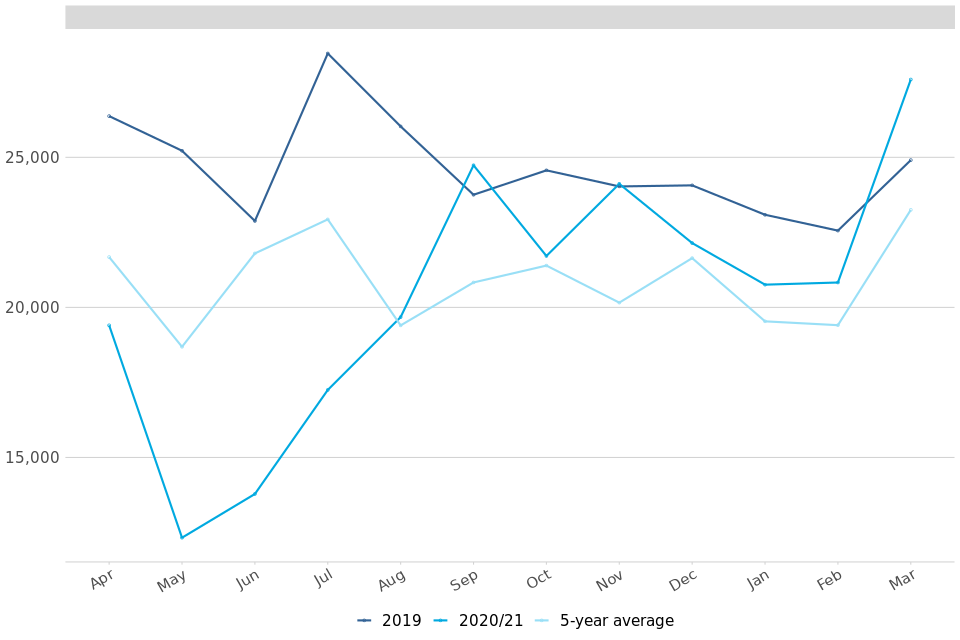
Figure 6: Average number of weeks from claim being issued to initial hearing date, Q1 (January to March) 2016 to Q1 (January to March) 2021 (Source: table 1.5)
In January to March 2021, it took an average of 51.5 weeks between a small claim being issued and the claim going to trial, 11.9 weeks longer than the same period in 2020.
Small Claims have been disproportionally impacted by Covid-19 in terms of timeliness for a number of reasons. These claims have shorter timeframes to begin with, and so delays will be observed sooner in the timeliness figures, whereas delayed Fast and Multitrack claims may not yet have reached a hearing. Small claims may also be less suited to remote hearings as they tend to be in person claims rather than professional users.
Measures put in place to help with the backlog of small claims include: Small Claims Mediation (re-referring cases back to mediation) and Early Neutral Evaluation (where a judge will try and engineer agreement without any finding on the fact). These measures, when successful, result in outcomes which are not used within the timeliness calculations. This means the final cases used in timeliness measures include a disproportionate number of more complex cases which take longer to dispose of.
For multi/fast track claims, it took on average 73.4 weeks to reach a trial, 14.0 weeks longer than in January to March 2020 – continuing to exceed the upper limit of the range 2009-2019 (52 to 62 weeks).
Covid-19 and associated actions have led to an uptick in time taken for all claims to reach trial. However, it should be noted that this timeliness is calculated from a reduced volume of cases, and is not necessarily representative of a trend. Prior to this, a sustained period of increasing receipts had increased the time taken to hear civil cases and caused delays to case progress. Additional venues have been provided to add temporary capacity to hear cases and help the court and tribunal system to run effectively.
6. Judgments
Judgments were down 13% compared to same quarter in 2020
There were 260,000 judgments made in January to March 2021, in comparison to 300,000 in the same quarter of 2020. Of these judgments, 230,000 (89%) were default judgments.
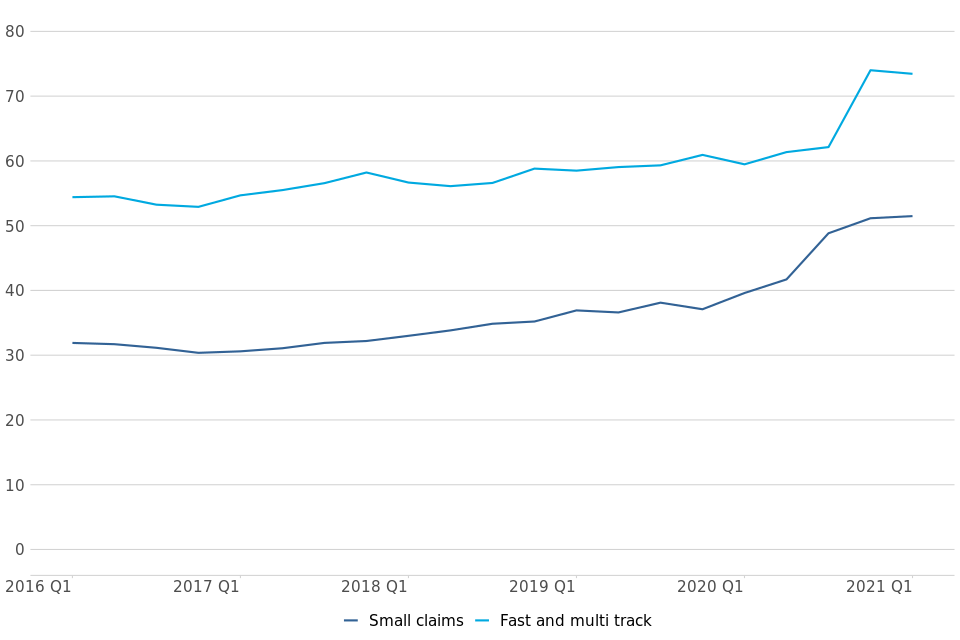
Figure 7: All claims, judgments and default judgments, Q1 (January to March) 2016 to Q1 (January to March) 2021 (Source: tables 1.2 and 1.4)
There were 260,000 judgments made in January to March 2021, down 13% compared to the same quarter of 2020. Of these, 89% were default judgments. The number of default judgments was down 13% (from 265,000 to 230,000) on January to March 2020.
The second largest type of judgment was ‘judge’, of which there were 10,000 in January to March 2021, down 19% on the same quarter in 2020 (from 13,000). ‘Judge’ judgments accounted for 4% of all judgments.
7. Warrants and Enforcements
Warrants issued were down 37% when compared to same quarter in 2020
In January to March 2021, 68,000 warrants were issued, down 37% from 108,000 in the same quarter of 2020. Of these, 65,000 (96%) were warrants of control, down 29% compared to the same period in 2020.
Enforcement applications were down 20% and enforcement orders were down 36% when compared to January to March 2020
All application categories were down on January to March 2020. Attachment of earnings (AoE) applications were down 18% (from 14,000 to 12,000), while AoE orders were down 43% (from 7,200 to 4,100).
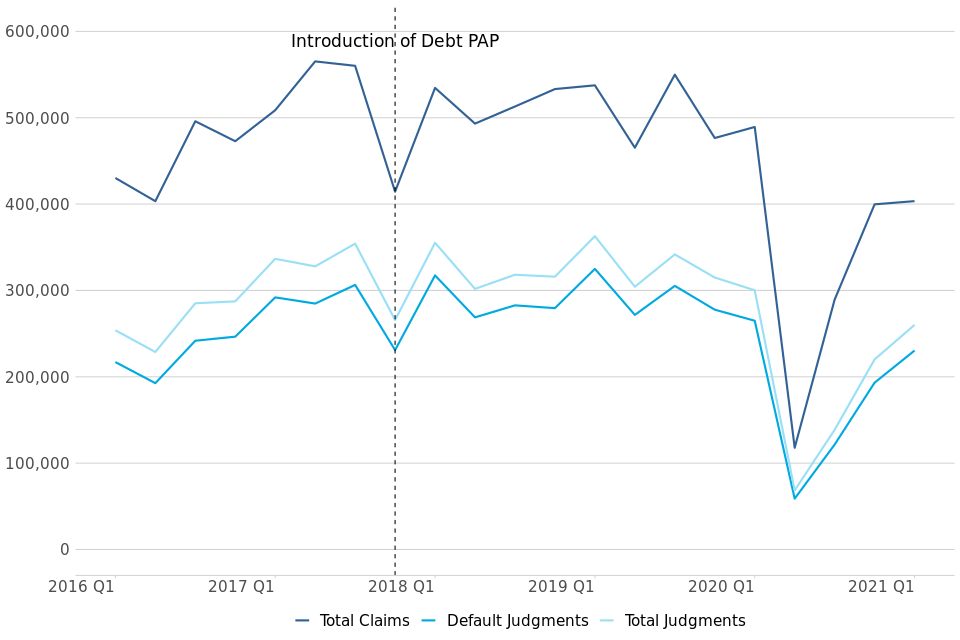
Figure 8: Warrants and enforcements issued – Q1 (January to March) 2016 to Q1 (January to March) 2021 (Source: tables 1.7 and 1.8)
7.1 Warrants (table 1.7)
In the latest quarter (January to March 2021) there were 68,000 warrants issued, down 37% (from 108,000) on the same quarter in 2020; this decline was due to the continuing impact of Covid-19 and related actions.
Figure 9: Monthly warrants issued by type, January-December 2019, April 2020 to March 2021, and 5-year average
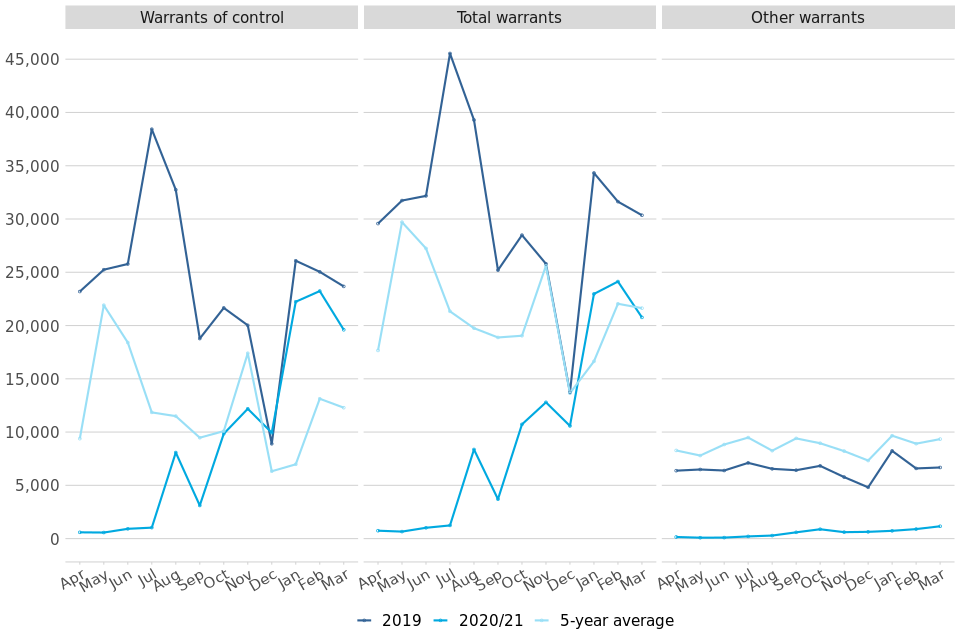
A monthly breakdown of warrants issued shows a particularly sharp decline following the initial impact of Covid-19. Following a significant decline in March and April, warrant volumes in April fell to just 740 (down 96% on the five-year average). Volumes remained similarly low for May, June and July (660, 1,000 and 1,200 warrants issued respectively).
Following this, different types of warrants showed different patterns. The volume of warrants of control spiked in August at 8,100 before falling in September 2020 to 3,100, down 67% on the five-year average. This fluctuating pattern was caused by large backlogs being issued by key bulk issuers in August, as well as local Covid restrictions in September. This volatile pattern has continued but seems to slowly be returning to historical levels in the first few months of 2021 (22,000, 23,000 and 20,000 warrants of control for January, February and March respectively). This was up 219%, up 77% and up 60% respectively compared to the 5-year average.
In contrast, other warrant types remained consistently low throughout the first few months of the year, with just 730, 900 and 1,200 other warrants issued in each of the first three months of 2021.
7.2 Enforcements (table 1.8)
In January to March 2021, there were 18,000 enforcement-related order applications (which include attachment of earnings orders, charging orders, third party debt orders, administration orders, and orders to obtain information), down 20% compared to the same quarter of 2020. All application types were down, in particular attachment of earnings (AoE) applications, which were down 18% (from 14,000 to 12,000).
There were 10,000 enforcement-related orders made in January to March 2021, down 36% compared to the same quarter of 2020. As with applications, orders fell across all order types, with the decrease driven by AoE orders, which were down 43% (from 7,200 to 4,100).
Over the longer term, there has been a decreasing trend in enforcement-related applications received and orders made since 2009, possibly due to claimants’ preference for using warrants instead to retrieve money, property or goods.
8. Judicial reviews[footnote 3]
Of the 610 applications received so far (January to March) in 2021, 24% have already closed, and 11 were found to be ‘Totally Without Merit’ (8% of cases that reached the permission stage).
There were 610 judicial review applications received in 2021, down 23% on the same period in 2020. In 2020, there were 2,800 applications received in total, down 16% on 2019 (from 3,400).
Figure 10: Annual Judicial Review Applications, by type; calendar year 2010-2020 (Source: table 2.1)
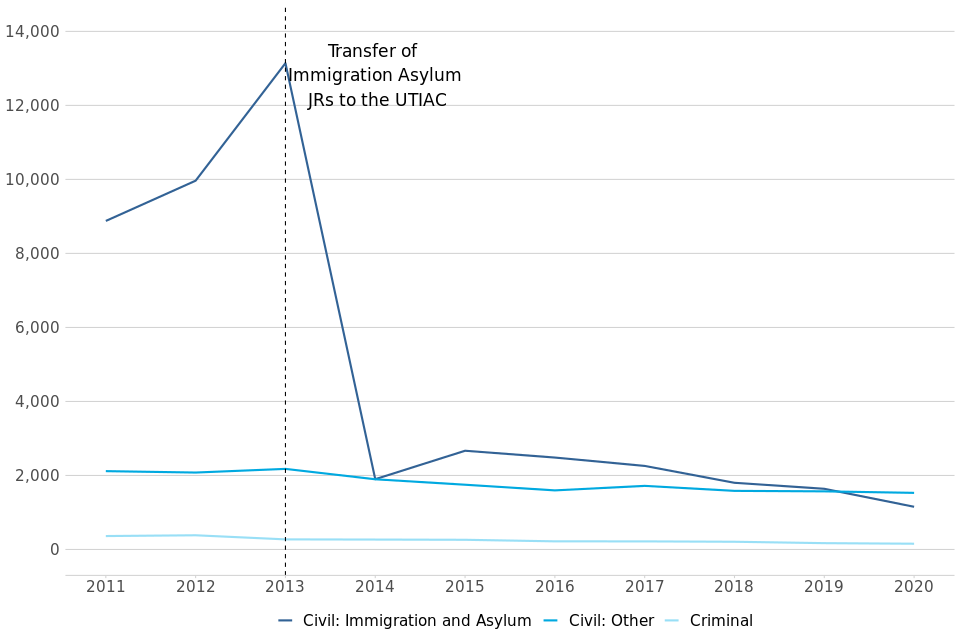
Of the 610 applications received January to March 2021, 240 were civil immigration and asylum applications, 350 were civil (other), and 30 were criminal, down 21%, down 23% and down 43% respectively on the same period of 2020. 7 of the civil immigration and asylum cases have since been transferred to the UTIAC.
Of the applications that were made in 2021 in the period January to March, 24% are now closed. Of the total applications, 140 reached the permission stage in 2021, and of these:
- 8% (11) were found to be totally without merit (TWM).
- 43 cases were granted permission to proceed and 86 were refused at the permission stage. However, 3 of cases refused at permission stage went on to be granted permission at the renewal stage.
- 46 of the 2021 cases have been assessed to be eligible for a final hearing and of these, 8 have since been heard.
- For the 2021 cases, the mean time from a case being lodged to the permission decision was 35 days, slightly down from 36 days across the same period of 2020.
8.1 Applications lodged against departments
Table 2.5 includes judicial review figures by defendant type (i.e. individual government department or public body). This table provides the number of judicial review applications lodged, permission granted to proceed to final hearing, and decisions found in favour of the claimant at final hearing.
The information presented is derived from the ‘defendant name’ – a free text field completed by the claimant, which is automatically matched and grouped by department. All efforts have been made to quality assure the data presented. However, this is a manually typed field, and as such is open to inputting errors and should be used with caution.
The key findings from January 2021 to March 2021 are:
- The Home Office was the department/body with the largest number of JR applications lodged against them, with 200 applications. Of these, 16 were granted permission to proceed to final hearing (8% of applications) to date.
- The second largest recipient of JR cases was the Local Authorities, with 150 cases received, of which to date 26 were granted permission to proceed to final hearing (17% of applications).
- The third largest recipient was Ministry of Justice, having 120 applications lodged against them. Of these, none were granted permission to proceed to final hearing to date.
A more granular view of the JR data by department and case type can be found in the newly developed data visualisation tool found here. Feedback is welcome on this tool to ensure it meets user needs.
9. Royal Courts of Justice
Annual court activity statistics for the various appeal courts that are administered by HM Courts and Tribunals Service (HMCTS) - key findings covering the year to 2020 are summarised below:
The Court of Appeal Criminal Division saw a 32% decrease over the year in the number of applications received, from 4,600 in 2019 to 3,100 in 2020. Decreases were recorded across all three appeal application types (conviction, sentence and other[footnote 4] appeal applications, down 33%, 32% and 22% respectively). (Table 3.7)
Court of Appeal Civil Division had 730 appeals filed in 2020, down 6% on 2019. Of the appeals filed in 2020, the largest number (230 appeals) came from the Chancery & Commercial section (31% of all appeals filed). The number of disposals in 2020 decreased by 15% to 770, when compared to 2019, with Immigration and Asylum cases making up the largest category (230 cases, 30% of all disposals). (Table 3.9)
Civil Division Timeliness showed an increase in average time taken for Permission to Appeal (PTA) decisions and decreases at all other stages of the appeal process. Mean time taken from “Notice Filed” to PTA decision has risen by 19% to 24 weeks whilst from PTA Granted to Hand Down of Judgement is 34 weeks (down 17 % on 2019). (Table 3.10)
Within the London Chancery Division, total proceedings has decreased from 2019 at 3,800. All proceedings covered by the Chancery Division decreased by 22% to 11,000 proceedings started. (Table 3.12)
The High Court – The Queen’s Bench – had 2,300 proceedings started in 2020, 50% lower than in 2019. Of these proceedings, the most common types in 2020 were for “personal injury actions”, “other negligence” and “clinical negligence”, which made up 26%, 22% and 21% of all proceedings respectively. (Table 3.20)
Commercial Court claims have reversed their long term downward trend with 880 claims in 2020, up 83% on 2019 but down 34% from the peak of 1,330 seen in 2011. The largest category of claim remains “General commercial contracts and arrangements, including agency agreements”, with 230 such claims issued in 2020. (Table 3.28)
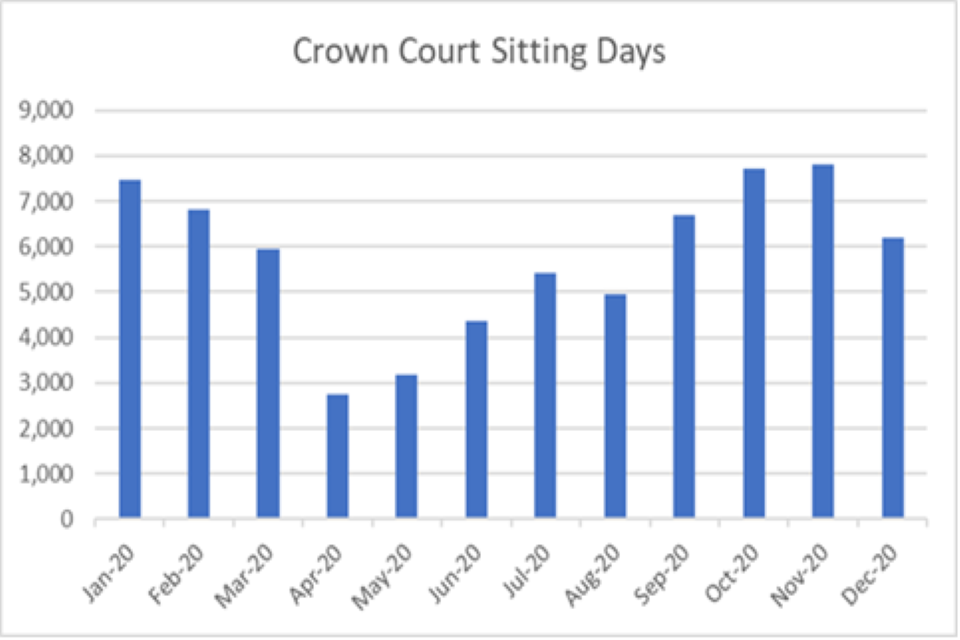
Days sat by Judge[footnote 5] - there were 280,000 days sat by judges in 2020, down from 300,000 (a decrease of 7.3%) in 2019. Across the covered court types, this was driven by a decrease in Crown Court sitting days, which fell by 22% (from 89,000 to 69,000 sitting days). The decrease in Crown Court sitting, as noted in the latest Criminal Justice Statistics quarterly publication[footnote 6], was driven by the effects of the lockdown and the initial requirement to close courtrooms and pause jury trials. This allowed the Crown Court estate to be made safe, but it did mean jury trials could not be delivered for a short period. This is demonstrated by the monthly data shown below, where there is a sharp fall noted in April and May that then starts to recover as new measures to adapt the court process are implemented. (Tables 5.1 and 5.2)
Figure 11: Crown Court Sitting Days by month; January to December 2020 (Source: HMCTS operational reports)
For further information on these summarised figures or on the statistics available in relation to the appeals courts’, please see the accompanying tables; ‘Royal Courts of Justice, 2020’.
10. Further information
10.1 Provisional data and revisions
The statistics in the latest quarter are provisional and revisions may be made when the next edition of this bulletin is published. If revisions are needed in subsequent quarters, these will be annotated in the tables.
10.2 Accompanying files
As well as this bulletin, the following products are published as part of this release:
- A supporting document providing further information on how the data is collected and processed, as well as information on the revisions policy and legislation relevant to civil justice.
- The quality statement published with this guide sets out our policies for producing quality statistical outputs for the information we provide to maintain our users’ understanding and trust.
- A set of tables providing statistics on the Business and Property Courts of England and Wales.
- A set of overview tables and CSV files, covering each section of this bulletin.
- A new JR data visualisation tool (to provide a more granular view of the JR data by department and case type). This can be found here.
10.3 Rounding convention
Figures greater than 10,000 are rounded to the nearest 1,000, those between 1,000 and 10,000 are rounded to the nearest 100 and those between 100 to 1,000 are rounded to the nearest 10. Less than 100 are given as the actual number.
10.4 National Statistics status
National Statistics status means that official statistics meet the highest standards of trustworthiness, quality and public value.
All official statistics should comply with all aspects of the Code of Practice for Official Statistics. They are awarded National Statistics status following an assessment by the Authority’s regulatory arm. The Authority considers whether the statistics meet the highest standards of Code compliance, including the value they add to public decisions and debate.
It is the Ministry of Justice’s responsibility to maintain compliance with the standards expected for National Statistics. If we become concerned about whether these statistics are still meeting the appropriate standards, we will discuss any concerns with the Authority promptly. National Statistics status can be removed at any point when the highest standards are not maintained, and reinstated when standards are restored.
10.5 Future publications
Our statisticians regularly review the content of publications. Development of new and improved statistical outputs is usually dependent on reallocating existing resources. As part of our continual review and prioritisation, we welcome user feedback on existing outputs including content, breadth, frequency and methodology. Please send any comments you have on this publication including suggestions for further developments or reductions in content.
10.6 Contacts
Press enquiries should be directed to the Ministry of Justice (MoJ) press office:
Sebastian Walters - email: sebastian.walters@justice.gov.uk
Other enquiries about these statistics should be directed to the Data and Evidence as a Service division of the Ministry of Justice:
Harjinder Singh - email: cajs@justice.gov.uk
Next update: 2 September 2021
-
https://www.gov.uk/government/news/priority-courts-to-make-sure-justice-is-served ↩
-
https://www.fca.org.uk/publications/finalised-guidance/personal-loans-coronavirus-temporary-guidance-firms ↩
-
The judicial review data are Official Statistics ↩
-
See footnote on the Royal Courts of Justice table 3.7 for the full list of other receipt applications. ↩
-
These figures represent only the days sat in court or in chambers in the following jurisdictions: Court of Appeal (Criminal and Civil), High Court (Chancery Division, Queen’s Bench Division, Family Division, Technology and Construction Court), Crown Court and County Court (including Family Law). Judges sit in other areas (including High Court hearings in regional County Courts) and also undertake a range of other functions outside the courtroom that are not included here. ↩
-
https://www.gov.uk/government/statistics/criminal-justice-system-statistics-quarterly-december-2020/criminal-justice-statistics-quarterly-december-2020-html ↩