Small area NCMP data: short interpretation guidance, March 2019
Updated 27 March 2019

© Crown copyright 2019
This publication is licensed under the terms of the Open Government Licence v3.0 except where otherwise stated. To view this licence, visit nationalarchives.gov.uk/doc/open-government-licence/version/3 or write to the Information Policy Team, The National Archives, Kew, London TW9 4DU, or email: psi@nationalarchives.gov.uk.
Where we have identified any third party copyright information you will need to obtain permission from the copyright holders concerned.
This publication is available at https://www.gov.uk/government/statistics/child-obesity-and-excess-weight-small-area-level-data/small-area-ncmp-data-short-interpretation-guidance-april-2018
This publication presents an update of child obesity and excess weight data at small area level to include the latest year, 2017 to 2018.
New National Child Measurement Programme (NCMP) data for child obesity and excess weight prevalence for children in Reception (aged 4 to 5 years) and Year 6 (aged 10 to 11 years) at sub-local authority level has been produced.
The latest NCMP data has been added to our series of Excel spreadsheets for middle super output areas (MSOAs), Electoral Wards and Clinical Commissioning Groups (CCGs), together with local authority and England figures for comparison. Data is presented by area of child residence, using rolling 3-year combined NCMP data to show small area trends from 2008 to 2009 up to 2017 to 2018.
The small area level data spreadsheets will assist planning and delivery of services for children, and the targeting of resources at a local level to help reduce the prevalence of excess weight and obesity.
Main findings
This update shows:
- there is variation in child obesity and excess weight prevalence at small area level throughout England
- children living in the most deprived areas are at the highest risk of obesity
Summary
This data publication is made up of a series of Excel spreadsheets, providing trend data on the prevalence of excess weight - overweight including obesity (from NCMP 2010 to 2011 up to 2017 to 2018) and obesity (from NCMP 2008 to 2009 up to 2017 to 2018). The data presented is based on area of child residence, for 2011 MSOAs, 2018 Electoral Wards, 2018 CCGs, 2013 local authorities and England.
To produce as robust an indicator as possible at small area level, the prevalence estimates use three years of NCMP data combined; the latest data is presented for 2015 to 2016 up to 2017 to 2018 combined. The comparator data provided at local authority and England level also uses three years of NCMP data combined.
Interpreting the data
Prevalence of child obesity and excess weight varies across England. Analysis of national[footnote 1] and local authority[footnote 2] data shows that children resident in the most deprived areas in England are at the highest risk of being overweight and obese.
In England 9.5% of children in Reception were obese in 2015 to 2016 up to 2017 to 2018, varying from 4.0% to 13.6% at local authority level. Among children in Year 6 in England 20.0% were obese in 2015 to 2016 up to 2017 to 2018, varying from 10.3% to 29.1% between local authorities. There is often considerable variation between neighbourhoods within each local authority.
This variation within local authorities can be examined using data for MSOAs and wards. The data published in these spreadsheets will help to identify pockets of high obesity and excess weight and enable changes in prevalence to be monitored over time. This may help to assist planning and delivery of services for children.
Figures 1 and 2 show examples of how the data can be examined to identify local patterns and trends in child obesity prevalence using the data at electoral ward level.
When interpreting small area level data it is important to consider the confidence intervals for the values as they show the level of uncertainty in the prevalence estimates.
In general, the greater the number of measurements used within any analysis, the more reliable the resulting statistics (for example the England and local authority figures). Analysis based on small samples (such as MSOA and Ward level) may be affected by small number variation, and therefore the prevalence figure may not provide a reliable estimate of the true value in the underlying population.
In Figure 1, Ward 1 has the highest prevalence value in the example local authority of 24.8%, but the 95% confidence intervals range from 21.4% to 28.4%, meaning we can be 95% certain that the true value is within this range. We can be confident that Year 6 obesity prevalence in Ward 1 is higher than the England value but can only say with some certainty it is higher than the prevalence in Wards 11, 12 and 13 as in these cases the confidence intervals do not overlap. Where the confidence intervals do overlap, as between Ward 1 and Wards 2 to 10, we cannot be confident that the prevalence in Ward 1 is higher than the prevalence in any of these wards.
Figure 1: An example of how to chart prevalence of obesity among Year 6 children (aged 10 to 11 years) by area of residence, NCMP 2015 to 2016 up to 2017 to 2018 with 95% confidence intervals
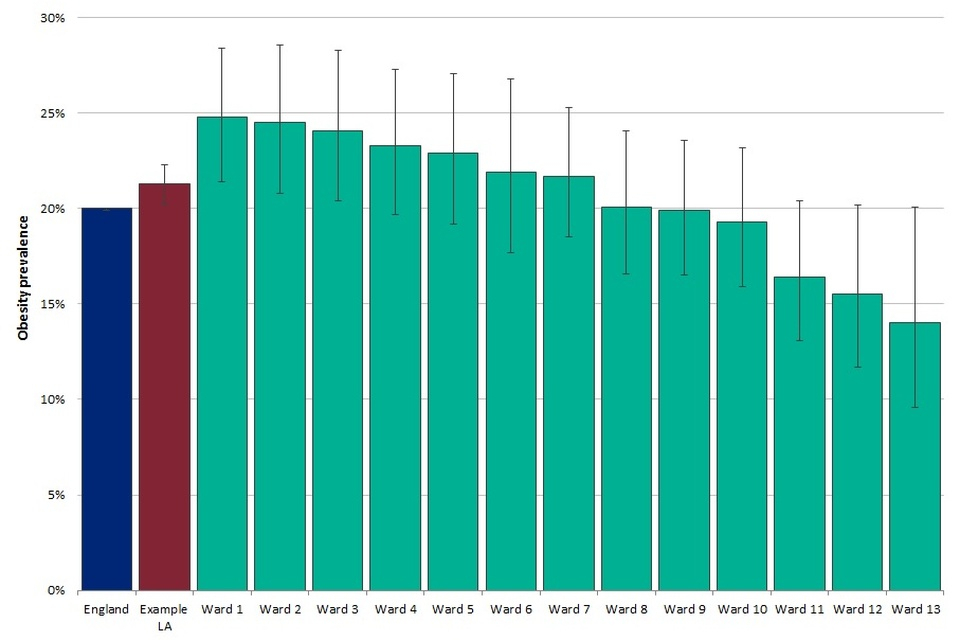
Bar chart showing prevalence of obesity among Year 6 children aged 10 to 11 years for an example local authority by area of residence. Using National Child Measurement Programme data for 2015 to 2016 up to 2017 to 2018, with 95% confidence intervals.
Figure 2 shows the trend in obesity prevalence among Year 6 children for an example ward, compared to the local authority and England values. Obesity prevalence in this ward has been consistently higher than both the England and local authority values. Prevalence appears to be showing a pattern of increase in this ward with small increases and decreases year to year.
Figure 2: An example of how to chart prevalence of obesity among Year 6 children (aged 10 to 11 years) by area of residence, NCMP 2008 to 2009 up to 2017 to 2018 with 95% upper and lower confidence intervals (UCI and LCI) around Ward data
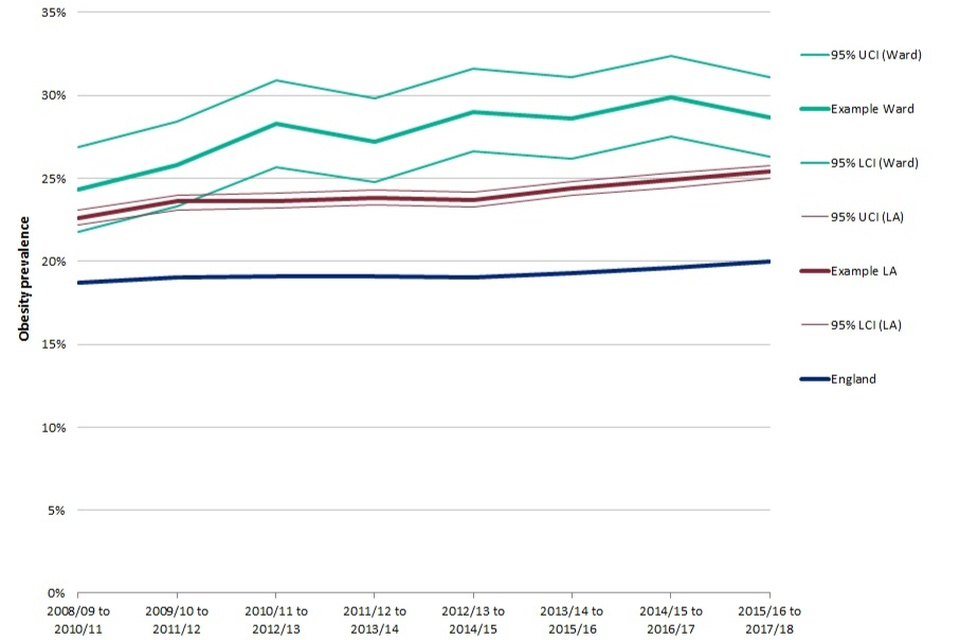
Line chart showing prevalence of obesity among Year 6 children aged 10 to 11 years for an example local authority by area of residence. Using National Child Measurement Programme data for 2008 to 2009 up to 2017 to 2018, with 95% confidence intervals.
Background
Further information about this publication and the data used:
- the NCMP annually measures the height and weight of over 1 million children in England and provides robust data on rates of child obesity and excess weight
- detailed metadata is available in each Excel spreadsheet
- data for 2018 Electoral Wards and 2018 CCGs of child residence is estimated from suppressed 2011 MSOA data - this is to avoid the potential disclosure of small numbers which could result if data for non-coterminous geographies was released
- in the 2006 to 2007 NCMP, 57.7% of records had a valid child postcode of residence; in 2007 to 2008 this figure had risen to 95.1%; in the NCMP, since 2008 to 2009, over 99% of child records have a valid postcode, providing sufficient coverage to produce reliable estimates at small area level
- children with a body mass index (BMI) greater than or equal to the 95th centile of the British 1990 growth reference (UK90) BMI distribution have been classified as obese
- children with a BMI greater than or equal to the 85th centile of the British 1990 growth reference (UK90) BMI distribution have been classified as overweight including obese (excess weight)
- these indicators can also be examined in the Public Health England (PHE) Local Health tool - the latest data may not be available in Local Health due to different publication dates
- the statistics were produced using the national analysis dataset provided to Public Health England by NHS Digital
Responsible statistician, product lead: Caroline Hancock
For queries relating to this document, please contact: ncmp@phe.gov.uk