Child and Working Tax Credits error and fraud statistics, tax year 2018 to 2019, final estimate
Published 15 April 2021

© Crown copyright 2021
This publication is licensed under the terms of the Open Government Licence v3.0 except where otherwise stated. To view this licence, visit nationalarchives.gov.uk/doc/open-government-licence/version/3 or write to the Information Policy Team, The National Archives, Kew, London TW9 4DU, or email: psi@nationalarchives.gov.uk.
Where we have identified any third party copyright information you will need to obtain permission from the copyright holders concerned.
This publication is available at https://www.gov.uk/government/statistics/child-and-working-tax-credits-error-and-fraud-statistics-2018-to-2019-final-estimate/child-and-working-tax-credits-error-and-fraud-statistics-tax-year-2018-to-2019-final-estimate
Key figures
Figure 1: tax credits error and fraud at a glance in tax year 2018 to 2019

Figure 1 shows that:
- tax credits error and fraud in favour of the claimant is estimated to be £1.1 billion
- this is 4.9% of total tax credits entitlement
Figure 2: tax credits error and fraud as a proportion of entitlement, tax year 2009 to 2010 to tax year 2018 to 2019

Figure 2 shows that:
- tax credits error and fraud in favour of the claimant has fallen from 5.5% of entitlement in the 2017 to 2018 tax year to 4.9% in the 2018 to 2019 tax year
- the claimant favour error and fraud rate has been below 5% for 5 of the last 6 years
Error and fraud rates since tax year 2006 to 2007 can be found in annex B.
Figure 3: tax credits error and fraud by risk category, tax year 2013 to 2014 to tax year 2018 to 2019
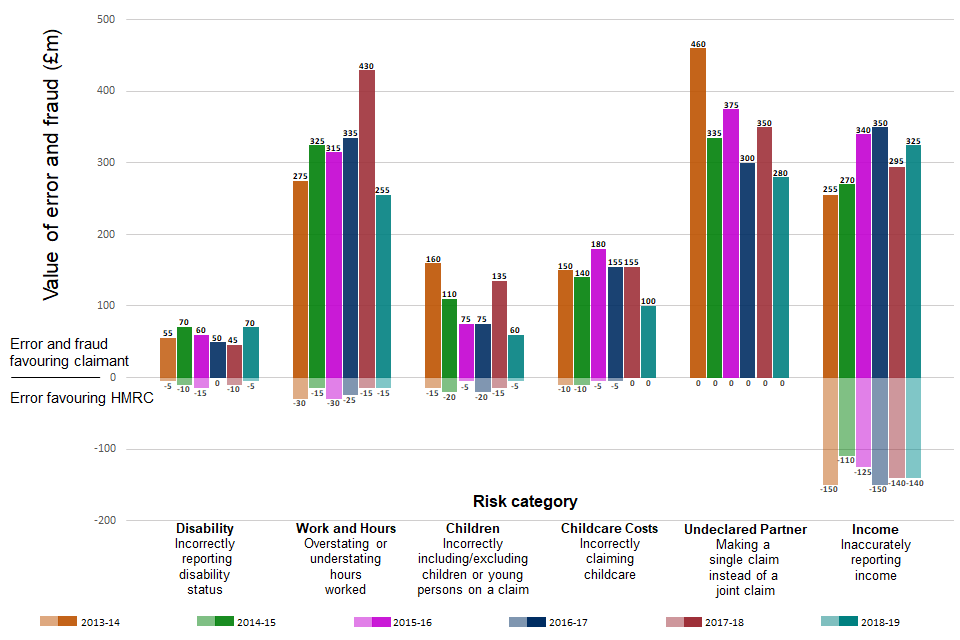
Figure 3 shows that:
- the Income risk group is the biggest reason for claimant favour tax credits error and fraud in tax year 2018 to 2019
- over the past 6 years, the biggest reasons for claimant favour tax credits error and fraud are the Income, Work and Hours, and Undeclared Partner risk groups
- the Income risk group is the biggest reason for HMRC favour error in tax year 2018 to 2019 and previous years
A detailed breakdown and description of the different risk groups is provided in section 2.
Estimates of error and fraud in tax credits for tax year 2018 to 2019
Section 1: estimated levels of error and fraud
This report presents results from the tax credits Error and Fraud Analytical Programme (EFAP), which is designed to measure error and fraud (E&F) in finalised awards across the tax credits population.
This publication will be of particular interest to the National Audit Office (as part of their overall review of HMRC’s accounts), academics and think-tanks and operationally within HMRC. Historical error and fraud estimates dating back to tax year 2006 to 2007 can be found in Annex B.
The details presented in the following tables are based on a sample of cases and hence there are margins of error associated with these estimates. Therefore, tables 1 to 4 also illustrate the 95 per cent confidence intervals associated with these central estimates. More details about the sampling methodology can be found in Annex A.
Estimates in the tables are rounded to the nearest £10 million or 10,000 in tables 2, 4, 5, and for all the overall totals in the other tables. The breakdowns in the other tables are rounded to the nearest £5 million or 5,000. The error and fraud rates are rounded to the nearest 0.1% in tables 1 and 3. Note that numbers in these tables may not sum to the totals due to rounding.
Error and fraud favouring the claimant refers to cases where the claimant has been found to be non-compliant in a way that has led HMRC to pay them more tax credits than they were entitled to for the year, in other words there was a monetary gain for the claimant and a monetary loss for HMRC.
Error and fraud favouring HMRC refers to cases where the claimant has been found to be non-compliant in a way that has led HMRC to pay them less tax credits than they were entitled to for the year, in other words there was a monetary gain for HMRC and a monetary loss for the claimant.
For tax year 2018 to 2019, the error and fraud rate has decreased compared to the previous year from 5.5% to 4.9%, as shown in table 1. This is mainly a result of a large decrease in error and fraud in the Work and Hours risk group, as well as decreases in the Childcare Costs and Children risk groups. There has also been a decrease in error and fraud in the Undeclared Partner risk group which may be partly due to HMRC providing additional information to customers to educate them on their responsibilities around declaring a partner.
Table 1.1: total error and fraud as a proportion of finalised entitlement (%), tax year 2017 to 2018
| Lower bound | Central estimate | Upper bound | |
|---|---|---|---|
| Estimated error and fraud favouring the claimant | 5.0% | 5.5% | 6.1% |
| Estimated error favouring HMRC | 0.6% | 0.7% | 0.8% |
Table 1.2: total error and fraud as a proportion of finalised entitlement (%), tax year 2018 to 2019
| Lower bound | Central estimate | Upper bound | |
|---|---|---|---|
| Estimated error and fraud favouring the claimant | 4.4% | 4.9% | 5.3% |
| Estimated error favouring HMRC | 0.6% | 0.7% | 0.9% |
Table 2 shows that:
- there were an estimated 700,000 tax credits claims containing error and fraud in the claimant’s favour in tax year 2018 to 2019
- the total value of this error and fraud is estimated at £1.1 billion
- there were an estimated 450,000 claims containing error favouring HMRC, with a total estimated value of £170 million
It is important to note that due to the introduction of Universal Credit, the total number and entitlement of tax credits awards is decreasing year-on-year, and comparisons of the absolute number of awards in error and fraud and absolute value of error and fraud to previous years should consider the decreasing size of the tax credits population.
Table 2.1: overall level of error and fraud, tax year 2018 to 2019 - numbers of instances
| Lower bound | Central estimate | Upper bound | |
|---|---|---|---|
| Estimated error and fraud favouring the claimant | 650,000 | 700,000 | 740,000 |
| Estimated error favouring HMRC | 420,000 | 450,000 | 490,000 |
Table 2.2: overall level of error and fraud, tax year 2018 to 2019 - amount
| Lower bound | Central estimate | Upper bound | |
|---|---|---|---|
| Estimated error and fraud favouring the claimant | £990m | £1,100m | £1,210m |
| Estimated error favouring HMRC | £140m | £170m | £200m |
When Claimant Compliance Officers find error and fraud in EFAP cases they assess whether they believe it was due to genuine error or fraud. To be classified as fraud, a caseworker needs to have found evidence that the claimant deliberately set out to misrepresent their circumstances to get money to which they are not entitled (for example claiming for a child that does not exist).
Error covers instances where there is no evidence of the claimant deliberately trying to deceive HMRC. It covers a range of situations, including cases where a claimant inadvertently over-claims because they simply provided HMRC with the wrong information. It could also cover a situation where the correct information has been provided but this information has been incorrectly processed by HMRC.
Tables 3 and 4 show that error makes up 85% of the total value of error and fraud in claimant favour, with the remaining 15% coming from fraudulent activity
Table 3: error and fraud favouring the claimant as a proportion of finalised entitlement (%), tax year 2018 to 2019, split out into separate error and fraud components
| Lower bound | Central estimate | Upper bound | |
|---|---|---|---|
| Estimated error favouring the claimant | 3.8% | 4.3% | 4.7% |
| Estimated fraud favouring the claimant | 0.4% | 0.6% | 0.8% |
| Total | 4.4% | 4.9% | 5.3% |
Table 4.1: level of error and fraud favouring the claimant, tax year 2018 to 2019, split out into separate error and fraud components - numbers of instances
| Lower bound | Central estimate | Upper bound | |
| Estimated error favouring the claimant | 620,000 | 660,000 | 710,000 |
|---|---|---|---|
| Estimated fraud favouring the claimant | 20,000 | 40,000 | 50,000 |
| Total | 650,000 | 700,000 | 740,000 |
Table 4.2: level of error and fraud favouring the claimant, tax year 2018 to 2019, split out into separate error and fraud components - amount
| Lower bound | Central estimate | Upper bound | |
| Estimated error favouring the claimant | £870m | £970m | £1,070m |
|---|---|---|---|
| Estimated fraud favouring the claimant | £80m | £130m | £180m |
| Total | £990m | £1,100m | £1,210m |
Error can be made by both the claimant and HMRC, and table 5 provides a breakdown into claimant error and HMRC error. It shows that the majority of errors are made by the claimant with a small proportion being made by HMRC. This is consistent with previous years.
Table 5: overall level of error split between claimant error and HMRC error - central estimates, tax year 2018 to 2019
| Claimant error | Claimant error | HMRC error | HMRC error | |
|---|---|---|---|---|
| Number | Amount | Number | Amount | |
| Estimated error favouring the claimant | 640,000 | £940m | 20,000 | £30m |
| Estimated error favouring HMRC | 420,000 | £150m | 30,000 | £20m |
Section 2: reasons for error and fraud
Error and fraud can enter the system due to a range of circumstances being incorrectly reported. At a high level there are 7 key risk categories. These are:
- Income – inaccurately reporting income
- Undeclared Partner – making a single claim instead of a joint claim
- Childcare Costs – incorrectly reporting childcare costs
- Children – incorrectly including or excluding children or young persons on a claim
- Work and Hours – overstating/understating hours worked
- Disability – incorrectly reporting disability status
- Other – risks that cannot be assigned to one of the other high level categories. This category includes residency and situations where a partner has been declared but is not present
The associated level of error and fraud for each of the risk categories can be found in tables 6 and 7. Note that some claimants will have more than one risk identified in their claim so the numbers will not sum to the total number of awards presented in the other tables.
Table 6 and Figure 4 show the total number of cases and amount of claimant favour error and fraud for each of the risk categories:
- most of the error and fraud favouring the claimant is due to the Income, Undeclared Partner and Work and Hours categories
- these risk groups have similar values of error and fraud; however, the Income risk has a larger number of awards in error and fraud
- the confidence intervals for the estimate of error and fraud for each risk group are shown in brackets after the value
Table 6: reasons for claimant favour error and fraud - central estimates, tax year 2017 to 2018 and tax year 2018 to 2019
| 2017 to 2018 | 2017 to 2018 | 2018 to 2019 | 2018 to 2019 | |
|---|---|---|---|---|
| Reason | Number | Amount | Number | Amount |
| Income | 320,000 | £290m (+/- 55) | 325,000 | £325m (+/- 55) |
| Undeclared Partner | 100,000 | £350m (+/- 85) | 85,000 | £280m (+/- 75) |
| Childcare Costs | 165,000 | £155m (+/- 30) | 125,000 | £100m (+/- 20) |
| Children | 70,000 | £135m (+/- 50) | 60,000 | £60m (+/- 20) |
| Work and Hours | 310,000 | £430m (+/- 65) | 205,000 | £255m (+/- 45) |
| Disability | 40,000 | £45m (+/- 25) | 45,000 | £70m (+/- 25) |
| Other | 0 | 0 | 5,000 | £10m (+/- 15) |
| Total | 1,000,000 | £1,410m | 850,000 | £1,100m |
Figure 4: value of claimant favour error and fraud (£ million) by risk category, with confidence intervals, tax year 2017 to 2018 and tax year 2018 to 2019
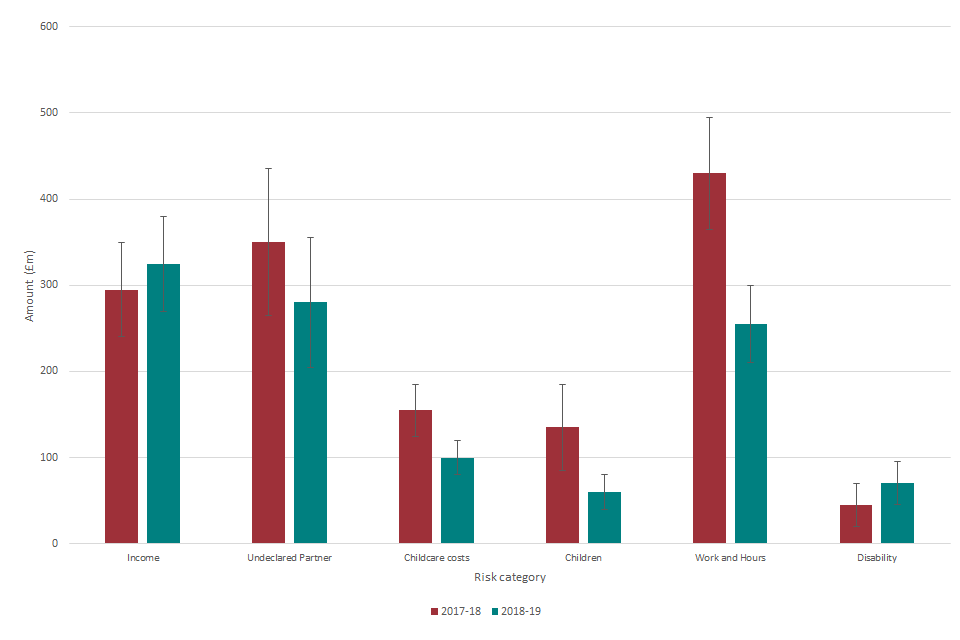
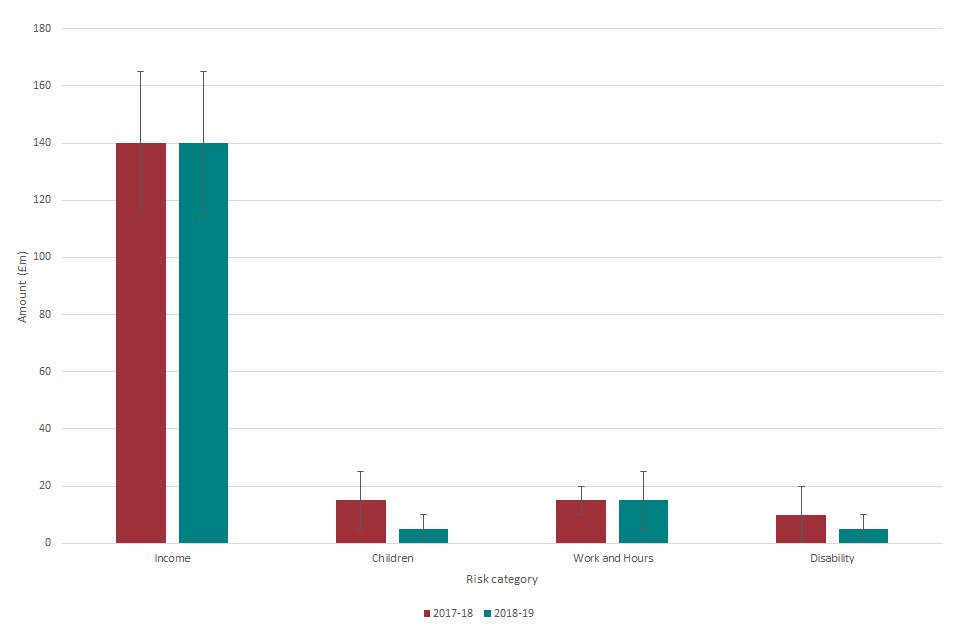
Table 7 and Figure 5 show that error favouring HMRC is mainly due to the Income risk category. The confidence intervals for the estimate of error and fraud for each risk group are shown in brackets after the value.
Table 7: reasons for HMRC favour error - central estimates, tax year 2017 to 2018 and tax year 2018 to 2019
| 2017 to 2018 | 2017 to 2018 | 2018 to 2019 | 2018 to 2019 | |
|---|---|---|---|---|
| Reason | Number | Amount | Number | Amount |
| Income | 470,000 | £140m (+/- 25) | 440,000 | £140m (+/- 25) |
| Undeclared Partner | 0 | 0 | 0 | 0 |
| Childcare Costs | 10,000 | 0 | 10,000 | 0 |
| Children | 15,000 | £15m (+/- 10) | 10,000 | £5m (+/- 5) |
| Work and Hours | 45,000 | £15m (+/- 5) | 40,000 | £15m (+/- 10) |
| Disability | 10,000 | £10m (+/- 10) | 5,000 | £5m (+/- 5) |
| Other | 0 | 0 | 0 | 0 |
| Total | 550,000 | £180m | 510,000 | £170m |
Figure 5: value of HMRC favour error (£ million) by risk category, with confidence intervals, tax year 2017 to 2018 and 2018 to 2019
Further information
Child Tax Credit (CTC) and Working Tax Credit (WTC) were introduced in April 2003. They are flexible systems of financial support designed to deliver support as and when a family needs it, tailored to their specific circumstances. They are part of wider government policy to provide support to parents returning to work, reduce child poverty and increase financial support for all families.
The flexible design of the system means that as families’ circumstances change, so does their (daily) entitlement to tax credits. This means tax credits can respond quickly to families’ changing circumstances, providing support to those that need it most.
Tax credits are based on household circumstances and can be claimed jointly by members of a couple, or by singles. Entitlement is based on the following factors: age, income, hours worked, number and age of children, childcare costs and disabilities.
The introduction of Universal Credit has meant that since 1 February 2019, new claims to tax credits are no longer accepted, except in a limited number of specific circumstances.
For further information on who can claim tax credits please refer to the GOV.UK website: https://www.gov.uk/topic/benefits-credits/tax-credits
For the 2018 to 2019 tax year, this exercise took a stratified random sample of 4,000 cases which were selected to be representative of the tax credit population. These cases were taken up for examination by claimant compliance officers who worked the cases as they would for any other enquiry. The sample is stratified because of the size and diversity of the claimant population and the possible variation in compliance risk. This is so that we can measure the level of compliance for various claimant groups, as well as for claimants as a whole. More details about the sampling methodology can be found in Annex A.
Original and revised estimates
The first estimates of the level of error and fraud for tax year 2018 to 2019 were published in September 2020, and estimated that the level of error and fraud favouring the claimant was around £1.11 billion or 4.9% of finalised tax credit entitlement.
The publication explained that as in all previous years, the estimates were based on incomplete data. In particular, some of the cases used in the estimation were still under investigation, and the compliance officer decisions that underpinned the error and fraud estimates were subject to appeal by households. Because of these factors HMRC revisits the estimates each year to take account of any new information received after the original publication and commits to re-publish the estimates when complete data on all sampled cases is available.
We have now revisited the tax year 2018 to 2019 estimates to take account of new information, and estimate that the level of error and fraud favouring the claimant now stands at £1.1 billion. Estimated error and fraud favouring HMRC is unchanged at £0.17 billion. The percentage point estimates are unchanged at 4.9% claimant favour error and fraud and 0.7% HMRC favour error.
The tax year 2018 to 2019 first estimate publication is available on GOV.UK: https://www.gov.uk/government/statistics/child-and-working-tax-credits-error-and-fraud-statistics-2018-to-2019-first-release