Benefit in kind statistics commentary September 2022
Published 29 September 2022

© Crown copyright 2022
This publication is licensed under the terms of the Open Government Licence v3.0 except where otherwise stated. To view this licence, visit nationalarchives.gov.uk/doc/open-government-licence/version/3 or write to the Information Policy Team, The National Archives, Kew, London TW9 4DU, or email: psi@nationalarchives.gov.uk.
Where we have identified any third party copyright information you will need to obtain permission from the copyright holders concerned.
This publication is available at https://www.gov.uk/government/statistics/benefits-in-kind-statistics-september-2022/benefit-in-kind-statistics-commentary-september-2022
1. About this release
This annual publication provides a breakdown of HMRC’s taxable benefits in kind statistics for company cars (and company car fuel).
In 2020 the scope of HMRC’s taxable benefits in kind statistics was restricted to company cars (and company car fuel) only. This decision was made because the increased uptake of payrolling had substantially reduced the completeness of the data on which statistics for other benefits were based.
A further table reports the total amount of Class 1A National Insurance paid on all benefits in kind (including company cars), and the corresponding value of those benefits.
Figures for tax year 2020 to 2021 are based on an early extract of electronically captured data on car benefits. Income Tax and NICs figures for that year are also based on projections of the Survey of Personal incomes (SPI) for tax year 2019 to 2020. These figures are provisional and subject to revision in future publications.
2. Main points
Key points for company car and fuel benefits in tax year 2020 to 2021 are:
-
the total number of reported recipients of company car benefit was 720,000 down from 800,000 in the previous year and continuing a steady decline from 960,000 in 2015 to 2016. The total taxable value of company car benefit was £4.62 billion in tax year 2020 to 2021 down from £5.43 billion in 2019 to 2020
-
the number of reported fuel benefit recipients was 60,000 down from 90,000 in 2019 to 2020, a more marked decline than for car benefit recipients. The total taxable value of fuel benefit declined from £0.47 billion in 2019 to 2020 to £0.32 billion in 2020 to 2021. This will have been affected by the Covid pandemic travel restrictions in 2020 and a shift towards electric powered cars
-
in tax year 2020 to 2021, only around 2% of company cars had reported CO2 emissions in excess of 165 g/km. By contrast in 2002 to 2003, 58% of company cars had reported emissions in excess of 165 g/km
-
the average reported CO2 emission of company cars including electric cars was 99 g/km, compared to 111 g/km in the previous tax year. For cars with internal combustion engines the average was 107 g/km
-
the proportion of company cars using diesel fuel reduced to 49% in 2020 to 2021. Diesel cars accounted for around 80% of company cars up to 2017 with a steady decline through to 60% by 2019 to 2020
-
the number of reported recipients of company cars with CO2 emissions of 75g/km or less was 137,000 (up from around 78,000 in the previous tax year). Fully electric cars account for 7% of car benefit recipients
-
the total taxable value of all Class 1A taxable benefits in kind was £8.9 billion, a decrease of £1.5 billion from the previous year
Comparisons over time are made more difficult by incompleteness arising from the introduction of voluntary payrolling in April 2016. Until April 2018 there was no requirement to report the details of voluntarily payrolled company cars. Reporting of these cars is now required but it appears there is still considerable underreporting, which may account for some of the reduction in company cars since tax year 2015 to 2016. This is explained more fully in section 8 of the accompanying background quality report.
Appropriate percentages (used to calculate tax liability for those in receipt of company cars) were increased by three percentage points for most cars in 2019 to 2020 but only increased slightly for non-electric cars in 2020 to 2021. Furthermore, the appropriate percentage rate for cars classified as being zero emission was reduced to 0% for the tax year 2020 to 2021. Further information on these policy changes.
3. What taxes are paid on company cars and car fuel benefit?
Directors of companies and employees are liable to pay Income Tax on the value of their company cars and car fuel benefits. Their employers (or in certain cases other third parties who provide benefits in kind) are liable to pay Class 1A NICs on these benefits. Other benefits may be subject to Class 1 NICs. The taxable value of a benefit depends on its type.
4. How are taxes collected for company cars and car fuel benefit?
Tax on benefits is usually collected via tax code adjustment notified by HMRC to the employer, based on P11D returns submitted after the end of the tax year.
From April 2016 the requirement to report certain benefits in kind on the P11D form was removed for those employers who register to deduct the tax due on those benefits in kind directly from payroll.
The introduction of voluntary payrolling affected the way in which company car data are reported, and this has impacts on the level of completeness of these statistics for different years.
From April 2017, employers who payroll company cars or car fuel benefits could voluntarily report details as part of their regular PAYE returns on RTI (Real Time Information).
From April 2018, company cars and car fuel are the only benefits for which it is mandatory for employers who have chosen to payroll to report detailed information as part of their regular PAYE returns on RTI.
In the 2020 publication the scope of HMRC’s taxable benefits in kind statistics was restricted to company cars (and company car fuel) only. This decision was made because the increased uptake of payrolling had substantially reduced the completeness of the data on which statistics for other benefits were based. Company cars (and car fuel) remain the focus of this year’s publication.
For a more detailed explanation of company cars and car fuel benefit and how the data sources are used, users are encouraged to read the background quality report that accompanies this release.
5. Company car benefit and company car fuel benefit
Figure 1 shows the number of recipients of car benefit and the total taxable value of company cars by year. Figure 2 shows the number of recipients of car fuel benefit and the total taxable value of company car fuel. The underlying data for these charts can be found alongside this publication.
Figure 1: Number of recipients and total taxable value of company cars (from April 2011)
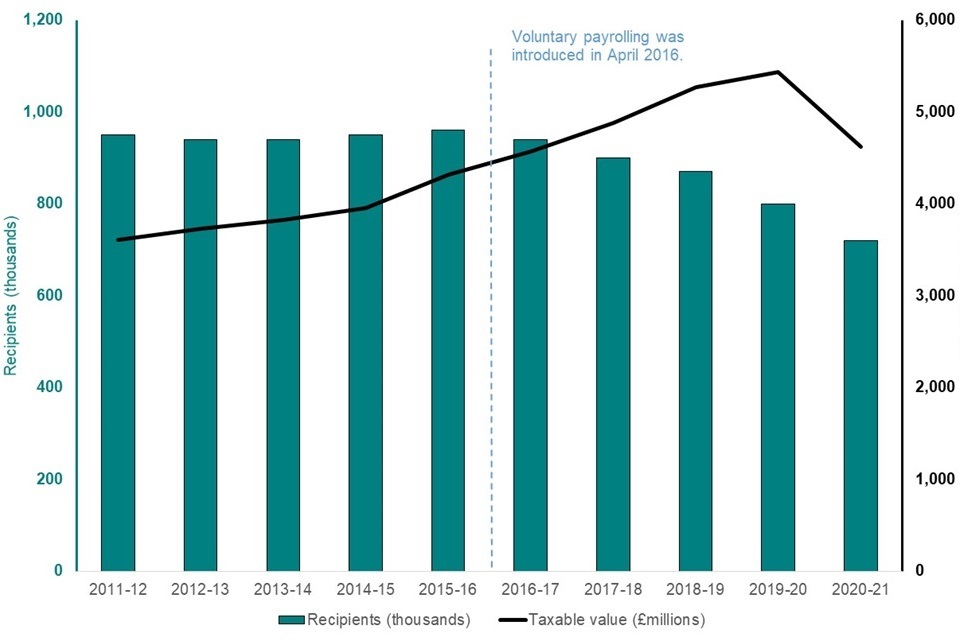
Figure 1 Number of recipients and total taxable value of company cars (from April 2011)
| Year | Recipients (thousands) | Taxable value (£millions) |
|---|---|---|
| 2011-12 | 950 | 3,610 |
| 2012-13 | 940 | 3,730 |
| 2013-14 | 940 | 3,820 |
| 2014-15 | 950 | 3,950 |
| 2015-16 | 960 | 4,320 |
| 2016-17 | 940 | 4,570 |
| 2017-18 | 900 | 4,880 |
| 2018-19 | 870 | 5,270 |
| 2019-20 | 800 | 5,430 |
| 2020-21 | 720 | 4,620 |
Figure 2: Number of recipients and taxable value of fuel benefit (since April 2011)
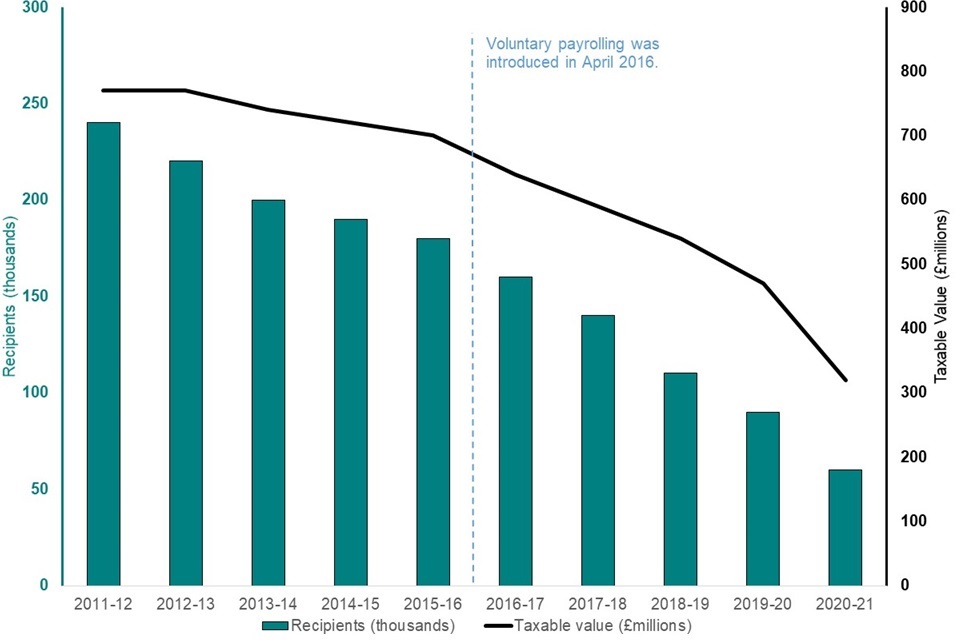
Figure 2 Number of recipients and taxable value of fuel benefit (since April 2011)
| Year | Recipients (thousands) | Taxable value (£millions) |
|---|---|---|
| 2011-12 | 240 | 770 |
| 2012-13 | 220 | 770 |
| 2013-14 | 200 | 740 |
| 2014-15 | 190 | 720 |
| 2015-16 | 180 | 700 |
| 2016-17 | 160 | 640 |
| 2017-18 | 140 | 590 |
| 2018-19 | 110 | 540 |
| 2019-20 | 90 | 470 |
| 2020-21 | 60 | 320 |
Tax year 2020 to 2021
Company car benefit was reported for 720,000 individuals in tax year 2020 to 2021 down from 800,000 in the previous year and continuing the steady decline in recent years. The total taxable value of company car benefit was £4.62 billion in 2020 to 2021, down from £5.43 billion in the preceding year. Total Income Tax and NIC liabilities arising from company car benefit were around £1.42 billion and £0.64 billion respectively.
The drop in the number of company car drivers in 2020 to 2021 is expected to have been exacerbated somewhat by the impacts of the COVID-19 pandemic, and associated reduction in economic activity.
60,000 individuals reporting company car benefit were also reported to be in receipt of car fuel benefit, falling from 90,000 in 2019 to 2020. This is about 8% of all car benefit recipients (down from 11%). This will have been affected by the Covid pandemic travel restrictions in 2020, as well as the increasing share of company cars powered exclusively by electricity.
The total taxable value of car fuel benefit has fallen steeply from £0.47 billion in 2019 to 2020 to £0.32 billion in 2020 to 2021. Total Income Tax and NIC liabilities for car fuel benefit were around £100 million and £40 million respectively.
The average taxable values for car benefit and car fuel benefit in 2020 to 2021 were £6,400 and £4,950 respectively down from £6,770 and £5,240 the year prior.
Longer term trends
Between tax year 2011 to 2012 and 2015 to 2016 the reported number of recipients of company car benefit remained relatively stable at just under one million. In more recent years it has steadily declined to the current level of 720,000 in 2020 to 2021. However, the reporting issues noted in the background quality report mean that there is likely to be a substantial number of individuals in these years who received company car benefit that (while taxed at payroll) was not properly reported to HMRC. The appropriate tax was collected but car benefit not recorded.
Over the period from tax year 2011 to 2012 to tax year 2019 to 2020 the total taxable value of reported company cars increased significantly from £3.61 billion to £5.43 billion but has now fallen to £4.62 billion in 2020 to 2021. The increase to 2019 to 2020 was primarily due to increases in the ‘appropriate percentages’ used to calculate the taxable value of a company car, and to a lesser extent increases in the average car list price. These offset the falling number of company car drivers. By contrast, in 2020 to 2021 the total taxable value decreased. This was driven by a reduction in the number of company cars and a shift towards electric powered cars. Company car popularity will have been impacted by the Covid pandemic travel restrictions. The ‘appropriate percentages’ only increased slightly for non-electric vehicles and there was only a modest increase in the average list price for non-electric vehicles.
There has been a long-term downward trend in both the number of recipients and the total taxable value of car fuel from 240,000 recipients (taxable value £770 million) in tax year 2011 to 2012 to 60,000 recipients (taxable value £320 million) in 2020 to 2021.
This trend is likely to reflect rising fuel prices during most of this period, causing employers and employees to look more carefully at whether the fuel benefit formula results in a tax charge commensurate with the perceived value of the benefit. Although average fuel costs were around 10% lower in 2020 to 2021, there were significant travel restrictions at various times due to the Covid pandemic which may have driven some taxpayers to relinquish car fuel from their employer. The rise in electric vehicles means fewer company cars used car fuel in 2020 to 2021 compared to earlier years.
6. Company cars by CO2 emissions and fuel type
The current system of company car taxation, in which the taxable benefit of a company car is calculated with reference to the car’s reported CO2 emissions, was introduced in April 2002.
In the intervening 20 years the population of company cars has become significantly more efficient with much reduced CO2 emissions for distance travelled.
In tax year 2002 to 2003, 58% of company cars had reported emissions in excess of 165 g/km. In tax year 2020 to 2021, only around 2% of company cars had reported CO2 emissions in excess of 165 g/km due to fossil fuel cars becoming more efficient and an increasing share of company cars powered exclusively by electricity.
The number of reported recipients of company cars with CO2 emissions of 75g/km or less was 137,000, up from around 78,000 in the previous tax year. This includes fully electric cars.
Figure 3 shows the number of recipients of car benefit by CO2 emission band. The underlying data for this chart can be found alongside this publication.
Figure 3: Recipients of car benefit by emission range (tax year 2011 to 2012 and tax year 2020 to 2021)
| Reported CO2 emissions (g/km) | 2011-12 | 2020-21 |
|---|---|---|
| Zero | 0 | 52 |
| 1 to 50 | 0 | 74 |
| 51 to 74 | 0 | 11 |
| 75 to 94 | 13 | 60 |
| 95 to 104 | 31 | 99 |
| 105 to 114 | 80 | 159 |
| 115 to 124 | 159 | 118 |
| 125 to 134 | 120 | 71 |
| 135 to 144 | 167 | 35 |
| 145 to 154 | 153 | 18 |
| 155 to164 | 100 | 10 |
| 165 and over | 126 | 15 |
The number of recipients of cars with emissions of 115 g/km and above has decreased substantially. In 2011 to 2012 only 13% of company cars had emissions of less than 115 g/km. In 2020 to 2021 this was 63%.
In tax year 2020 to 2021 the proportion of cars that were zero emission (fully electric vehicles or “EV”) cars rose to 7% or 52,000.
WLTP and RDE2
The way that a vehicle’s CO2 are measured changed between 2018 and 2020 with the introduction of the Worldwide Harmonised Light Vehicle Test Procedure (WLTP) which replaced the old NEDC (New European Driving Cycle test). From April 2020 all new cars should be using the WLTP CO2 measurement for tax calculations. As WLTP typically gives higher emission rates, most appropriate percentages have been reduced by two percentage points compared to the current percentage for cars with emissions measured under NEDC to help support its introduction.
Figure 4 shows the average reported CO2 emission of company cars by year. The underlying data for this chart can be found alongside this publication.
Figure 4: Average (reported) CO2 emissions of company cars since April 2011
| Year | CO2 emissions g/km |
|---|---|
| 2011-12 | 140 |
| 2012-13 | 133 |
| 2013-14 | 127 |
| 2014-15 | 121 |
| 2015-16 | 117 |
| 2016-17 | 113 |
| 2017-18 | 111 |
| 2018-19 | 110 |
| 2019-20 | 111 |
| 2020-21 | 99 |
There has been a significant shift in the proportion of diesel company cars. Diesel cars accounted for around 80% of company cars up to 2017 with a steady decline through to 60% by 2019 to 2020. The proportion of company cars using diesel fuel reduced to 49% (355,000) in 2020 to 2021, 7% (52,000) of company cars were fully electric.
Between April 2010 and April 2015 electric cars (with CO2 emissions of 0 g/km) were not liable to company car tax. Accordingly, these statistics only include electric cars from tax year 2015 to 2016, however as stated above their numbers were very small until 2020 to 2021. One effect of the increase in electric cars is that they have helped reduce the average CO2 emission rate of company cars to 99 g/km. Even after excluding electric cars from the average, the average CO2 emission rate has reduced to 107 g/km confirming a trend towards lower emission fossil fuel cars.
The number of Ultra-Low Emission Vehicles (ULEVS), with CO2 emissions no greater than 75 g/km (but not zero emission), have also been increased steadily in recent years from 5,000 in tax year 2014 to 2015 to 85,000 in 2020 to 2021.
7. Company cars and employer-provided fuel by range of total income
Figure 5 shows the average taxable value of company car and car fuel benefit by income band for tax year 2020 to 2021. The underlying data for this chart can be found alongside this publication.
Figure 5: Average taxable value of company car and fuel benefit by range of total income (tax year 2020 to 2021)
| Income Band | Taxable value of Car benefit (£) | Taxable value of Fuel Benefit (£) |
|---|---|---|
| £0 - £8,499 | 3,260 | 1,380 |
| £8,500 - £14,999 | 4,310 | 2,790 |
| £15,000 - £19,999 | 3,260 | 3,300 |
| £20,000 - £29,999 | 4,220 | 4,110 |
| £30,000 - £39,999 | 5,110 | 3,930 |
| £40,000 - £49,999 | 5,980 | 4,670 |
| £50,000 - £74,999 | 7,150 | 5,390 |
| £75,000 - £99,999 | 8,070 | 5,000 |
| £100,000 - £149,999 | 9,140 | 5,000 |
| £150,000 - £199,999 | 10,320 | 4,920 |
| £200,000 and over | 15,630 | 5,680 |
Above an income of £14,999 the average (taxable) value of company car benefit increases with total income. This is generally the same for fuel benefit recipients earning less than £75,000. Above £75,000 earnings the taxable value of fuel levels off. Individuals who received company car fuel benefit (60,000) are a small proportion of the 720,000 who benefit from a company car.
Note that the taxable value of a company car is determined by a calculation involving the car’s list price and CO2 emissions (among other factors), and this will therefore not solely reflect the value of the car as perceived by the recipient.
8. The impact of “voluntary payrolling” on these statistics
As noted previously, the term ‘payrolling’ refers to the situation in which an employer calculates and deducts tax on employee benefits in kind through their payroll. In recent years the increased uptake of payrolling has had an impact on the completeness of the data on which these statistics are based.
8.1 Informal Payrolling
Before April 2016 a small number of employers were permitted to operate informal payrolling systems for taxable benefits in kind. These employers were still legally obliged to return P11Ds at the end of the tax year, but these P11Ds were not electronically processed and therefore are not included in these statistics.
Voluntary payrolling
From April 2016 the requirement to report certain benefits in kind on the P11D form has been removed for those employers who register to deduct the tax due on those benefits in kind directly from payroll. A system was set up for employers who voluntarily payroll company cars to report these cars in their regular PAYE returns on RTI, but this was not compulsory until April 2018.
-
Tax year 2016 to 2017: RTI reporting of company cars not possible
-
Tax year 2017 to 2018: RTI reporting of company cars on a voluntary basis
-
Tax year 2018 to 2019 and later: RTI reporting of company cars compulsory
The statistics in these tables therefore omit all cars which were voluntarily payrolled in tax year 2016 to 2017, as well as some cars that were voluntarily payrolled in tax year 2017 to 2018 (those which the employers chose not to report).
From April 2018 onward all voluntarily payrolled company cars should have been reported to HMRC. However, there is evidence that compliance with the new reporting system is not complete.
The issue of incompleteness means that it is difficult to draw definitive conclusions from these statistics about the trend in the number of company cars in recent years. The number of company cars reported to HMRC has fallen from 960,000 in tax year 2015 to 2016 (the final year before the introduction of voluntary payrolling) to 720,000 in tax year 2020 to 2021. But there is internal evidence to suggest that a substantial number of company car benefits were not correctly reported to HMRC in recent tax years, which suggests that the 720,000 figure underestimates the true number of company car recipients.
This evidence includes both identifying PAYE schemes which registered to payroll company car benefits and yet did not report any company cars through RTI, and observing unusual trends in the number of company cars reported by PAYE schemes which do not seem likely to reflect real changes in the provision of company cars to employees. It is not possible to precisely quantify the impact of payrolling on the figures provided, but users of these statistics should be aware that this “reporting gap” is likely to have exaggerated the observed trend in the number of company car recipients in years since April 2016.
9. Other (Class 1A) taxable benefits in kind
Figure 6 shows the taxable value of Class 1A benefits in kind since April 2015. The underlying data for this chart can be found alongside this publication.
Figure 6: Total taxable value of Class 1A benefits in kind (since April 2015)
| Year | All Class 1A Benefits (£000’s) |
|---|---|
| 2015-16 | 8,600 |
| 2016-17 | 9,100 |
| 2017-18 | 9,400 |
| 2018-19 | 9,900 |
| 2019-20 | 10,400 |
| 2020-21 | 8,900 |
As noted in the background quality report, changes to the way that taxable benefits in kind are calculated – in particular, the increased uptake of payrolling – mean that it is no longer possible for HMRC to publish detailed statistics on the majority of taxable benefits in kind. Therefore, since September 2020, the focus of this publication shifted to company cars (and company car fuel) only.
In response to a user engagement exercise the publication includes a table showing the total value of taxable benefits in kind.
The value of Class 1A taxable benefits in kind has increased steadily year-on-year to £10.4 billion in 2019 to 2020. The total value of Class 1A taxable benefits in kind decreased in tax year 2020 to 2021 to £8.90 billion, meaning that the (taxable) value of company cars (£4.62 billion) is projected to be about half the total (taxable) value of all such benefits.
10. Car Benefit Recipients by Region
Figure 7 is a map showing the number of car benefit recipients in each region or country of the UK for tax year 2020 to 2021. The underlying data for this chart can be found alongside this publication.
Figure 7: Number of car benefit recipients by region
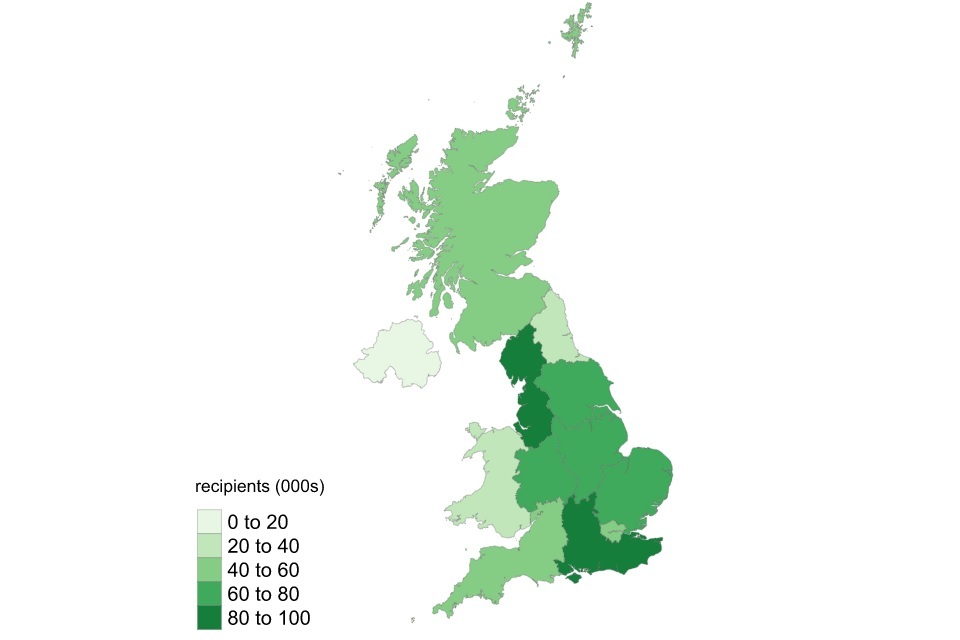
Figure 7 Number of car benefit recipients by region
The South East of England has the highest number of car benefit recipients at 95,000 with a taxable value of £680 million.
11. User engagement exercise
In 2020 HMRC carried out a user engagement exercise to better understand how the removal of non-car benefits in kind affected users of these statistics and to seek their view on the changes being considered to the way these statistics are presented.
HMRC’s response to that user engagement exercise can be found here.
Last year’s publication implemented some of the changes discussed in the user engagement exercise. Although the user engagement exercise is now closed, users of the statistics who wish to share their views about these changes can do so by contacting personaltax.statistics@hmrc.gov.uk.