Statistical commentary September 2020
Published 30 September 2020

© Crown copyright 2020
This publication is licensed under the terms of the Open Government Licence v3.0 except where otherwise stated. To view this licence, visit nationalarchives.gov.uk/doc/open-government-licence/version/3 or write to the Information Policy Team, The National Archives, Kew, London TW9 4DU, or email: psi@nationalarchives.gov.uk.
Where we have identified any third party copyright information you will need to obtain permission from the copyright holders concerned.
This publication is available at https://www.gov.uk/government/statistics/benefits-in-kind-statistics-september-2020/statistical-commentary-september-2020
1. Summary
Key outturns for company car and fuel benefits in kind in 2017 to 2018 are:
-
the total number of reported recipients of company car benefit was 900,000 (down from 940,000 in 2016 to 2017) and the total value of company car benefit was £4.88 billion (increased from £4.57 billion in 2016 to 2017)
-
the total number of reported recipients of fuel benefit was 140,000 (down from 160,000 in 2016 to 2017) and the total value of fuel benefit was £0.59 billion (a reduction from £0.64 billion in 2016 to 2017)
-
98% of company cars in 2017 to 2018 reported emissions of less than 165 g/km. This group contributed 93% of tax and 94% of NIC liability
-
75% of company cars used diesel fuel (down from 79% in 2016 to 2017) with about 25% using other fuel types, predominantly petrol
-
around 47,000 company cars reported CO2 emissions of 75 g/km or lower in 2017 to 2018. This has increased from 29,000 in 2016 to 2017
-
these figures are based on electronically captured P11D returns for all years and, for 2017 to 2018 only, voluntarily payrolled cars reported on Real Time Information as part of PAYE submissions
-
comparisons over time are made difficult by incompleteness arising from the introduction of voluntary payrolling in April 2016. For two years (2016 to 2017 and 2017 to 2018) there was no requirement to report voluntarily payrolled cars. Reporting is now required, but there is still under-reporting, and initial analysis suggests this may account for a large part of the reduction in cars since 2015 to 2016
2. Detailed statistics
This section provides detailed commentary and statistics on company cars.
Impact of payrolling on the statistics
The introduction of voluntary payrolling from April 2016 affected the way in which company car data are reported, and this has impacts on the level of completeness of these statistics for different years.
The term “payrolling” refers to the situation in which an employer calculates and deducts tax on employee benefits in kind through their payroll. This contrasts with the standard situation in which the tax on benefits in kind is collected via tax code adjustments notified by HMRC to the employer, based on P11D returns submitted.
Informal payrolling
Before April 2016, a small number of employers were permitted to operate informal payrolling systems for taxable benefits in kind. These employers were still legally obliged to return P11Ds at the end of the tax year, but these P11Ds were not electronically processed and therefore not included in these statistics.
Voluntary payrolling
From April 2016 the requirement to report certain benefits in kind on the P11D form has been removed for those employers who register to deduct the tax due on those benefits in kind directly from payroll. A system was set up for employers who voluntarily payroll company cars to report the cars in their regular PAYE returns on RTI, but this was not compulsory until April 2018:
-
tax year 2016 to 2017: RTI reporting of company cars not possible
-
tax year 2017 to 2018: RTI reporting of company cars on a voluntary basis
-
tax year 2018 to 2019 and later: RTI reporting of company cars compulsory
The statistics in these tables therefore omit all cars which were voluntarily payrolled in 2016 to 2017, and some cars which were voluntarily payrolled in 2017 to 2018 (those which the employer chose not to report).
From year 2018 to 2019, all voluntarily payrolled company cars should have been reported to HMRC, but there is evidence that compliance with the new reporting system is not yet complete.
This issue of incompleteness means that it is difficult to draw conclusions from these statistics about the trend in the number of company cars in recent years. This particularly affects the time series shown in Table 4.5. More information on incompleteness can be found in the background documentation.
2.1 Company car benefit and company car fuel benefit
Table 4.1 Company car benefit and company car fuel benefit: recipients, taxable value and income Tax and NICs liability, 2017-18
| Category | Recipients | Taxable value | Tax liability | NICs liability | |||
|---|---|---|---|---|---|---|---|
| Number (thousands) | Amount (£ millions) | Average (£) | Amount (£ millions) | Average (£) | Amount (£ millions) | Average (£) | |
| Car | 900 | 4,880 | 5,390 | 1,620 | 1,790 | 670 | 740 |
| Car fuel | 140 | 590 | 4,270 | 200 | 1,460 | 80 | 590 |
| Total | 900 | 5,470 | 6,040 | 1,830 | 2,020 | 750 | 830 |
- The total number of recipients is the number of people receiving either a taxable company car or taxable company car fuel (or both). This means that this total number is not the sum of the two individual components.
- Numbers and amounts less than 10 are rounded to the nearest 5; those greater than 10 are rounded to the nearest 10.
- The column totals may not equal the sum of individual components due to rounding.
- The data in this table are not fully complete. Some company cars are not included in the source data used to produce the statistics and are therefore excluded from the tables. For more information please see the background documentation.
In total, company car benefit was reported for around 900,000 individuals in respect of 2017 to 2018. The total value of company car benefit was £4.88 billion. Total tax and NIC liabilities were around £1.62 billion and £670 million respectively.
140,000 individuals were also reported to be in receipt of car fuel benefit, equating to 15% of all car benefit recipients. The total taxable value of car fuel benefit was £592 million. Total tax and NIC liabilities for car fuel benefit were around £200 million and £80 million respectively.
The average taxable values for car and car fuel benefit were £5,390 and £200 respectively.
2.2 Removal of Table 4.2
We will no longer be publishing statistics on total benefits in kind for directors and employees by total income.
2.3 Company cars and employer-provided fuel, by range of total income
Table 4.3 Analysis of company cars and employer-provided fuel, by range of total income, 2017 to 2018
| Total income (lower limit) | Car | Car fuel | ||
|---|---|---|---|---|
| £ | Recipients (thousands) | Taxable value (£ millions) | Recipients (thousands) | Taxable value (£ millions) |
| 0 | 10 | 20 | - | - |
| 8,500 | 10 | 30 | - | - |
| 15,000 | 20 | 60 | - | 5 |
| 20,000 | 90 | 290 | 5 | 20 |
| 30,000 | 160 | 640 | 20 | 50 |
| 40,000 | 180 | 880 | 30 | 120 |
| 50,000 | 250 | 1,480 | 40 | 200 |
| 75,000 | 90 | 650 | 20 | 80 |
| 100,000 | 50 | 420 | 10 | 60 |
| 150,000 | 20 | 150 | 5 | 20 |
| 200,000 | 20 | 250 | 5 | 40 |
| Total | 900 | 4,880 | 140 | 590 |
-
Numbers and amounts less than 10 are rounded to the nearest 5; those greater than 10 are rounded to the nearest 10. Numbers rounded down to zero are indicated by ‘-‘.
-
The figures in this table are grossed up from the sample which contains income information. The grossing methodology ensures that figures reflect the correct total taxable value but the total number of recipients will not necessarily match the figure in Table 4.1.
-
The column totals may not equal the sum of individual components due to rounding.
-
Total income is inclusive of the benefit in kind amount
-
The data in this table are not fully complete. Some company cars are not included in the source data used to produce the statistics and are therefore excluded from the tables. For more information please see the background documentation.
In 2017 to 2018, the number of reported recipients of company car benefit was 900,000. Collectively these individuals received £4.88 billion of taxable value in company car benefit. There were 140,000 individuals who received car fuel benefit (with a total taxable value of £590 million).
As shown in Figure 1 below, above an income of £8,500, the average value of company car benefit increases with total income.
Figure 1: Average value of company car benefit by total income
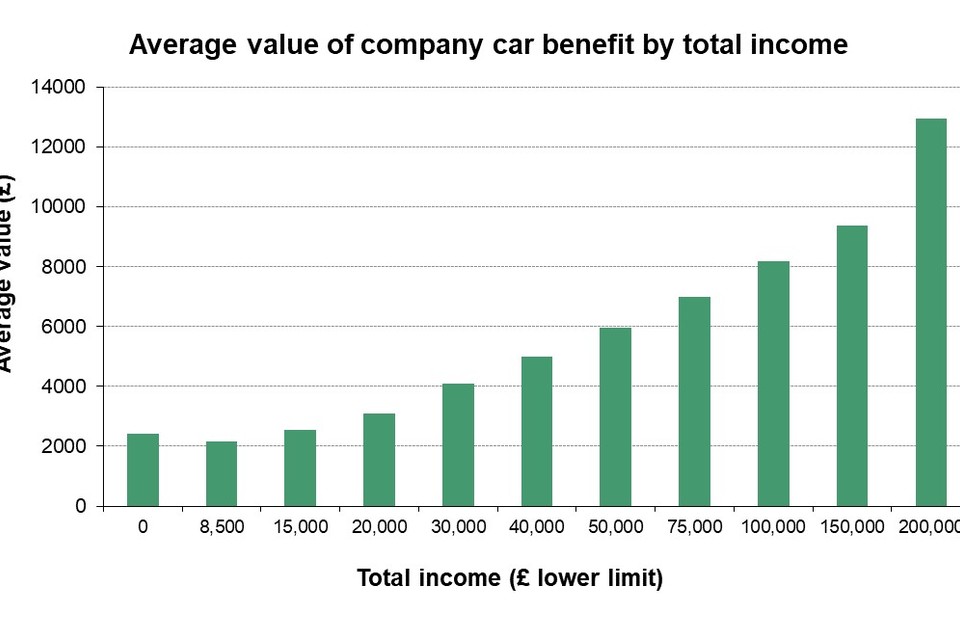
Figure 1: Average value of company car benefit by total income
2.4 Company cars by CO2 emissions and fuel type
Table 4.4 Analysis of company cars by CO2 emissions and fuel type, 2017 to 2018
| Category | Recipients | CO2 emissions | Taxable value | Tax liability | NIC liability | |||||
|---|---|---|---|---|---|---|---|---|---|---|
| Number (thousands) | % of total | Average (g/km) | Amount (£ millions) | % of total | Amount (£ millions) | % of total | Amount (£ millions) | % of total | ||
| CO2 emissions | Zero | 1 | - | 0 | 20 | 1% | 10 | 1% | 5 | 1% |
| (g/km) | 1 - 50 | 44 | 5% | 43 | 150 | 3% | 60 | 3% | 20 | 3% |
| 51 - 75 | 1 | - | 63 | 5 | - | 5 | - | 0 | - | |
| 76 - 94 | 90 | 10% | 89 | 320 | 7% | 90 | 6% | 40 | 7% | |
| 95 - 104 | 224 | 25% | 100 | 890 | 18% | 260 | 16% | 120 | 18% | |
| 105 - 114 | 232 | 26% | 109 | 1,220 | 25% | 400 | 25% | 170 | 25% | |
| 115 - 124 | 152 | 17% | 119 | 900 | 18% | 300 | 19% | 120 | 18% | |
| 125 - 134 | 71 | 8% | 129 | 470 | 10% | 160 | 10% | 70 | 10% | |
| 135 - 144 | 42 | 5% | 139 | 320 | 6% | 110 | 7% | 40 | 6% | |
| 145 - 154 | 20 | 2% | 149 | 180 | 4% | 70 | 4% | 20 | 4% | |
| 155 - 164 | 12 | 1% | 159 | 130 | 3% | 50 | 3% | 20 | 3% | |
| 165 - 174 | 5 | 1% | 170 | 60 | 1% | 20 | 1% | 10 | 1% | |
| 175 - 184 | 3 | - | 179 | 40 | 1% | 20 | 1% | 5 | 1% | |
| 185 - 194 | 3 | - | 188 | 50 | 1% | 20 | 1% | 5 | 1% | |
| 195 - 204 | 2 | - | 199 | 30 | 1% | 10 | 1% | 5 | 1% | |
| 205 - 224 | 2 | - | 214 | 30 | 1% | 10 | 1% | 5 | 1% | |
| 225 and over | 3 | - | 259 | 50 | 1% | 20 | 1% | 5 | 1% | |
| Type of fuel | Diesel | 680 | 75% | 112 | 3,920 | 80% | 1,290 | 79% | 540 | 80% |
| Non-diesel | 220 | 25% | 106 | 960 | 20% | 330 | 21% | 130 | 20% | |
| All | 910 | 111 | 4,880 | 1620 | 670 |
- The number of recipients shown within each CO2 emissions band are rounded to the nearest thousand. Average CO2 emissions (in g/km) are rounded to the nearest whole number. All other numbers and amounts less than 10 are rounded to the nearest 5, while numbers and amounts greater than 10 are rounded to the nearest 10.
- The column totals may not equal the sum of individual components due to rounding.
- Where an individual had a company car for only part of the year, the taxable value and tax and NIC liability figures shown in the table are the part-year values. However in the recipients column the individual contributes a full unit value.
- Where an individual had company cars in different emission ranges during the year, the unit value in the recipients column is split between the emission ranges proportionately to the durations in possession of the different cars.
- The Non-diesel category of fuel captures petrol, electric, conversion, hybrid, bio-fuel and bio-ethanol cars.
- The data in this table are not fully complete. Some company cars are not included in the source data used to produce the statistics and are therefore excluded from the tables. For more information please see the background documentation.
98% reported company cars in respect of 2017 to 2018 had emissions of less than 165 g/km of CO2; this has not changed since 2016 to 2017. This group contributes 93% of tax and 94% of NIC liability.
There is an established strong reducing trend in the level of emissions. In 2002 to 2003 58% of company cars reported emissions in excess of 165 g/km; in 2017 to 2018 this had reduced to just 2%. The emission-dependent scale of appropriate percentages for company cars is one of many factors incentivising the manufacture and purchase of low emission vehicles.
There has been a steady increase in diesel company cars over the last 20 years, in 2002 to 2003 only 33% of company cars used diesel. In 2017 to 2018, about 75% of company cars used diesel fuel with about 25% using other fuel types, predominantly petrol, in 2017 to 2018. However, this has decreased from 79% in 2016 to 2017.
Figure 2: Numbers of recipients of car benefits by emission range
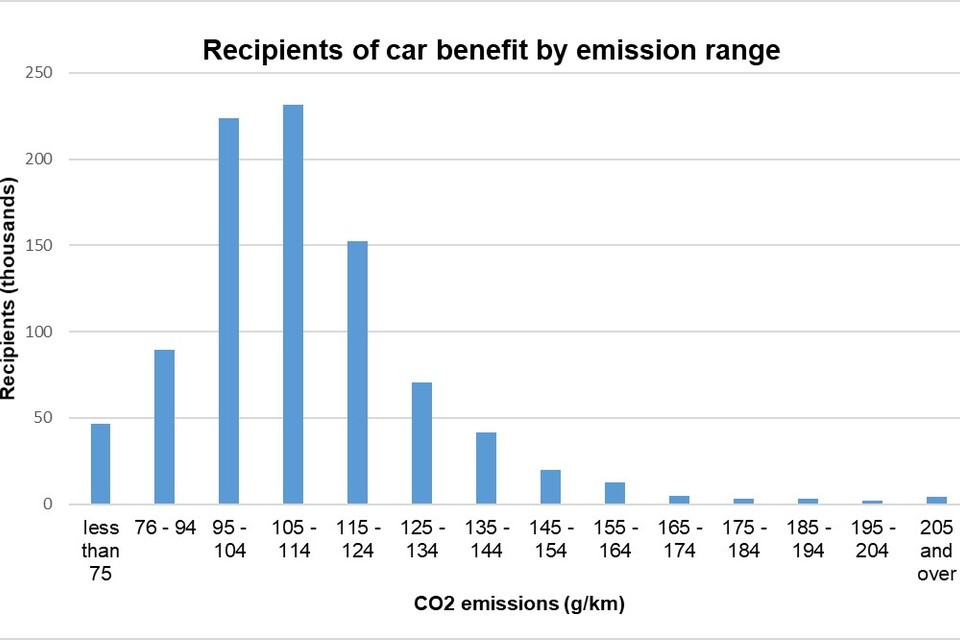
Figure 2: Numbers of recipients of car benefits by emission range
Since April 2015 electric cars (with CO2 emissions of 0 g/km) are liable to company car tax. Therefore, this table includes electric cars. Around 1,000 individuals reported company cars with zero emissions in 2017 to 2018. This has decreased from around 2,000 in 2016 to 2017. Provisional results indicate that the number of employees with electric cars increased substantially in 2018 to 2019.
Numbers of ULEVs (with CO2 emissions of less than or equal to 75 g/km) have been increasing in recent years. Around 47,000 individuals were reported to be using company cars with CO2 emissions of 75 g/km or lower in 2017 to 2018. This has increased from 29,000 in 2016 to 2017.
2.5 Comparisons over time
Table 4.5 Company car benefit and company car fuel benefit: Recipients, taxable value and Income Tax and NICs liability, 2010 to 2011 to 2018 to 2019 (experimental figures for 2017 to 2018 and provisional experimental figures for 2018 to 2019)
| Recipients (thousands) | 2010 to 2011 | 2011 to 2012 | 2012 to 2013 | 2013 to 2014 | 2014 to 2015 | 2015 to 2016 | 2016 to 2017 | 2017 to 2018 | 2018 to 2019 |
|---|---|---|---|---|---|---|---|---|---|
| Car | 950 | 950 | 940 | 940 | 950 | 960 | 940 | 900 | 870 |
| Car fuel | 250 | 240 | 220 | 200 | 190 | 180 | 160 | 140 | 110 |
| Total | 950 | 950 | 940 | 940 | 950 | 960 | 940 | 900 | 870 |
| Taxable value (£ millions) | 2010 to 2011 | 2011 to 2012 | 2012 to 2013 | 2013 to 2014 | 2014 to 2015 | 2015 to 2016 | 2016 to 2017 | 2017 to 2018 | 2018 to 2019 |
| Car | 3,660 | 3,610 | 3,730 | 3,820 | 3,950 | 4,320 | 4,570 | 4,880 | 5,270 |
| Car fuel | 810 | 770 | 770 | 740 | 720 | 700 | 640 | 590 | 540 |
| Total | 4,470 | 4,380 | 4,500 | 4,560 | 4,670 | 5,020 | 5,210 | 5,470 | 5,810 |
| Tax liability (£ millions) | 2010 to 2011 | 2011 to 2012 | 2012 to 2013 | 2013 to 2014 | 2014 to 2015 | 2015 to 2016 | 2016 to 2017 | 2017 to 2018 | 2018 to 2019 |
| Car | 1,170 | 1,200 | 1,240 | 1,300 | 1,350 | 1,490 | 1,550 | 1,620 | 1,730 |
| Car fuel | 260 | 260 | 260 | 260 | 250 | 250 | 230 | 200 | 180 |
| Total | 1,430 | 1,460 | 1,500 | 1,560 | 1,600 | 1,740 | 1,780 | 1,830 | 1,910 |
| NIC liability (£ millions) | 2010 to 2011 | 2011 to 2012 | 2012 to 2013 | 2013 to 2014 | 2014 to 2015 | 2015 to 2016 | 2016 to 2017 | 2017 to 2018 | 2018 to 2019 |
| Car | 470 | 500 | 510 | 530 | 550 | 600 | 630 | 670 | 730 |
| Car fuel | 100 | 110 | 110 | 100 | 100 | 100 | 90 | 80 | 80 |
| Total | 570 | 610 | 620 | 630 | 650 | 700 | 720 | 750 | 800 |
| Average taxable value (£) | 2010 to 2011 | 2011 to 2012 | 2012 to 2013 | 2013 to 2014 | 2014 to 2015 | 2015 to 2016 | 2016 to 2017 | 2017 to 2018 | 2018 to 2019 |
| Car | 3,850 | 3,810 | 3,980 | 4,050 | 4,150 | 4,480 | 4,860 | 5,390 | 6,030 |
| Car fuel | 3,300 | 3,270 | 3,530 | 3,630 | 3,690 | 3,890 | 4,030 | 4,270 | 4,740 |
- all figures given for 2018 to 2019 are based on the 2017 to 2018 Expenses and Benefits file projected forward to 2018 to 2019. These projections are provisional and subject to revision in future publications
- all recipients of company car fuel benefit must also be in receipt of a company car. However, historic figures in this row may exclude a small number of cases where an individual received a company car with zero taxable value but received company car fuel benefit with positive taxable value
- Numbers and amounts less than 10 are rounded to the nearest 5; those greater than 10 are rounded to the nearest 10.
- The column totals may not equal the sum of individual components due to rounding.
- From April 2016 the requirement to report certain benefits in kind on the P11D form has been removed for those employers who register to deduct the tax due on those benefits in kind directly from payroll. A system was set up for employers who voluntarily payroll company cars to report the cars in their regular PAYE returns on RTI, but this was not compulsory until April 2018.
- For the figures reported for years 2017 to 2018 and 2018 to 2019, the P11D data is supplemented with RTI data to account for car and car fuel benefits that were not reported on the P11D form due to payrolling. Figures for all previous years (including 2016 to 2017) are based solely on P11D data.
- The data in this table are not fully complete. Some company cars are not included in the source data used to produce the statistics and are therefore excluded from the tables. For more information please see the background documentation.
Comparisons below make use of the 2018 to 2019 figures. These are provisional estimates and the tax and NIC figures for 2018 to 2019 are based on projections.
These figures in the table reflect those company cars which have been reported to HMRC. As explained in more detail below, and in the background documentation, the incomplete reporting of voluntarily payrolled company cars since 2016 to 2017 means we cannot draw clear conclusions about the trend in the number of company cars in recent years.
Figure 3: Company car recipients and total taxable value
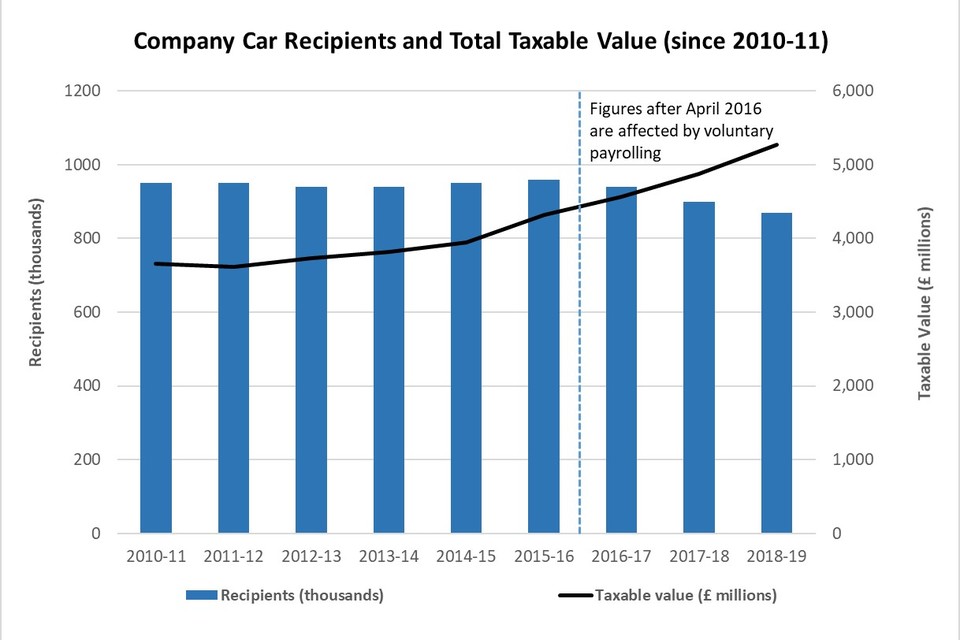
Figure 3: Company Car Recipients and Total Taxable Value
Company car benefits
The current system of company car taxation, in which the taxable benefit of a company car is calculated with reference to the car’s reported CO2 emissions, was introduced in April 2002.
Figure 3 above shows how the number of reported recipients of company cars and the total taxable value of all company cars has changed since the current system began. The figure for 2016 to 2017 does not include any estimate of the impact of voluntary payrolling which was introduced in April 2016. Figures for 2017 to 2018 and 2018 to 2019 are experimental figures and include voluntarily payrolled cars which were reported to HMRC; however significant numbers were not reported.
In recent years the total taxable value of company cars has increased significantly. This is primarily due to increases in car list prices and increases in the ‘appropriate percentages’ used to calculate a company car’s taxable value.
Between 2009 to 2010 and 2015 to 2016 the number of company car users seems to have remained relatively stable (at just under one million).
Reduction in reported number of recipients from 2016 to 2017
The number of reported recipients of company cars in Table 4.5 has fallen since April 2016. This reduction coincides with the introduction of voluntary payrolling and at least part of the apparent reduction is due to employers moving from submitting P11D returns to collecting tax on company cars through payroll.
In 2016 to 2017 employers were not able or required to submit more detailed information about company cars when collecting tax on this benefit through voluntary payrolling. From 2017 to 2018 employers payrolling car benefit were able to provide more detailed data about the cars being provided through their FPS (Full Payment Submission).
However, providing this data was not mandatory until 2018 to 2019. Even after mandation of providing more detailed data through FPS, it is believed that there are non-trivial levels of non-reporting. As such, a significant number of company cars were not reported to HMRC between 2016 to 2017 and 2018 to 2019. It is not possible to produce accurate estimates of the number of unreported company cars but HMRC analysis suggests they account for a high proportion of the reduction observed in this table.
Company car fuel benefit
There has been a general downward trend in the number of recipients and taxable value of car fuel benefits throughout the period covered by these statistics. In 2002 to 2003 the number of recipients of car fuel benefit was 570,000 and the total taxable value was £1.54 billion; provisional figures suggest that by 2018 to 2019 the number of recipients fell to 110,000 while the total taxable value fell to £540 million.
This trend is likely to reflect rising fuel prices during most of this period, causing employers and employees to look more carefully at whether the fuel benefit formula results in a tax charge commensurate with the true value of the benefit.
Figure 4: Fuel benefit recipients and total taxable value
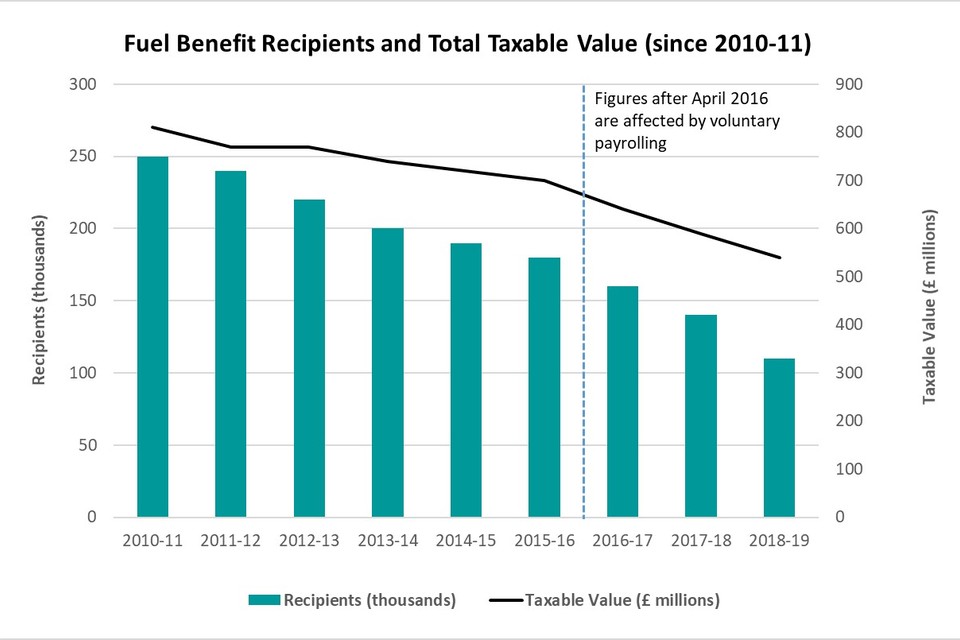
Figure 4: Fuel benefit recipients and total taxable value
WLTP and RDE2
The way that a vehicle’s CO2 emissions are measured is changing. The older test procedure (the NEDC or ‘New European Driving Cycle’ test procedure) is being replaced with a new test procedure called the Worldwide Harmonised Light Vehicle Test Procedure (or WLTP). From September 2018 all new cars will be tested using the WLTP, though for tax calculations before April 2020 the CO2 emissions measured with this test will be converted back to equivalent NEDC figures. The change to WLTP testing does not appear to have had a significant impact on the 2018 to 2019 provisional statistics. The tax calculation change had yet to take place during the period covered by the current statistics and so has not had any direct impact on them.
The diesel supplement is also changing. Since April 2002, a ‘diesel supplement’ has been applied to all diesel cars, increasing their taxable value compared to an otherwise identical non-diesel car. From April 2018, the diesel supplement will only apply to diesel cars that fail to meet the Real Driving Emissions 2 (RDE2) emissions standards. This change, as of yet, does not appear to have had a significant effect on the trend in company car users or taxable value.