Statistical commentary July 2021
Published 29 July 2021

© Crown copyright 2021
This publication is licensed under the terms of the Open Government Licence v3.0 except where otherwise stated. To view this licence, visit nationalarchives.gov.uk/doc/open-government-licence/version/3 or write to the Information Policy Team, The National Archives, Kew, London TW9 4DU, or email: psi@nationalarchives.gov.uk.
Where we have identified any third party copyright information you will need to obtain permission from the copyright holders concerned.
This publication is available at https://www.gov.uk/government/statistics/benefits-in-kind-statistics-july-2021/statistical-commentary-july-2021
1. Summary
Key outturns for company car and fuel benefits in tax year 2018 to 2019 are:
- The total number of reported recipients of company car benefit was 870,000 (compared to 900,000 in the previous tax year) and the total taxable value of company car benefit was £5.27 billion (compared to £4.88 billion in the previous tax year)
- The total number of reported recipients of fuel benefit was 110,000 (compared to 140,000 in the previous tax year) and the total taxable value of fuel benefit was £0.54 billion (compared to £0.59 billion in the previous tax year)
- The average reported CO2 emission of company cars was 110 g/km (compared to 111 g/km in the previous tax year)
- 68% of company cars used diesel fuel (down from 76% in the previous tax year)
- The number of reported recipients of company cars with CO2 emissions of 75g/km or less was 60,000 (up from around 45,000 in the previous tax year)
- The total taxable value of all Class 1A taxable benefits in kind was £9.9 billion (up from £9.4 billion in the previous tax year)
Provisional figures for tax year 2019 to 2020 suggest:
- The total number of reported recipients of company car benefit is estimated to have been 800,000, while the total taxable value of company car benefit is estimated to have been £5.42 billion
- The total number of reported recipients of fuel benefit is estimated to have been 90,000, while the total taxable value of fuel benefit is estimated to have been £0.47 billion
- The total taxable value of all Class 1A taxable benefits in kind was £10.3 billion
Comparisons over time are complicated by data incompleteness arising from the introduction of voluntary payrolling in April 2016. Until April 2018 there was no requirement to report the details of voluntarily payrolled company cars. Reporting of these cars is now required but it appears there is still considerable underreporting, which may account for some of the reduction in company cars since tax year 2015 to 2016.
2. Detailed Statistics
This section provides detailed commentary and statistics on company cars. These statistics are based on four main data sources:
- P11D forms returned by employers to HMRC at the end of each tax year and electronically on the Employer Compliance System (ECS)
- Details on company car and car fuel benefit reported by employers to HMRC as part of their regular PAYE returns on Real Time Information (RTI)
- The Survey of Personal Incomes (SPI), a systematic random sample of individuals who have been in contact with HMRC over the tax year
- Class 1A National Insurance receipts data taken from HMRC’s Enterprise Tax Management Platform (ETMP) system
For a more detailed explanation of how these data are used, users are encouraged to read the background documentation that accompanies this release.
2.1 Coverage of these statistics
In last year’s publication the scope of HMRC’s taxable benefits in kind statistics was restricted to company cars (and company car fuel) only. This decision was made because the increased uptake of payrolling had substantially reduced the completeness of the data on which statistics for other benefits were based. Company cars (and car fuel) remain the focus of this year’s publication.
The term ‘payrolling’ refers to the situation in which an employer calculates and deducts tax on employee benefits in kind through their payroll. This contrasts with the standard situation in which the tax on benefits is collected via tax code adjustments notified by HMRC to the employer, based on P11D returns submitted after the end of the tax year. From April 2018, company cars and car fuel are the only benefits for which it is mandatory for employers who have chosen to payroll to report detailed information as part of their regular PAYE returns on RTI.
Tables 1, 2 and 3 of this publication therefore cover company car and company car fuel only. Tables 1 and 2 are time series beginning in April 2010, while Table 3 provides a breakdown for a single year (tax year 2018 to 2019).
In addition to these tables, Table 4 provides users with the total taxable value of all (Class 1A) taxable benefits in kind. This table is a time series beginning in tax year 2015 to 2016, the last year before the introduction of voluntary payrolling. This table is based on NICs Class 1A receipts cleared to date.
The introduction of voluntary payrolling also affected the way in which company car data are reported. This has an impact on the completeness of the data underlying Tables 1, 2 and 3. See Section 2.5 for further details.
2.2 Company car benefit and company car fuel benefit
Numbers quoted in this section are taken from Table 1: Company car benefit and company car fuel benefit (time series), published alongside this commentary document.
Tax year 2018 to 2019
In total, company car benefit was reported for around 870,000 individuals in tax year 2018 to 2019. The total (taxable) value of company car benefit was £5.27 billion. Total Income Tax and NIC liabilities were around £1.75 billion and £0.73 billion respectively.
110,000 individuals reporting company car benefit were also reported to be in receipt of car fuel benefit. This is about 13% of all car benefit recipients. The total taxable value of car fuel benefit was £540 million. Total Income Tax and NIC liabilities for car fuel benefit were around £190 million and £70 million respectively.
The average taxable values for car benefit and car fuel benefit in this year were £6,030 and £4,740 respectively.
Tax year 2019 to 2020
Figures for tax year 2019 to 2020 in Table 1 are based on an early extract of electronically captured data on car benefits and in addition the tax and NICs figures for that year are also based on projections of the SPI for tax year 2018 to 2019. These figures are provisional and subject to revision in future publications.
It is projected that the number of recipients of company car benefit will fall to 800,000 individuals in tax year 2019 to 2020. However, the total taxable value of company car benefit is projected to increase to £5.42 billion.
Both the number of recipients of company fuel benefit and the total taxable value of this benefit are projected to continue to decline in this year (to 90,000 recipients and £470 million respectively).
Longer term trends
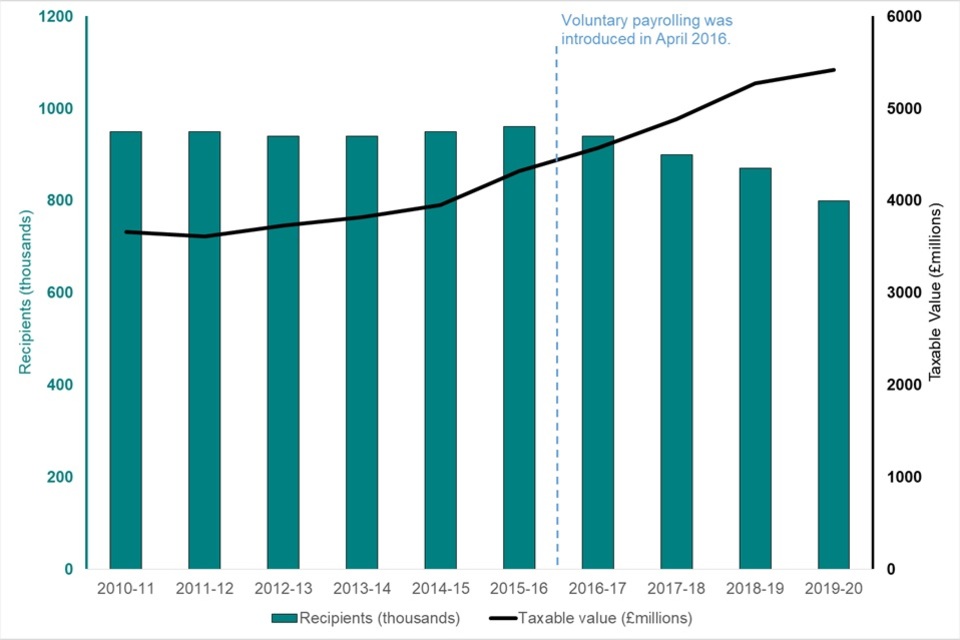
Figure 1: Number of recipients and total taxable value of company cars (from April 2010)
| Tax Year | Car benefit recipients (thousands) | Car benefit taxable value (£millions) |
|---|---|---|
| 2010 to 2011 | 950 | 3660 |
| 2011 to 2012 | 950 | 3610 |
| 2012 to 2013 | 940 | 3730 |
| 2013 to 2014 | 940 | 3820 |
| 2014 to 2015 | 950 | 3950 |
| 2015 to 2016 | 960 | 4320 |
| 2016 to 2017 | 940 | 4570 |
| 2017 to 2018 | 900 | 4880 |
| 2018 to 2019 | 870 | 5270 |
| 2019 to 2020 | 800 | 5420 |
Figure 1 (above) shows how the number of reported recipients of company car benefit and the total taxable value of all company cars has changed in the period April 2010 to March 2020. Note that the figures for tax year 2016 to 2017 do not include any estimate of the impact of voluntary payrolling, which was introduced from April 2016. Figures for the three years after this year are experimental and include voluntarily payrolled company cars which were reported to HMRC. However analysis suggest that significant numbers were not reported in all three years, even after reporting became mandatory.
Between tax year 2010 to 2011 and tax year 2015 to 2016 the reported number of recipients of company car benefit remained relatively stable (at just under one million). More recently the number of reported company car users has fallen to 900,000 in tax year 2017 to 2018 and then to 870,000 in tax year 2018 to 2019. Provisional figures suggest a further fall to 800,000 in tax year 2019 to 2020. However the reporting issues noted above mean that there is likely to be a substantial number of individuals in these years who received company car benefit that (while taxed at payroll) was not properly reported to HMRC.
Over the same period the total taxable value of reported company cars has increased significantly. In tax year 2010 to 2011 it was £3.66 billion but by 2018 to 2019 it had reached £5.27 billion. This increase is primarily due to increases in the average taxable value of a company car, which is itself a result of increases in average car list prices and increases to the ‘appropriate percentages’ used to calculate a company car’s typical value.
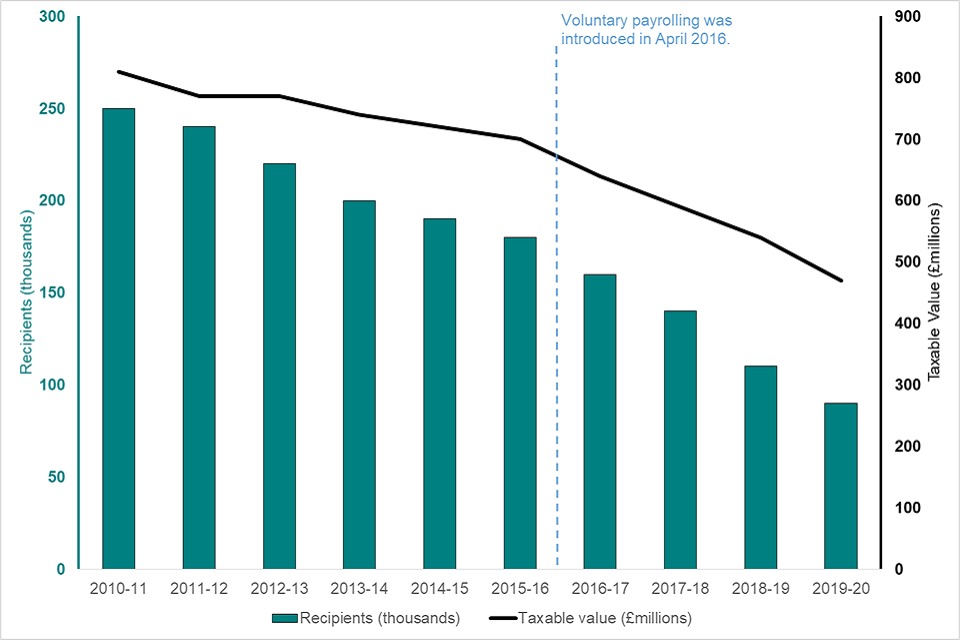
Figure 2: Number of recipients and taxable value of fuel benefit (since April 2010)
| Tax year | Fuel benefit recipients (thousands) | Fuel benefit taxable value (£millions) |
|---|---|---|
| 2010 to 2011 | 250 | 810 |
| 2011 to 2012 | 240 | 770 |
| 2012 to 2013 | 220 | 770 |
| 2013 to 2014 | 200 | 740 |
| 2014 to 2015 | 190 | 720 |
| 2015 to 2016 | 180 | 700 |
| 2016 to 2017 | 160 | 640 |
| 2017 to 2018 | 140 | 590 |
| 2018 to 2019 | 110 | 540 |
| 2019 to 2020 | 90 | 470 |
Figure 2 (above) shows that there has been a long-term downward trend in both the number of recipients and the total taxable value of car fuel benefits throughout the period covered by these statistics. In tax year 2010 to 2011 the number of recipients of car fuel benefit was 250,000 and the total taxable value was £810 million. By tax year 2018 to 2019 these figures had fallen to 110,000 and £540 million respectively. Provisional figures for tax year 2019 to 2020 suggest a further fall to 90,000 and £470 million respectively.
This trend is likely to reflect rising fuel prices during most of this period, causing employers and employees to look more carefully at whether the fuel benefit formula results in a tax charge commensurate with the perceived value of the benefit.
Published figures for years before April 2010 can be found on the National Archives website.
Changes to this year’s publication
Note that Table 1 in this year’s update of the statistics replaces both “Table 4.1” and “Table 4.5” from previous years’ publications. All the information in those two tables is now included in Table 1.
2.3 Company cars by CO2 emissions and fuel type
Numbers quoted in this section are taken from Table 2: Company car benefit recipients as reported to HMRC by vehicle CO2 emission and fuel type (time series), published alongside this commentary document.
Tax Year 2018 to 2019
The current system of company car taxation, in which the taxable benefit of a company car is calculated with reference to the car’s reported CO2 emissions, was introduced in April 2002. In tax year 2002 to 2003, about 40% of all company cars reported emissions below 165 g/km.
In tax year 2018 to 2019 98% of all company cars had emissions of less than 165 g/km. Over 50% of all recipients of company cars reported CO2 emissions of between 95 g/km and 114 g/km. The average reported emission was 110 g/km.
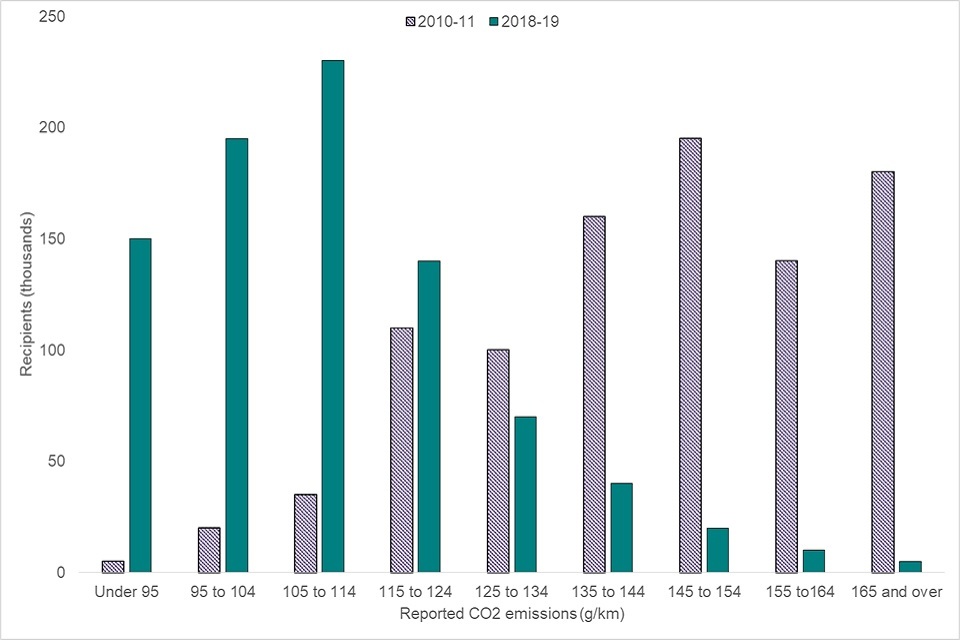
Figure 3: Recipients of car benefit by emission range (tax year 2010 to 2011 and tax year 2018 to 2019)
| Reported CO2 emissions | Recipients in tax year 2010 to 2011 (thousands) | Recipients in tax year 2018 to 2019 (thousands) |
|---|---|---|
| Under 95 [footnote 1] | 5 | 150 |
| 95 to 104 | 20 | 195 |
| 105 to 114 | 35 | 230 |
| 115 to 124 | 110 | 140 |
| 125 to 134 | 100 | 70 |
| 135 to 144 | 160 | 40 |
| 145 to 154 | 195 | 20 |
| 155 to 164 | 140 | 10 |
| 165 and over [footnote 1] | 180 | 5 |
Figure 3 (above) illustrates the distribution of company cars by emission range. Between tax year 2010 and 2011 and tax year 2018 and 2019 the number of recipients of cars with emissions above 125 g/km substantially decreased, while the number of recipients of cars with emissions below 125 g/km increased.
Tax year 2019 to 2020
Figures for tax year 2019 to 2020 are based on an early extract of data on car benefits. These figures are provisional and subject to revision in future publications. The provisional data suggests that in tax year 2019 to 2020 the distribution of CO2 emissions of company cars was similar to the pattern observed in the previous year. The average reported emission in this year was 111 g/km.
WLTP and RDE2
The way that a vehicle’s CO2 emissions are measured changed between 2018 and 2020. The older test procedure (the NEDC or ‘New European Driving Cycle’ test procedure) was replaced with a new test procedure called the Worldwide Harmonised Light Vehicle Test Procedure (WLTP). From September 2018 all new cars were tested using the WLTP, though before April 2020 the CO2 emissions measured with this test were converted back to equivalent NEDC figures for tax calculations. All new cars will use the WLTP CO2 measurement for tax calculations from April 2020.
Longer term trends
There is a strong reducing trend in the level of reported CO2 emissions. In tax year 2002 to 2003, when the current system of company car taxation was introduced, 58% of company cars reported emissions in excess of 165 g/km. By tax year 2010 to 2011, the first year covered by Table 2, only 19% of company cars reported emissions in excess of 165 g/km. And in tax year 2018 to 2019, only 4% of company cars reported emissions in excess of this level.
Between tax year 2010 to 2011 and tax year 2017 to 2018 average reported CO2 emissions fell from 147 g/km to 111 g/km. However the average annual reduction was greater in the earlier years of the decade. In tax year 2018 to 2019 reported emissions were 110 g/km and in tax year 2019 to 2020 they rose slightly to 111 g/km.
It should be noted that the way in which CO2 emissions are measured changed for all new cars from 2018 onwards and this may have had an impact on the time series. See the section on the move to the WLTP test (above) for further details.
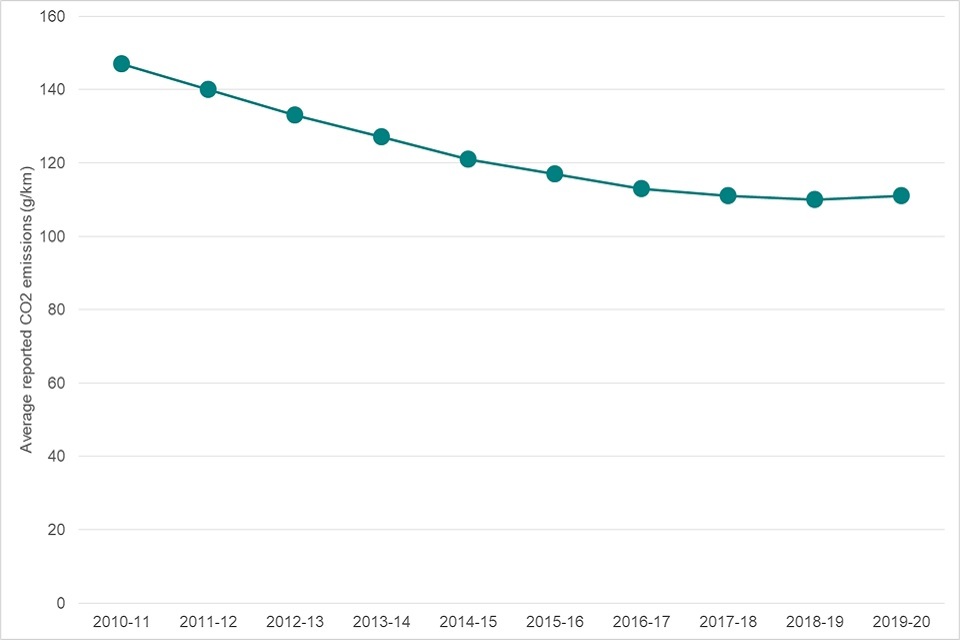
Figure 4: Average (reported) CO2 emissions of company cars since April 2010
| Tax year | Average reported CO2 emission |
|---|---|
| 2010 to 2011 | 147 |
| 2011 to 2012 | 140 |
| 2012 to 2013 | 133 |
| 2013 to 2014 | 127 |
| 2014 to 2015 | 121 |
| 2015 to 2016 | 117 |
| 2016 to 2017 | 113 |
| 2017 to 2018 | 111 |
| 2018 to 2019 | 110 |
| 2019 to 2020 | 111 |
Figure 4 (above) shows how the average emissions of company cars has decreased during this time period.
There have significant shifts in the proportion of diesel company cars. In tax year 2002 to 2003 only 33% of company cars used diesel. This proportion increased over time until, by tax year 2013 to 2014, 82% of all company cars were diesel, with about 18% using other fuel types, predominantly petrol. However, this proportion began to decrease from tax year 2014 to 215, falling to 68% in tax year 2018 to 2019 and (provisionally) to 61% in tax year 2019 to 2020.
Between April 2010 and April 2015 electric cars (with CO2 emissions of 0 g/km) were not liable to company car tax. Therefore this table only includes electric cars for years after April 2015.
The number of Ultra-Low Emission Vehicles (ULEVs), with CO2 emissions no greater than 75 g/km, have been increased steadily in recent years. In tax year 2014 to 2015 only around 5,000 individuals were reported to be using such company cars. By tax year 2017 to 2018 this figure had increased to around 45,000. In tax year 2018 to 2019 the figure increased again to 60,000. And provisional figures for tax year 2019 to 2020 suggest that the figure increased again in that year to 70,000.
Published figures for years before April 2010 can be found on the National Archives website.
Changes to this year’s publication
Note that Table 2 in this year’s update of the statistics replaces “Table 4.4” from previous years’ publications. That table was not a time series, but only gave figures for a single year. However, the older table included breakdowns of taxable value and tax and NICs liability that are not included in Table 2. Data on tax liability is included in Table 1.
2.4 Company cars and employer-provided fuel by range of total income
Numbers quoted in this section are taken from Table 3: Analysis of employer-provided fuel by range of total income, published alongside this commentary document.
In tax year 2018 to 2019, the number of reported recipients of company car benefits was 870,000. Collectively these individuals received £5.27 billion of taxable value in company car benefit. There were 110,000 individuals who received company car fuel benefit, with a total taxable value of £540 million.
As shown in Figure 5 (below), above an income of £8,500 the average (taxable) value of company car benefit increases with total income. Note that the taxable value of a company car is determined by a calculation involving the car’s list price and CO2 emissions (among other factors), and this may not accurately reflect the value of the car as perceived by the recipient.
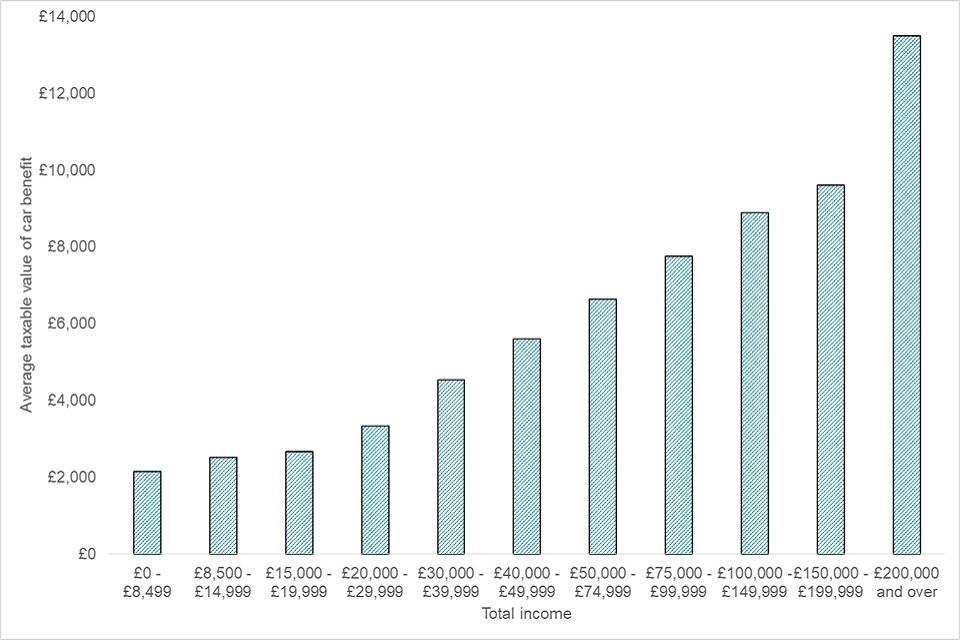
Figure 5: Average taxable value of company car benefit by range of total income (tax year 2018 to 2019)
| Income band | Average taxable value of car benefit (in tax year 2018 to 2019) |
|---|---|
| £0 to £8,499 | £2,140 |
| £8,500 to £14,999 | £2,510 |
| £15,000 to £19,999 | £2,670 |
| £20,000 to £29,999 | £3,340 |
| £30,000 to £39,999 | £4,540 |
| £40,000 to £49,999 | £5,600 |
| £50,000 to £74,999 | £6,630 |
| £75,000 to £99,999 | £7,750 |
| £100,000 to £149,999 | £8,890 |
| £150,000 to £199,999 | £9,600 |
| £200,000 and over | £13,490 |
Changes to this year’s publication
Note that Table 3 in this year’s update of the statistics replaces “Table 4.3” from previous years’ publications. All information that was included in that table is now included in Table 3.
2.5 The impact of “voluntary payrolling” on these statistics
As noted previously, the term ‘payrolling’ refers to the situation in which an employer calculates and deducts tax on employee benefits in kind through their payroll. In recent years the increased uptake of payrolling has had an impact on the completeness of the data on which these statistics are based.
Informal payrolling
Before April 2016 a small number of employers were permitted to operate informal payrolling systems for taxable benefits in kind. These employers were still legally obliged to return P11Ds at the end of the tax year, but these P11Ds were not electronically processed and therefore are not included in these statistics.
Voluntary payrolling
From April 2016 the requirement to report certain benefits in kind on the P11D form has been removed for those employers who register to deduct the tax due on those benefits in kind directly from payroll. A system was set up for employers who voluntarily payroll company cars to report these cars in their regular PAYE returns on RTI, but this was not compulsory until April 2018.
- Tax year 2016 to 2017: RTI reporting of company cars not possible
- Tax year 2017 to 2018: RTI reporting of company cars on a voluntary basis
- Tax year 2018 to 2019 and later: RTI reporting of company cars compulsory
The statistics in these tables therefore omit all cars which were voluntarily payrolled in tax year 2016 to 2017, as well as some cars that were voluntarily payrolled in tax year 2017 to 2018 (those which the employers chose not to report).
From April 2018 onward all voluntarily payrolled company cars should have been reported to HMRC. However there is evidence that compliance with the new reporting system is not complete.
The issue of incompleteness means that it is difficult to draw conclusions from these statistics about the trend in the number of company cars in recent years. The number of company cars reported to HMRC has fallen from 960,000 in tax year 2015 to 2016 (the final year before the introduction of voluntary payrolling) to 800,000 in tax year 2019 to 2020. But there is internal evidence to suggest that a substantial number of company car benefits were not correctly reported to HMRC in tax year 2019 to 2020, which suggests that this 800,000 figure underestimates the true number of company car recipients.
This evidence includes both identifying PAYE schemes which registered to payroll company car benefits and yet did not report any company cars through RTI, and observing unusual trends in the number of company cars reported by PAYE schemes which do not seem likely to reflect real changes in the provision of company cars to employees. It is not possible to quantify precisely the impact of payrolling on the figures provided, but users of these statistics should be aware that this “reporting gap” is likely to have substantially exaggerated the observed trend in the number of company car recipients in years since April 2016.
2.6 Other (Class 1A) taxable benefits in kind
Numbers quoted in this section are taken from Table 4: Total Class 1A taxable benefits in kind (time series), published alongside this commentary document.
As noted above, changes to the way that taxable benefits in kind are calculated – in particular, the increased uptake of payrolling – mean that it is no longer possible for HMRC to publish detailed statistics on the majority of taxable benefits in kind. Therefore, as of September 2020, the focus of this publication has been shifted to company cars (and company car fuel) only.
However, in response to last year’s user engagement exercise this publication now includes an additional table showing the total value of taxable benefits in kind. This new table (Table 4) shows that the value of Class 1A taxable benefits in kind has increased steadily year-on-year since tax year 2015 to 2016 at a rate of about 5% every year. The total value of Class 1A taxable benefits in kind in tax year 2019 to 2020 was £10.30 billion, meaning that the (taxable) value of company cars is projected to be about half the total (taxable) value of all such benefits.
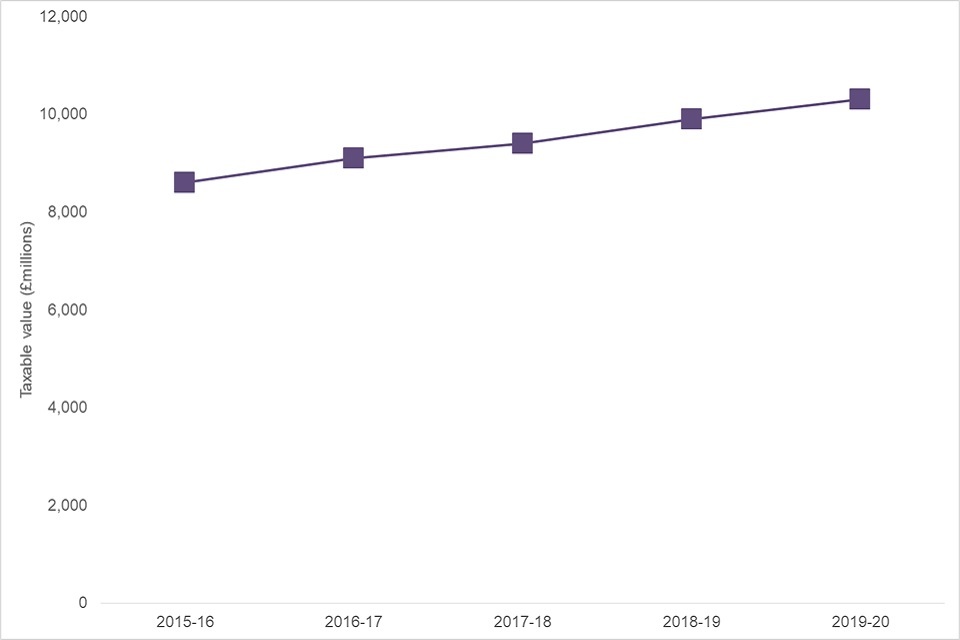
Figure 6: Total taxable value of Class 1A benefits in kind (since April 2015)
| Tax year | Total taxable value of Class 1A benefits in kind |
|---|---|
| 2015 to 2016 | 8600 |
| 2016 to 2017 | 9100 |
| 2017 to 2018 | 9400 |
| 2018 to 2019 | 9900 |
| 2019 to 2020 | 10300 |
Note that the figures in this table cannot be directly compared to the total figures that were previously published in Table 4.1 and Table 4.5.
-
Figures in Table 4 are based on data on NICs Class 1A receipts cleared to date, as taken from HMRC’s Enterprise Guide Tax Management Platform (ETMP). Figures in the older tables were based on electronically captured P11D returns.
-
The figures in the older tables included a small number of taxable benefits liable to Class 1 National Insurance (such as excess mileage allowance and payments on behalf of employees), which are not included in Table 4.
-
Conversely, the older tables excluded some instances of Class 1A benefits that were being informally payrolled (particularly private medical/dental insurance), which are included in Table 4.
-
Figures in Table 4 do not include amounts relating to Termination Awards and Sporting Testimonials, which can be subject to Class 1A NICs from April 2020.
It is not possible, using the ETMP data, to provide either the total number of recipients of Class 1A taxable benefits in kind or to provide the total Income Tax liability charged on these benefits.
2.7 Breakdown by gender
The tables that accompany this release do not currently include any breakdown of the number of recipients of company car benefit by gender. However it is possible to estimate this using the same methodology as is currently used to produce tax liability estimates for Table 1. Recent feedback from users suggests that such a breakdown would be of interest. In tax year 2019 to 2020 the latest available data suggests that about 72% of all recipients of company cars were male. This figure appears to be fairly stable over time.
2.8 User engagement exercise
In 2020 HMRC carried out a user engagement exercise to better understand how the removal of non-car benefits in kind affected users of these statistics and to seek their view on the changes being considered to the way these statistics are presented. HMRC’s response to that user engagement exercise can be found here: https://www.gov.uk/government/statistics/benefits-in-kind-statistics-user-engagement-exercise-2020.
This year’s publication implements some of the changes discussed in the user engagement exercise. It is planned to make further changes ahead of next year’s publication. Although the user engagement exercise is now closed, users of the statistics who wish to share their views about these changes can do so by contacting personaltax.statistics@hmrc.gov.uk.