2021 Statistics on English coastal and inland Bathing waters: A summary of compliance with the 2013 Bathing Water Regulations
Updated 25 November 2025
Applies to England

© Crown copyright 2025
This publication is licensed under the terms of the Open Government Licence v3.0 except where otherwise stated. To view this licence, visit nationalarchives.gov.uk/doc/open-government-licence/version/3 or write to the Information Policy Team, The National Archives, Kew, London TW9 4DU, or email: psi@nationalarchives.gov.uk.
Where we have identified any third party copyright information you will need to obtain permission from the copyright holders concerned.
This publication is available at https://www.gov.uk/government/statistics/bathing-water-quality-statistics/statistics-on-english-coastal-and-inland-bathing-waters-a-summary-of-compliance-with-the-2013-bathing-water-regulations
These results summarise the compliance of coastal and inland bathing waters for England in 2021. Datasets on compliance for coastal and inland bathing waters in England are available to download
1. Headline results
-
In 2021, out of the 417 bathing waters measured in England, 413 (99.0 per cent) met at least the minimum standard of the Bathing Water Regulations.
-
In 2021, 295 bathing waters in England (70.7 per cent) met the Excellent standard of the Bathing Water Regulations.
-
In 2021, 4 bathing waters in England (1.0 per cent) did not meet the minimum standard, and were classified as Poor.
2. Context
For every designated bathing water in England, the Environment Agency monitors Escherichia coli and intestinal enterococci in the water, throughout the bathing season (15 May to 30 September). Values can vary; depending on the weather, pollution from agricultural and urban sources, storm water overflows, amongst other factors. The readings taken over the last four bathing seasons then determine the annual classification for that water. Due to Coronavirus restrictions during the 2020 bathing water season, there was no classification in 2020. The 2021 classification results cover the period from 2017 to 2021; over a five year period, while still maintaining only the last four bathing seasons (namely 2017, 2018, 2019 and 2021).
Three bathing waters were de-designated prior to the 2021 season, with one new water being designated. A further two bathing waters are unassessed due to access issues.
The classifications are:
- Excellent – the highest, cleanest class
- Good – generally good water quality
- Sufficient – the water quality meets the minimum standard
- Poor – the water quality has not met the minimum standard.
3. Analysis
Bathing Water Classification: England
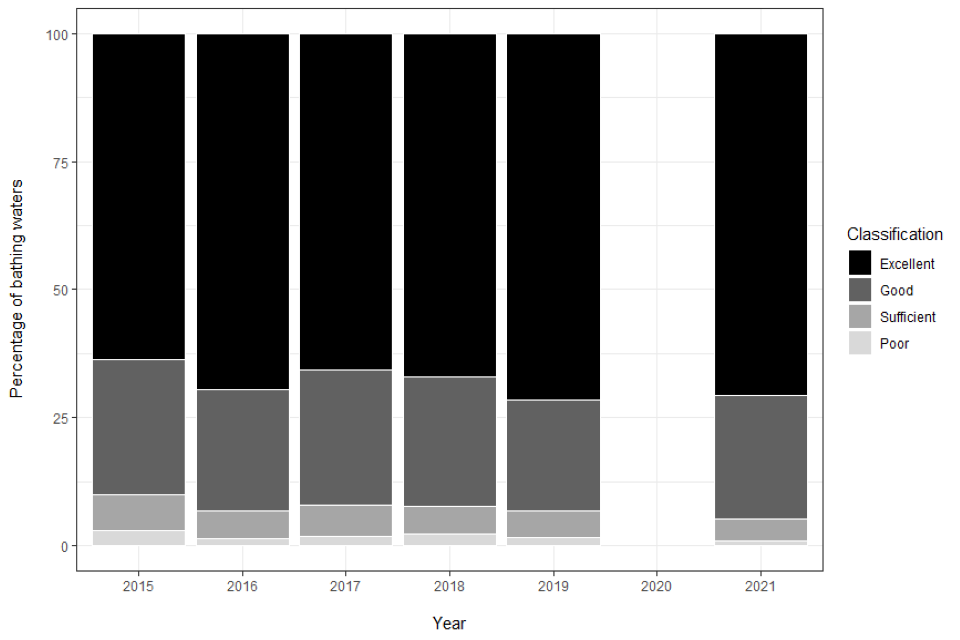
Table showing bathing water classification percentages from 2015 to 2021 for England. Source: Environment Agency
Source: Environment Agency
Since 2019, the number of designated bathing waters in England fell by 2 to 419. Those bathing waters meeting at least the minimum standard has risen to 99.0 per cent; the highest level since adopting the four-tier classification system in 2015. Likewise, the number of bathing waters in England meeting the Excellent or Good standard rose to just below 95 per cent. The number of Poor bathing waters dropped to just 1.0 per cent.
Bathing Water Classification: England
| Bathing water Classification: England | 2015 | 2016 | 2017 | 2018 | 2019 | 2020 | 2021 | |
|---|---|---|---|---|---|---|---|---|
| Bathing waters assessed |
415 | 413 | 413 | 420 | 420 | N/C | 417 | |
| Excellent | 264 63.6% |
287 69.5% |
271 65.6% |
282 67.1% |
302 71.9% |
N/C | 295 70.7% |
|
| Good | 110 26.5% |
98 23.7% |
109 26.4% |
106 25.2% |
90 21.4% |
N/C | 100 24.0% |
|
| Sufficient | 29 7.0% |
22 5.3% |
26 6.3% |
23 5.5% |
21 5.0% |
N/C | 18 4.3% |
|
| Poor | 12 2.9% |
6 1.5% |
7 1.7% |
9 2.1% |
7 1.7% |
N/C | 4 1.0% |
N/C - No classification in 2020 due to Coronavirus restrictions
percentages are subject to rounding errors.
4. Background information
These statistics have been produced to the high professional standards set out in the Code of Practice for Official Statistics, which sets out eight principles including meeting user needs, impartiality and objectivity, integrity, sound methods and assured quality, frankness and accessibility. More information on the Official Statistics Code of Practice can be found at: Code of Practice for Official Statistics
To help those deciding where to swim, information is online and on signs at the designated coastal and inland waters from May.
5. Notes
England
Scotland
Wales
Northern Ireland
Eurostat
Public Enquiries: 08459 335577; Media enquiries: 020 7238 6479
END