Asymmetries in international trade in goods statistics: UK measured against trade partners 2019 to 2021
Published 23 May 2023

© Crown copyright 2023
This publication is licensed under the terms of the Open Government Licence v3.0 except where otherwise stated. To view this licence, visit nationalarchives.gov.uk/doc/open-government-licence/version/3 or write to the Information Policy Team, The National Archives, Kew, London TW9 4DU, or email: psi@nationalarchives.gov.uk.
Where we have identified any third party copyright information you will need to obtain permission from the copyright holders concerned.
This publication is available at https://www.gov.uk/government/statistics/asymmetries-in-international-trade-in-goods-statistics-uk-measured-against-eu-and-non-eu-partner-countries-2019-to-2021/asymmetries-in-international-trade-in-goods-statistics-uk-measured-against-trade-partners-2019-to-2021
Main Findings
Imports
- The sum of the absolute asymmetry between UK reported imports and partner reported exports for each other country of the world decreased from $82.6 billion in 2019 to $71.9 billion in 2021.
- The sum of the absolute asymmetry between UK reported imports and partner reported exports for each non-EU country decreased from $46.1 billion in 2019 to $40.6 billion in 2021.
- The sum of the absolute asymmetry between UK reported imports and partner reported exports for each EU country decreased from $36.6 billion in 2019 to $31.3 billion in 2021.
- The sum of the absolute asymmetry between UK reported imports and partner reported exports for Germany, Belgium, Netherlands, and France decreased from $25.8 billion in 2019 to $15.1 billion in 2021.
- The absolute asymmetry between UK reported imports and USA reported exports decreased from $2.0 billion in 2019 to $ 1.7 billion in 2021.
- The UK absolute asymmetry between UK-reported imports and China has increased from from $3.1 billion in 2019 to to $4.1 billion in 2021.
Exports
- The sum of the absolute asymmetry between UK reported exports and partner reported imports for each other country of the world decreased from $67.6 billion in 2019 to $66.5 billion in 2021.
- The sum of the absolute asymmetry between UK reported exports and partner reported imports for each EU country increased from $29.3 billion in 2019 to $34.9 billion in 2021.
- The sum of the absolute asymmetry between UK reported exports and partner reported imports for Germany, Belgium, Netherlands, and France increased from $17.3 billion in 2019 to $20.3 billion in 2021.
- The sum of the absolute asymmetry between UK reported exports and partner reported imports for each non-EU country, decreased from $38.3 billion in 2019 to $ 31.6 billion in 2021.
- The absolute asymmetry between UK reported exports and USA reported imports decreased from $9.4 billion in 2019 to $2.9 billion in 2021.
- The absolute asymmetry between UK reported exports and China reported imports decreased from $6.2 billion in 2019 to $4.8 billion in 2021.
This publication provides an overview of the asymmetry between UK -reported trade in goods and equivalent trade reported by partner countries, where complete data is available for a given flow, for the calendar years 2019, 2020, and 2021. Additional tables can be found in the accompanying data set.
Countries that have not reported consistently for all years covered in this publication for a given flow have been excluded from that flow. See the ‘Background’ section below and the methodology notes for this publication for further details on data included in this report.
Background
What are trade asymmetries?
Trade asymmetries are the differences between the published trade statistics of a given country and its partner countries’ equivalent ‘mirror flows’. Each country collects their own data on international trade in goods. Theoretically, each reporting country’s exports to a given partner country should match said partner country’s imports from the reporting country, and vice versa. For instance, UK-reported imports from France should match France-reported exports to the UK. In reality, it is often the case that figures do not match exactly; we refer to these differences as trade asymmetries.
There are numerous reasons for asymmetries, including discrepancies in methodology, valuation, and partner country assignment.
Why do we measure trade asymmetries?
Monitoring trade asymmetries is important because it provides an external means of quality assurance, which can identify errors in reporting. Furthermore, asymmetry analysis informs discussion between countries on improving the quality of trade in goods statistics and understanding differences.
Where does the data used for this publication come from?
The data used in the compilation of this report was extracted from the United Nations International Trade Statistics Database on 16 March 2023, also known as the UN Comtrade database.
All countries must collect their own trade data and submit data to UN Comtrade on a monthly basis. After collating this data, UN Comtrade applies an average exchange rate on an annual basis to convert all countries’ data into USD ($).
For imports UN Comtrade report the ‘country of origin’ and for exports the ‘country of last known destination’ or ‘country of dispatch’.
The Trade Statistics Branch of the UN Statistics Division is responsible for the development and maintenance of the methodological guidelines on International Merchandise Trade Statistics (IMTS) although decisions are left to individual countries.
In the UK, non-EU trade in goods data has always been collected from customs declarations as submitted via the Customs Handling of Import and Export Freight (CHIEF) system, which collects UK Customs entries made by businesses.
Before the UK left the EU, EU trade in goods data were sourced from the Intrastat survey and controlled by EU legislation on Statistics aiming to harmonise statistical methodology. Intrastat was introduced in 1993 to replace customs declarations for trade between EU Member States following the introduction of the EU single market.
However, from January 2021, data on GB exports to the EU was instead collected from customs declarations, in line with non-EU trade. Data on UK imports from the EU and Northern Ireland (NI) exports to the EU continue to be collected via the Intrastat survey.
Which countries are included in this report?
For each flow, we have chosen to only include data for partner countries that have submitted data for each of the three years covered in this report. This is so that asymmetry comparisons can be made between years. It also ensures that we are not including asymmetries calculated using incomplete data in our totals.
However, to ensure that we are capturing instances of misclassification between countries, which is an important component of asymmetry, we do include data where one country has failed to submit data for a particular chapter, so long as both countries have submitted at least some data each year for the affected flow.
How are the trade asymmetries calculated?
There are numerous measurements of asymmetries. In this report we have chosen absolute asymmetry to be our leading asymmetry measure because as it is a measure of the magnitude of the asymmetry.
In the accompanying detailed data set, we also provide the following for our expert users:
- Non-absolute asymmetry figures. Positive numbers indicate the UK figures are higher and negative numbers indicate the opposite.
- % Relative asymmetry
- % Share of total UK absolute asymmetry with the rest of the world
For further detail on the definitions, calculations, and significance of each of these measurements, please see the methodology notes for this publication.
Imports
Countries
Absolute asymmetry with Belgium was the largest in 2021 totalling $7.1 billion.
Down from $11.1 billion in 2020 and $13.3 billion in 2019.
In 2021, China ($4.1 billion) showed the second largest absolute asymmetry followed by China, Hong Kong ($3.9 billion) and Netherlands ($3.5 billion).
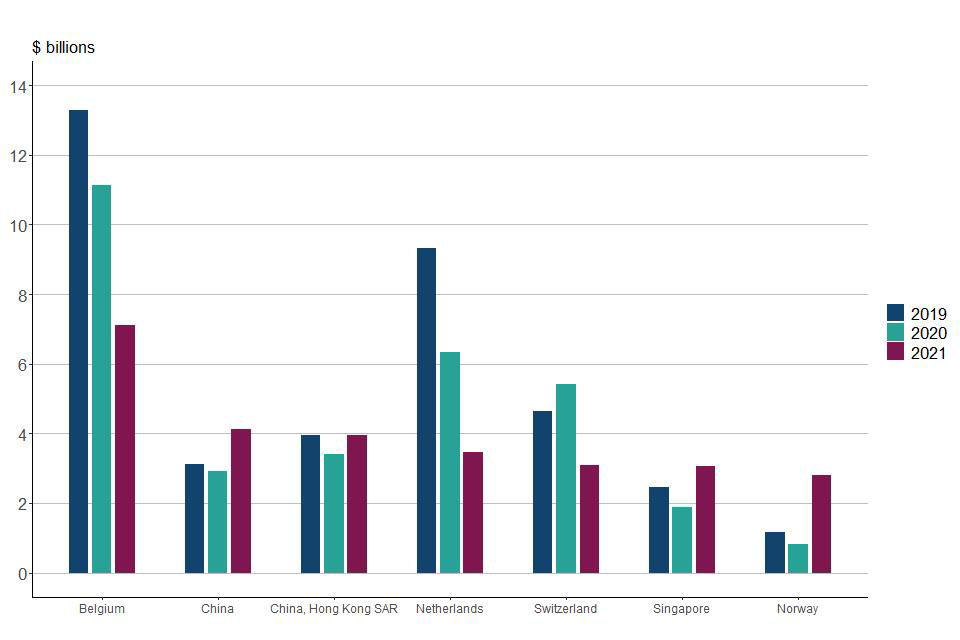
Figure 1: Absolute asymmetry for UK imports from 2019 to 2021 for the top 7 partner countries in 2021
UK Imports Countries
Download Figure 1 detailed data:
Source: HM Revenue & Customs
Figure 1 shows the absolute asymmetry for UK imports from 2019 to 2021 for the top 7 partner countries in 2021:
- Belgium shows the largest absolute asymmetry in 2021 at $7.1 billion
- China at $4.1 billion
- China, Hong Kong SAR at $3.9 billion
- Netherlands at $3.5 billion
- Switzerland at $3.1 billion
- Singapore at $3.1 billion
- Norway at $2.8 billion
Detailed asymmetries data for UK imports by partner country for 2019 to 2021, including other measures of asymmetry, can be found in Tables 1 a to 1 c in the accompanying data set.
Commodities
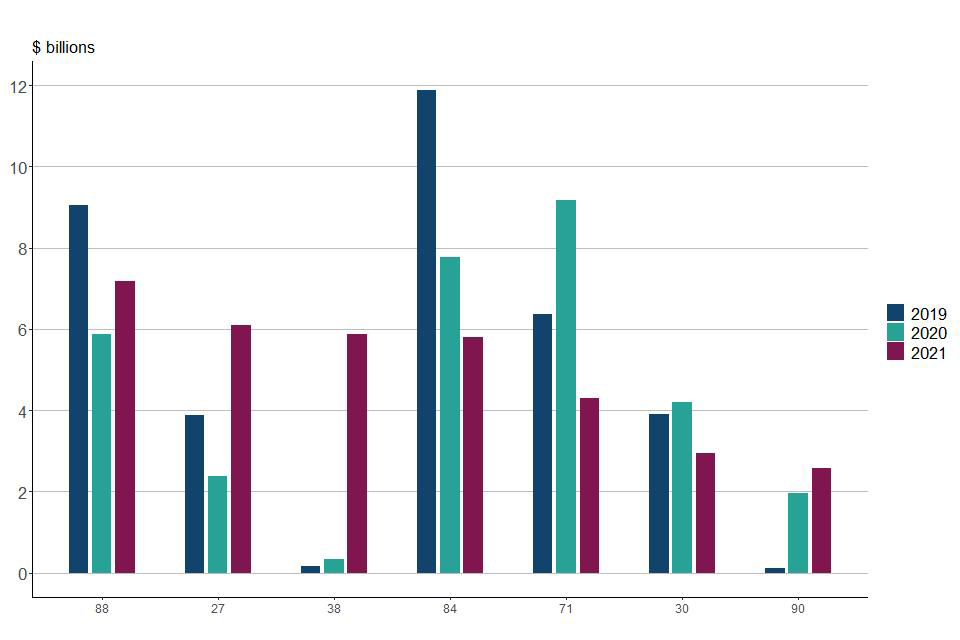
Figure 2: Absolute asymmetry for UK imports from 2019 to 2021 for the top 7 HS2 chapters in 2021
UK Imports HS2
Download Figure 2 detailed data:
Source: HM Revenue & Customs
Figure 2 shows the absolute asymmetry for UK imports from 2019 to 2021 for the top 7 HS2 chapters in 2021. It shows:
- Chapter 88: Aircraft, had the largest absolute asymmetry in 2021 at $7.2 billion
- Chapter 27: Mineral fuels at $6.1 billion
- Chapter 38: Miscellaneous chemical products at $5.9 billion
- Chapter 84: Mechanical appliances, also at $5.9 billion
- Chapter 71: Precious metals at $4.3 billion
- Chapter 30: Pharmaceutical products at $2.9 billion
- Chapter 90: Measuring devices and gauges at $2.6 billion.
Detailed asymmetries data for UK imports by HS2 chapter for 2019 to 2021, including other measures of asymmetry, can be found in Tables 3 a to 3 c in the accompanying data set.
Commodities by countries
Detailed asymmetries data for UK imports by partner country and HS2 chapter for 2019 to 2021, including various measures of asymmetry, can be found in Tables 5 a to 5 c in the accompanying data set.
Alternatively, Table 7 in the associated data set includes all data used in this publication by flow, partner country, HS2 chapter and year for 2019 to 2021, as sourced from the United Nations International Trade Statistics Database, alongside various measures of asymmetry calculated by HMRC.
Exports
Countries
Absolute asymmetry with Belgium was the largest in 2021 totalling $8.8 billion.
Up from $2.7 billion in 2020 and $3.6 billion in 2019.
In 2021, Ireland ($6.1 billion) showed the second largest absolute asymmetry followed by Netherlands ($5.7 billion).
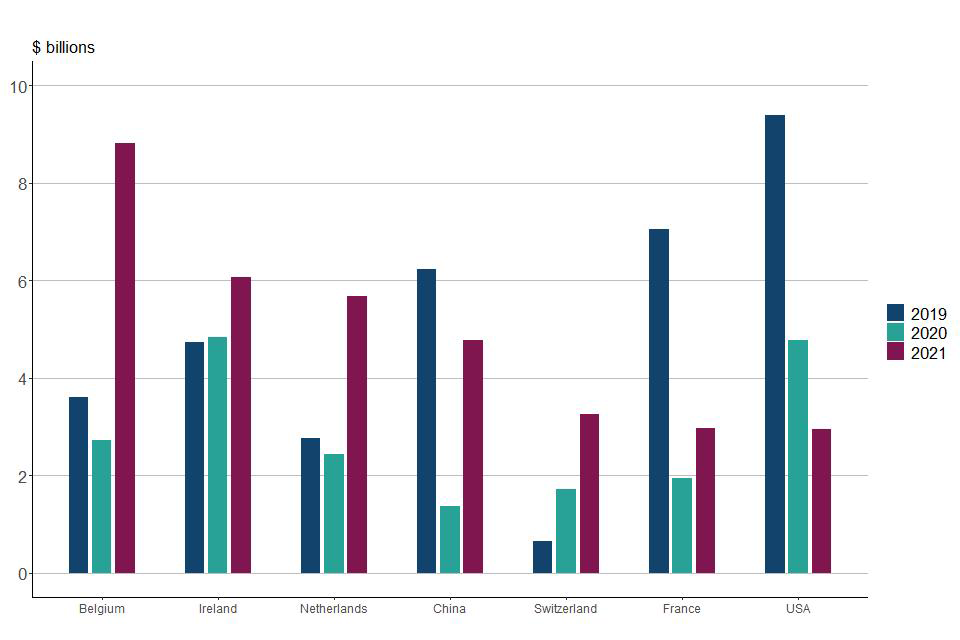
Figure 3: Absolute asymmetry for UK exports from 2019 to 2021 for the top 7 partner countries in 2021
UK Exports Countries
Download Figure 3 detailed data:
Source: HM Revenue & Customs
Figure 3 shows the absolute asymmetry for UK exports from 2019 to 2021 for the top 7 partner countries in 2021. It shows:
- Belgium had the largest absolute asymmetry in 2021 at $8.8 billion
- Ireland at $6.1 billion
- the Netherlands at $5.7 billion
- China at $4.8 billion
- Switzerland at $3.3 billion
- France at $3.0 billion and
- USA at $2.9 billion.
Detailed asymmetries data for UK exports by partner country for 2019 to 2021, including other measures of asymmetry, can be found in Tables 2 a) to 2 c) in the accompanying data set.
Commodities
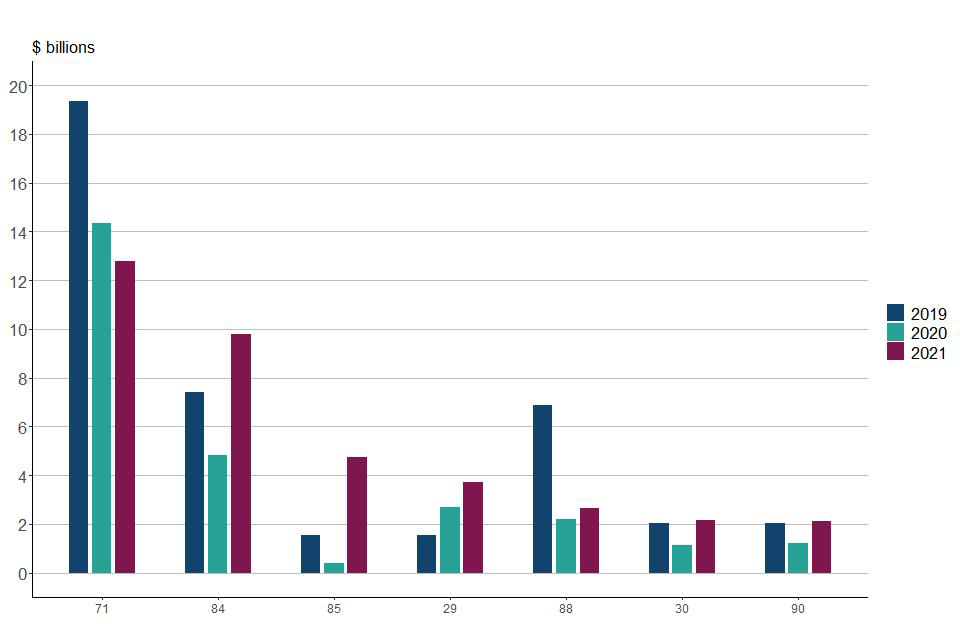
Figure 4: Absolute asymmetry for UK exports from 2019 to 2021 for the top 7 HS2 chapters in 2021
UK Exports HS2
Download Figure 4 detailed data:
Figure 4 shows the absolute asymmetry for UK exports from 2019 to 2021 for the top 7 HS2 chapters in 2021. It shows that:
- Chapter 71: Precious metals had the largest absolute asymmetry in 2021 at $12.8 billion followed by
- Chapter 84: Mechanical appliances at $9.8 billion
- Chapter 85: Electronic equipment at $4.7 billion
- Chapter 29: Organic chemicals at $3.7 billion
- Chapter 88: Aircraft at $2.7 billion
- Chapter 30: Pharmaceutical products at $2.2 billion and
- Chapter 90: Measuring devices and gauges at $2.1 billion.
Detailed asymmetries data for UK exports by HS2 chapter for 2019 to 2021, including other measures of asymmetry, can be found in Tables 4 a) to 4 c) in the accompanying data sets.
Commodities by countries
Detailed asymmetries data for UK imports by partner country and HS2 chapter for 2019 to 2021, including various measures of asymmetry, can be found in Tables 5 a) to 5 c) in the accompanying data set.
Alternatively, Table 7 in the associated data set includes all raw trade in goods data used in this publication by flow, partner country, HS2 chapter and year for 2019 to 2021, including various measures of asymmetry.