Asset recovery statistical bulletin: financial years ending 2017 to 2022
Published 8 September 2022
Applies to England, Northern Ireland and Wales

© Crown copyright 2022
This publication is licensed under the terms of the Open Government Licence v3.0 except where otherwise stated. To view this licence, visit nationalarchives.gov.uk/doc/open-government-licence/version/3 or write to the Information Policy Team, The National Archives, Kew, London TW9 4DU, or email: psi@nationalarchives.gov.uk.
Where we have identified any third party copyright information you will need to obtain permission from the copyright holders concerned.
This publication is available at https://www.gov.uk/government/statistics/asset-recovery-statistical-bulletin-financial-years-ending-2017-to-2022/asset-recovery-statistical-bulletin-financial-years-ending-2017-to-2022
1. The Proceeds of Crime Act 2002
The Proceeds of Crime Act (POCA) 2002 provides the statutory framework used to enable the investigation and prosecution of crimes relating to benefit from criminal conduct; or crimes relating to property obtained through unlawful conduct or which is intended to be used in unlawful conduct. It is also used to deprive criminals of their money or other property connected to criminal activity. POCA can be applied through the following powers: Criminal Confiscation, Civil Forfeiture, Civil Recovery and Taxation. Links to further information on POCA can be found in the Background Information Note.
2. About this release
This release contains Official Statistics on the value and volume of proceeds of crime restrained, seized, frozen and subsequently recovered through Criminal Confiscations, Civil Forfeitures and Civil Recovery powers. It also includes statistics on: (a) the value and volume of proceeds of crime by the associated criminal offence types, (b) the value of compensation paid to victims, (c) the use of funds received by POCA Agencies through the Asset Recovery Incentivisation Scheme (ARIS), (d) the ARIS Allocations distributed to these agencies, and (e) statistics on International Asset Recovery.
The statistics presented in the above sections are presented as nominal values i.e., not adjusted for inflation and any comparisons to previous years do not account for inflation. Further information on accounting for inflation can be found in the Methodology and Data Quality Report.
Links to statistics published by HM Revenue and Customs (HMRC) on the collection of Civil Recovery and Taxation can be found in the Methodology and Data Quality Report.
This release refers to data covering the financial years from 2016 to 2017 until 2021 to 2022, which is the latest period, for the jurisdictions of England and Wales, Northern Ireland and those which have no recorded jurisdiction. This release does not include data covering Scotland.
This release includes data covering the period 1 April 2020 to 31 March 2021, a period when COVID restrictions had an impact across the entire law enforcement, criminal justice, and asset recovery systems, adversely impacting on investigation, prosecution and conviction capacity and capability.
It should be noted there will be variations in the data recorded for each financial year due to revisions made in retrospection of the live administrative Joint Asset Recovery Database (JARD) system. Figures included in the latest statistical release supersede previous officially reported figures. Therefore, any direct comparisons of changes in asset recovery performance should not be made between the latest and previous releases of the Asset Recovery Annual Statistical Bulletin. Statistical information on this is outlined in the Methodology and Data Quality Report and Background Quality Report.
There is additional legislation to POCA which can be used for the detaining and seizure of criminal assets such as the Misuse of Drugs Act 1971 and the Modern Slavery Act 2015. It should be noted that this release does include orders under these Acts.
Data presented on Unexplained Wealth Orders (UWOs) was provided by the National Economic Crime Centre (NECC) in March 2022 for the financial year ending March 2022.
The main changes and additions to the Bulletin are presented in Annex A.
3. Main headlines
£354 million was recovered in total from Confiscation Order, Forfeiture Order and Civil Recovery Order receipts in the financial year 2021 to 2022.
This is the highest figure on record, representing a 61% increase from the 2020 to 2021 and a 69% from 2016 to 2017 based on nominal values i.e., not adjusted for inflation. This increase was driven by a rise in the number of cases where the proceeds of crime recovered were in excess of £1m for both Confiscation Order and Forfeiture Order receipts as shown in Figure 1.
Figure 1: The value of proceeds of crime recovered from Confiscation Orders, Forfeiture Orders and Civil Recovery Orders receipts from financial year 2016 to 2017 until financial year 2021 to 2022 in England and Wales, Northern Ireland jurisdictions and those which have no recorded jurisdiction
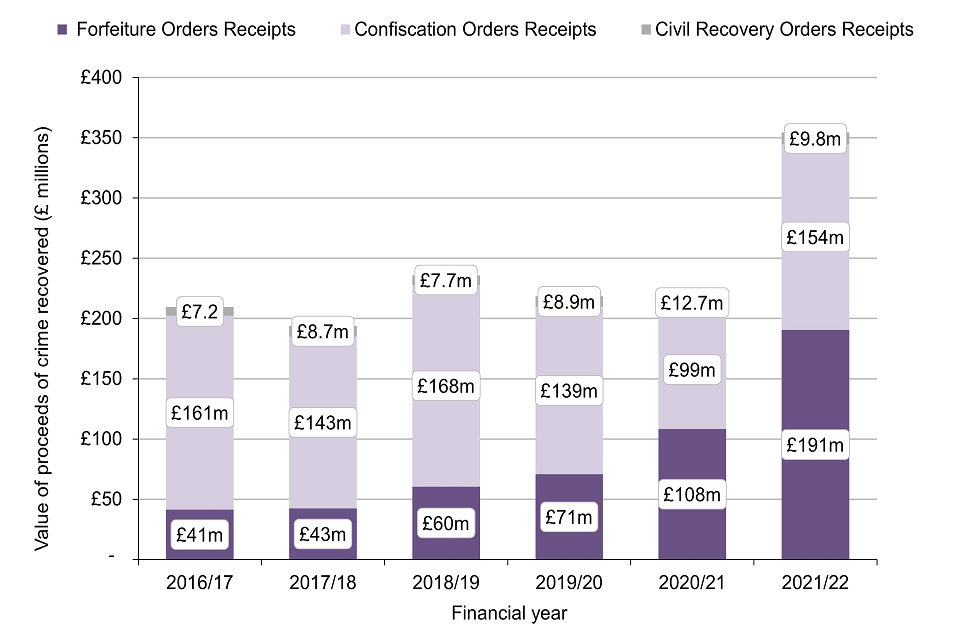
Source: JARD (Confiscation Order and Forfeiture Order receipts) and NCA (Civil Recovery Order receipts)
Notes
- The data presented in Figure 1 represents a breakdown for the total proceeds of crime recovered from Forfeiture Orders, Confiscation Orders and Civil Recovery Order receipts over the previous six financial years, and are based on nominal values i.e., not adjusted for inflation.
Of the £354 million recovered in total from Confiscation Order, Forfeiture Order and Civil Recovery Order receipts in 2021 to 2022:
-
£154 million was recovered through Confiscation Order Receipts, a 56% increase from 2020 to 2021, but only 4% higher than the 6-year median amount recovered based on nominal values i.e., not adjusted for inflation
-
£191 million was recovered through Forfeiture Order Receipts, a 76% increase from 2020 to 2021 and the highest amount recovered in the last six years, explained by high value Account Freezing Orders and Cash Seizures, which reached record highs of £115m and £74.3m respectively, based on nominal values i.e., not adjusted for inflation
-
£9.8 million was recovered through Civil Recovery Order Receipts, a 23% decrease from 2020 to 2021, but 11% higher than the 6-year median amount recovered, based on nominal values i.e., not adjusted for inflation
-
£23 million was paid in compensation to victims from proceeds of crime recovered through Confiscation Order receipts in 2021 to 2022, a 37% increase from 2020 to 2021, but a 27% decrease from the 6-year median, based on nominal values i.e., not adjusted for inflation, which is linked to the overall decline in Confiscation Order Impositions and subsequent receipts which have fallen in the same period
-
£142 million of ARIS funding was distributed to POCA Agencies in 2021 to 2022, a 60% increase from 2020 to 2021, which is mirrored by the overall increase in the proceeds of crime recovered in the same period, based on nominal values i.e., not adjusted for inflation
4. Background information
These statistics are released every year and are produced using data collected on a live operational database, the Joint Asset Recovery Database (JARD). This means data is subject to change as orders are resolved, varied, appealed and new orders are added.
The data presented for Forfeitures includes the amount of assets seized and recovered by way of Cash Seizures, Account Freezing Orders and Listed Asset Seizures. The latter two powers were introduced under the Criminal Finances Act 2017 and came into force from 31 January 2018 together with UWOs. The Account Freezing Orders, Listed Asset Orders and UWOs are available to use in England and Wales, Northern Ireland, and Scotland.
It is important to note data presented in this release for Account Freezing Orders and Listed Asset Orders cover the financial year 2021 to 2022 for Northern Ireland, which is the year these powers came into force in this jurisdiction. These powers were extended to Northern Ireland under the Criminal Finances Act 2017 with effect from 28th June 2021.
Data presented on the proceeds of crime recovered for orders where the main related criminal offence type is Modern Slavery is extracted from JARD and presented in Annex B. It has been provided to support the Modern Slavery Annual Report released in October 2020.
Data presented on Civil Recovery Orders receipts is provided by the National Crime Agency (NCA).
Data presented on the Use of ARIS Funds is taken from a survey managed by Home Office.
Data presented on the ARIS Allocations is provided by a Home Office administrative database.
Data presented on International Cooperation and Asset Return orders is in Annex C and is provided by a Home Office administrative database.
Further information on data sources, data and statistics quality, methodology and adherence to the Code of Practice for Statistics can be found in the accompanying Methodology and Data Quality Report and Background Quality Report.
Information on the definitions for different civil and criminal POCA powers can be found in the accompanying Background Information Note.
5. The proceeds of crime restrained, imposed and recovered through Criminal Confiscation Powers and Civil Powers
The asset recovery powers in POCA used to deprive and recover the proceeds of crime, or other property connected to criminal activity, can be applied through criminal confiscation and Civil Powers such as Forfeiture Powers and Civil Recovery Orders.
Part 2 of POCA makes provision for the confiscation of a person’s benefit from criminal conduct, following a criminal conviction. If the relevant statutory conditions are satisfied, the court must decide the recoverable amount for that person and make an order (a Confiscation Order) requiring them to pay that amount.
This section provides a summary of the statistics on the value and volume of the proceeds of crime restrained and imposed, and the value of proceeds of crime recovered under the POCA powers through criminal confiscation as follows:
- Restraint Orders
- Confiscation Order Impositions
- Confiscation Order Receipts
Figure 2 provides an overview of the asset recovery system, with a particular focus on the proceeds of crime restrained, imposed and recovered through Criminal Confiscation POCA powers.
This section also provides a summary of the statistics on the value and volume of the proceeds of crime seized and frozen and recovered (forfeited) under the POCA powers for Forfeitures as follows:
- the value and volume of proceeds of crime seized and frozen through all Seizure sub-type Forfeiture powers
- the value and volume of proceeds of crime recovered from Forfeiture Order receipts and through all Seizure sub-type Forfeiture Order powers
Forfeiture powers enable the seizure, freezing and forfeiture of cash, monies in relevant accounts or listed assets, which is determined to be or to represent property obtained through unlawful conduct or property intended for use by any person in unlawful conduct.
Civil Recovery Orders enable an enforcement authority to recover property which is determined to be or to represent property obtained through unlawful conduct. Applications are made in civil proceedings before the High Court. This section provides a summary of the statistics on the value of the proceeds of crime recovered under the POCA powers for Civil Recovery Order receipts. Please note that splits by value and volume have not been provided for Civil Recovery Order receipts because there is no available data.
Figure 2 below provides an overview of the asset recovery system, with a particular focus on the proceeds of crime restrained, imposed and recovered through Criminal Confiscation POCA powers and Civil Forfeiture POCA powers.
Please note that for Civil Forfeiture POCA Powers there has been a change in the methodology used in this statistical release for the value and volume of proceeds of crime: (a) seized and frozen through Cash Seizure, Account Freezing Orders and Listed Assets, and (b) recovered through Forfeiture Order receipts. Further details of these changes are written in the Methodology and Data Quality Report in the Main Methodology Changes section, which also explains why comparisons between this release and previous releases should be avoided.
Figure 2: Overview of the asset recovery system and the corresponding statistics for each stage of the process in the financial year 2021 to 2022 in England and Wales, Northern Ireland and those which have no recorded jurisdiction
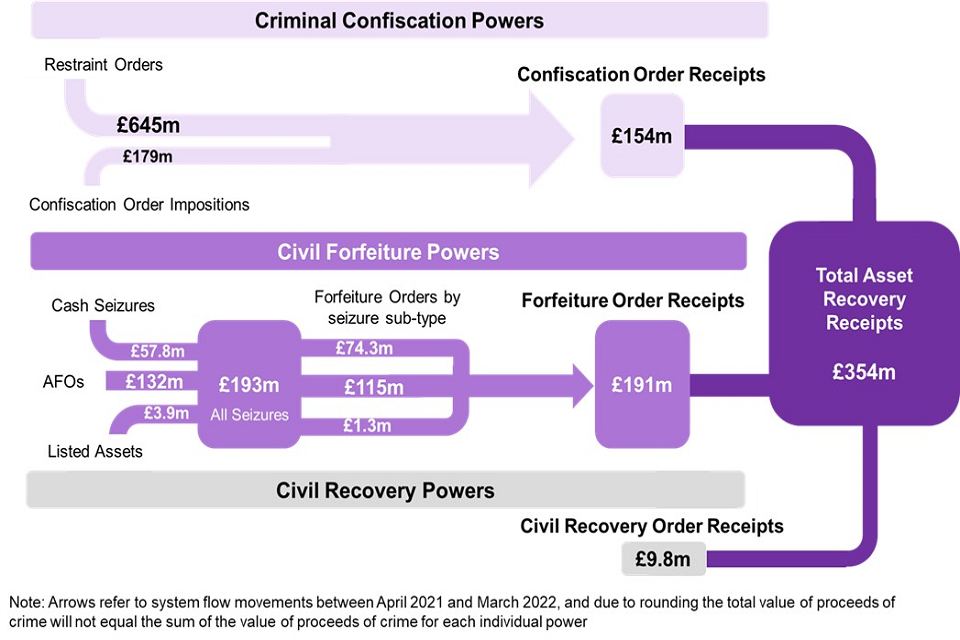
Source: JARD
Notes
-
Data presented in Figure 2 includes the proceeds of crime restrained, imposed, seized and recovered under POCA powers in the financial year 2021 to 2022.
-
The figure presented in Figure 2 for Total Asset Recovery Receipts, represents the total value for the proceeds of crime recovered through Confiscation Orders, Forfeiture Orders and Civil Recovery Order receipts.
-
A proportion of Total Asset Recovery Receipts will relate to Restraint Orders, Confiscation Order Impositions and All Seizures made in previous years while some proceeds of crime not recovered that were restrained or seized may be subsequently released or returned to the individual if their legitimacy is subsequently proven.
-
The data presented in Figure 2 are based on nominal values i.e., not adjusted for inflation.
-
£645m of Restraint Orders were granted in 2021 to 2022, based on nominal values, not adjusted for inflation, which can be explained by several high value cases (processed within the same financial year) that were linked to operations led by Local Police Forces and Regional Police Forces
-
£179m was imposed from Confiscation Order Impositions in 2021 to 2022, a 29% increase from 2020 to 2021 but slightly lower (3%) than the 6-year median of £186m, based on nominal values, which is linked to the steady long-term decline in the volume of orders imposed
-
£154m of proceeds of crime was recovered through Confiscation Order receipts in 2021 to 2022, based on nominal values, and can be explained by several high value orders which arose within the same financial year
-
£193m was seized and frozen from Cash Seizures, AFOs and Listed Asset Orders in 2021 to 2022, which is 6% above the 6-year median of £182m and can be explained by the increase in the proceeds of crime seized under Account Freezing Orders, based on nominal values
-
£191m of proceeds of crime was recovered through Forfeiture Order receipts 2021 to 2022, based on nominal values, which can be explained by several high value cases processed under Account Freezing Orders within this financial year
5.1 Restraint Orders
Figure 3: Restraint Orders – values from financial year 2016 to 2017 until financial year 2021 to 2022, in England and Wales, Northern Ireland and those which have no recorded jurisdiction
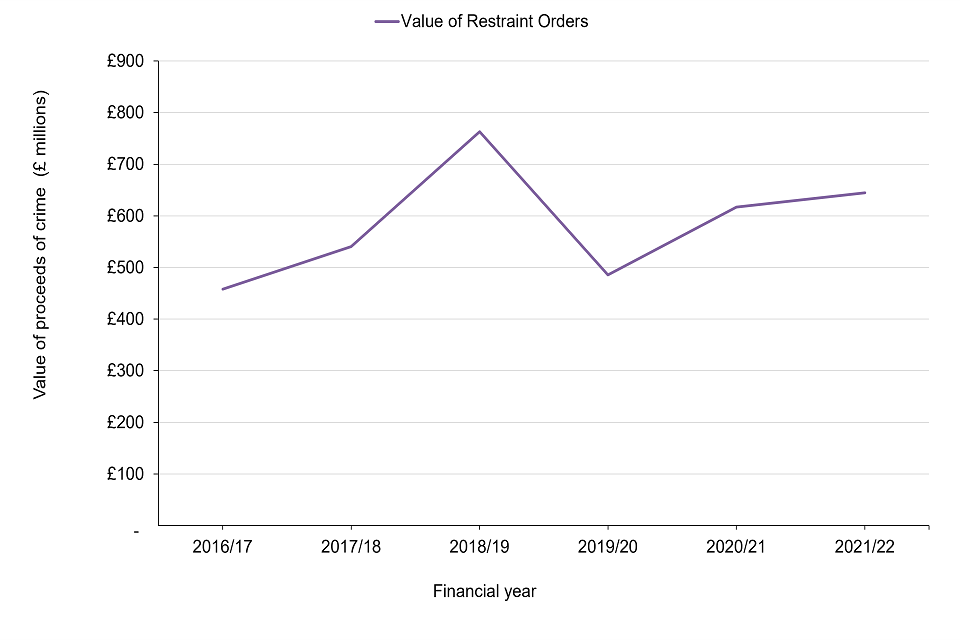
Source: JARD
Notes
-
Data presented in Figure 3 includes proceeds of crime that are restrained and cannot be accessed by the defendant whilst confiscation proceedings and enforcement are ongoing. Restraint is an optional power and not all proceeds of crime recovered at the end of the criminal proceedings will have been subject to a Restraint Order earlier in the process.
-
There is therefore no direct comparison between the value of subject to a Restraint Order and the amounts successfully recovered as Confiscation Order receipts. Users should be cautious when making comparisons between the data reported for Restraint Orders and Confiscation Orders Impositions for this reason.
-
The data presented in Figure 3 are based on nominal values i.e., not adjusted for inflation.
£645m was restrained from Restraint Orders in 2021 to 2022, a 5% increase from £617m in 2020 to 2021, and a 41% increase from £458m since 2016 to 2017, based on nominal values i.e., not adjusted for inflation.
As shown in Figure 3, excluding the peak in 2018 to 2019 there has been a gradual trend of steady growth in the value of Restraint Orders, with 2021 to 2022 being 11% above the 6-year median of £579m (based on nominal values), due to several high value orders worth £477m. This improved performance can be explained by several cases involving the restraint of proceeds of crime in excess of £1m in 2021 to 2022.
The peak in 2018 to 2019 relates to a single high value order which was worth almost half of the proceeds of crime restrained within the same year.
Restraint Orders’ Value by primary offence type
In 2021 to 2022 the value of Restraint Orders associated with Fraud related offences was £328m, accounting for 51% of the total value for Restraint Orders, compared to 39% (£242m) in the previous financial year. Drugs related offences and Money Laundering related offences contributed £129m (20%) and £88.1m (14%) respectively this year.
Fraud related offences have been the most prominent primary offence type for Restraint Orders for the last six financial years, accounting for £1.9bn (54%) of the £3.5bn total value of Restraint Orders over this period. This mostly came from 156 high value Restraint Orders worth approximately £1.6bn.
Please note the comparisons above are based on nominal values i.e., not adjusted for inflation.
Restraint Orders’ Value by agency sector
In 2021 to 2022 the value of Restraint Orders from Local Police Forces was £233m, accounting for 36% of the total value for Restraint Orders, a negligible change proportion-wise from the previous financial year. Large POCA Agencies and Regional Police Forces contributed £183m (28%) and £171m (27%) respectively this year.
Local Police Forces have remained the most prominent agency sector over the last six financial years, accounting for 42% of proceeds of crime restrained in 2016 to 2017.
Please note the comparisons above are based on nominal values i.e., not adjusted for inflation.
Figure 4: Restraint Orders – volumes from financial year 2016 to 2017 until financial year 2021 to 2022, in England and Wales, Northern Ireland and those which have no recorded jurisdiction
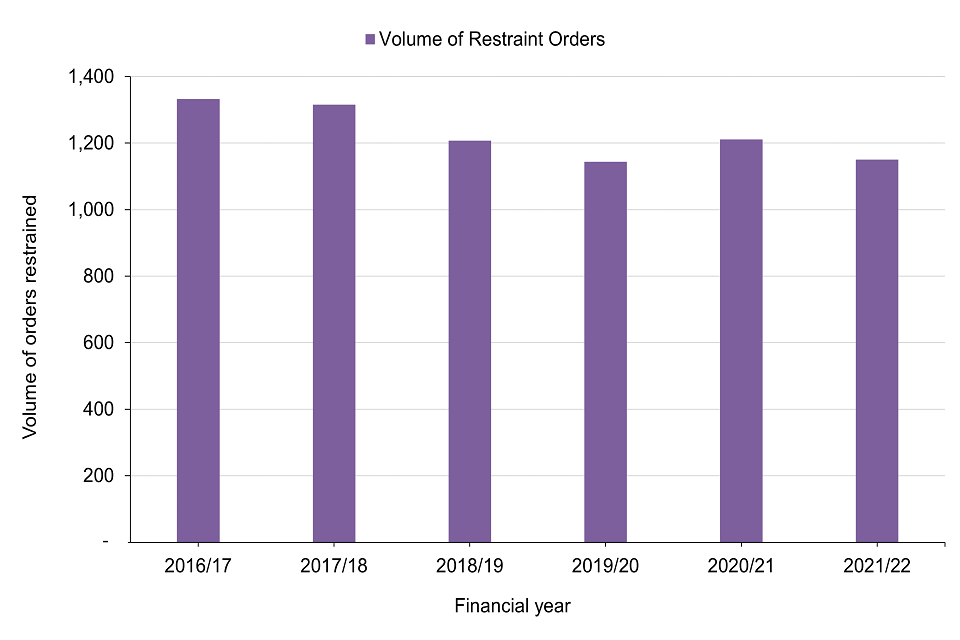
Source: JARD
Notes
-
Data presented in Figure 4 includes the number of orders where proceeds of crime were restrained and cannot be disposed of by the owner whilst confiscation proceedings and enforcement are ongoing. It does not reflect the overall number of confiscation orders made (impositions) at the end of the criminal proceedings.
-
Restraint Orders do not reflect the proceeds of crime recovered at the end of the criminal proceedings. Confiscation Orders can be imposed without having a previous Restraint Order. There is therefore no direct comparison between the volume of Restraint Orders and the volumes of Confiscation Order. Users should be cautious when making comparisons between the data reported for Restraint Orders and Confiscation Orders Impositions for this reason.
1,200 Restraint Orders were granted in 2021 to 2022, a slight (5%) decrease from 1,200 in the previous financial year and a 14% decrease from 1,300 in 2016 to 2017.
As shown in Figure 4 since 2016 to 2017, there has been a gradual fall in the number of Restraint Orders, although this has plateaued in the last four years with the number of Restraint Orders in 2021 to 2022 being only slightly lower (5%) than the 6-year median number of orders processed.
Restraint Orders’ Volumes by primary offence type
In 2021 to 2022, 630 Restraint Orders were associated with Drugs related offences, accounting for 55% of total Restraint Orders, showing no change proportion-wise from the previous financial year. Fraud related offences and Other related offences accounted for 300 orders (26%) and 70 orders (6%) respectively this year.
Drug related criminal offences have remained the most prominent primary offence type over the last six financial years, accounting for 35% of Restraint Orders in 2016 to 2017.
Restraint Orders’ Volumes by agency sector
In 2021 to 2022, 730 Restraint Orders (63%) were associated with Local Police Forces compared to 1,200 (66%) in the previous financial year. Regional Police Forces and Large POCA Agencies accounted for 240 orders (21%) and 80 orders (7%) respectively this year.
Local Police Forces have remained the most prominent agency sector over the last six financial years, accounting for 66% of Restraint Orders in 2016 to 2017.
5.2 Confiscation Order Impositions
Figure 5: Confiscation Order Impositions – values from financial year 2016 to 2017 until financial year 2021 to 2022, in England and Wales, Northern Ireland and those which have no recorded jurisdiction
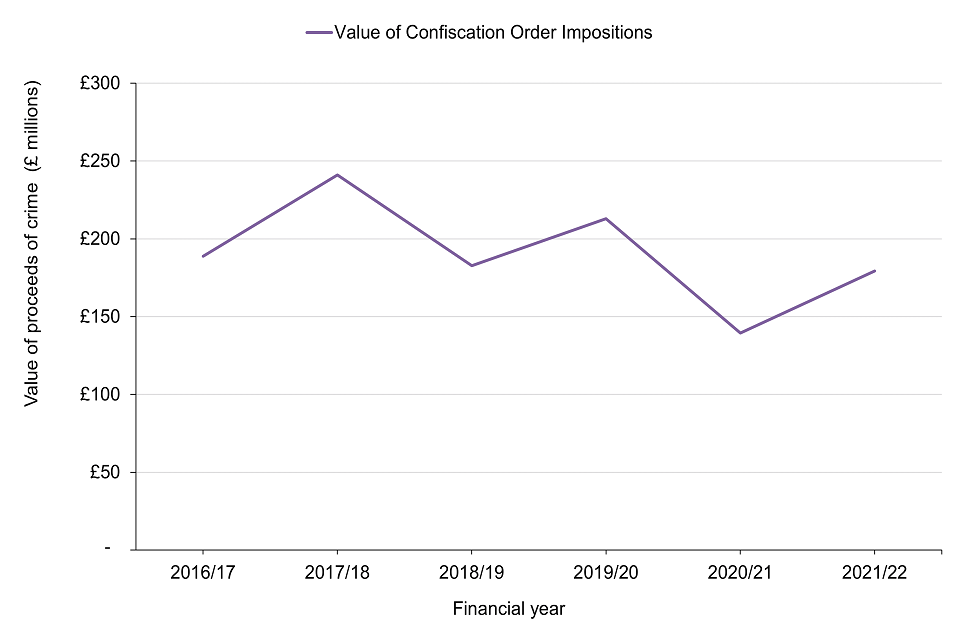
Source: JARD
Notes
-
Data presented in Figure 5 includes proceeds of crime, which the defendant is ordered to pay back to the court. It does not reflect the proceeds of crime which are subsequently recovered through enforcement action and payments.
-
The data presented in Figure 5 are based on nominal values i.e., not adjusted for inflation.
£179m of Confiscation Orders were imposed in 2021 to 2022, a 29% increase from £139m in the previous financial year and a 5% decrease from £188m since 2016 to 2017, based on nominal values i.e., not adjusted for inflation.
As shown in Figure 5, there has been a steady decline in the value of Confiscation Order Impositions, with 2021 to 2022 being 3% below the 6-year median of £186m (based on nominal values).
The lowest trough in 2020 to 2021 could be linked to the restrictions introduced in the COVID-19 pandemic which affected law enforcement, criminal justice, and asset recovery systems.
Confiscation Order Impositions’ Value by primary offence type
In 2021 to 2022 the value of Confiscation Order Impositions associated with Other related offences was £54.3m, accounting for 30% of the total value for Confiscation Order Impositions compared to 12% (£16.9m) in the previous financial year. Money Laundering related offences and Fraud related offences contributed £46.0m (26%) and £44.3m (25%) respectively this year.
Excluding 2020 to 2021 and 2021 to 2022, in the last six financial years Impositions associated with Fraud related offences had the most value compared to other primary offence types.
Please note the comparisons above are based on nominal values i.e., not adjusted for inflation.
Confiscation Order Impositions’ Value by agency sector
In 2021 to 2022 the value of Confiscation Order Impositions from Small-medium POCA Agencies was £52.0m, accounting for 29% of the total value for Confiscation Order Impositions, compared to 13% (£18.2m) in the previous financial year. Large POCA Agencies and Local Police Forces contributed £51.3m (29%) and £51.1m (28%) respectively.
Except for 2020 to 2021, in the last six financial years Impositions from Local Police Forces had the most value compared to other agency sectors.
Please note the comparisons above are based on nominal values i.e., not adjusted for inflation.
Figure 6: Confiscation Order Impositions – volumes from financial year 2016 to 2017 until financial year 2021 to 2022, in England and Wales, Northern Ireland and those which have no recorded jurisdiction
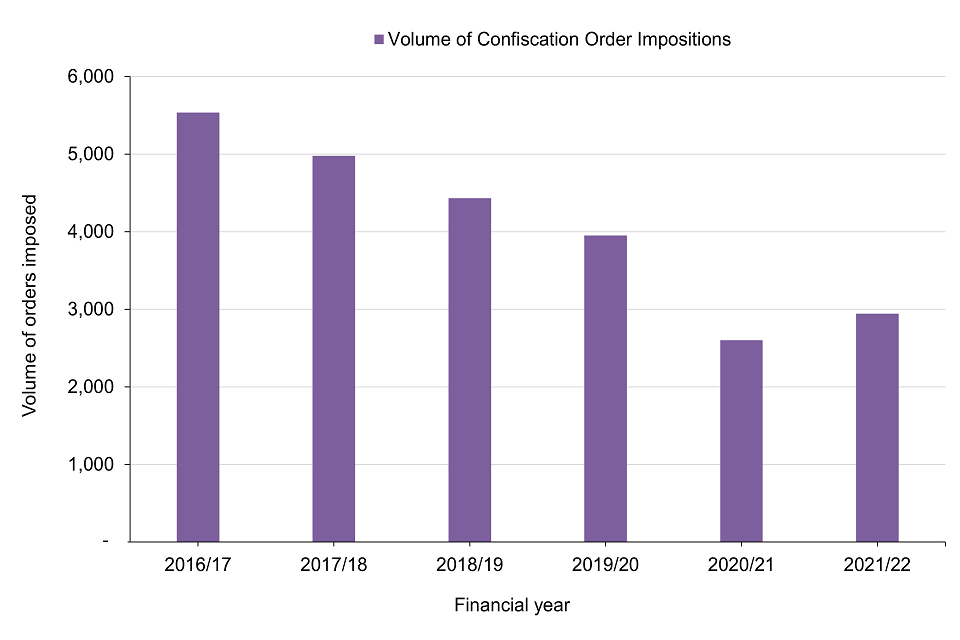
Source: JARD
Notes
- Data presented in Figure 6 includes proceeds of crime which the defendant is ordered to pay back to the court. It does not reflect the proceeds of crime which are subsequently recovered through enforcement action and payments.
2,900 Confiscation Orders were imposed 2021 to 2022, rising by 13% from 2,600 in the previous financial year but falling by 47% from 5,500 in 2016 to 2017.
As shown in Figure 6, except for the slight increase in 2021 to 2022 there has been a gradual year on year fall in Confiscation Order Impositions over the last six financial years, with Confiscation Order Impositions granted in 2021 to 2022 being 30% lower than the median number of orders processed over the previous six financial years (4,200).
Confiscation Order Impositions’ Volumes by primary offence type
In 2021 to 2022, 1,900 Confiscation Orders Impositions were associated with Drugs related offences, accounting for 65% of total Confiscation Order Impositions this year, increasing slightly proportion-wise from 60% in the previous financial year. Fraud related offences and Theft related offences accounted for 510 orders (17%) and 220 orders (8%) respectively this year.
Drugs related criminal offences have remained the most prominent primary offence type over the last six financial years, accounting for 57% of total Confiscation Order Impositions in 2016 to 2017.
Confiscation Order Impositions’ Volumes by agency sector
In 2021 to 2022, 2,400 Confiscation Order Impositions (80%) were associated with Local Police Forces, increasing slightly from 76% in the previous financial year. Regional Police Forces and Large POCA Agencies accounted for 300 impositions (10%) and 100 impositions (3%) respectively this year.
Local Police Forces have remained the most prominent agency sector over the last six financial years, accounting for 73% (5,500) of total Confiscation Order Impositions in 2016 to 2017.
5.3 Confiscation Order receipts
Figure 7: Confiscation Orders Receipts – values from financial year 2016 to 2017 until financial year 2021 to 2022, in England and Wales, Northern Ireland and those which have no recorded jurisdiction
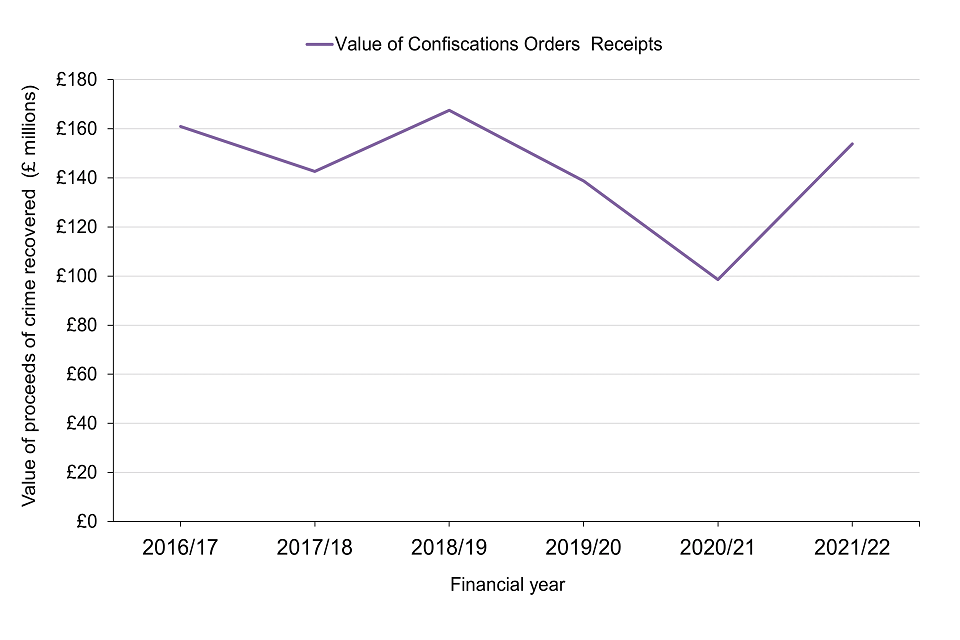
Source: JARD
Notes
-
Figure 7 shows the value of proceeds of crime recovered (paid against Confiscation Order Impositions) from the defendant following the end of criminal proceedings. It includes payments received from the defendant on any outstanding Confiscation Orders which means it can include payments linked to a Confiscation Order Imposition in the current financial year and previous ones.
-
The data presented in Figure 7 are based on nominal values i.e., not adjusted for inflation.
£154m was recovered from Confiscation Order Receipts in 2021 to 2022, a 56% increase from £98.6m the previous financial year and a 4% decrease from £161m in 2016 to 2017, based on nominal values i.e., not adjusted for inflation.
As shown in Figure 7, there has been a decline in the value of proceeds of crime recovered from Confiscation Order Receipts since 2016 to 2017, with 2021 to 2022 being 4% below the 6-year median of £148m (based on nominal values).
The introduction of COVID-19 restrictions in 2020 to 2021 had a negative impact on the entire asset recovery systems which resulted in impacts on the investigation, prosecution and conviction capacity and capability. This in turn also impacted Confiscation Order Impositions and Confiscation Order Receipts in 2021 to 2022.
Confiscation Order Receipts’ Value by primary offence type
In 2021 to 2022 Confiscation Order Receipts associated with Other related offences was £57.0m, accounting for 37% of total Confiscation Order Receipts, a substantial increase from £14.4m (accounting for 14%) in the previous financial year. Fraud related offences and Drugs related offences contributed £42.0m (27%) and £34.2m (22%) respectively this year.
Except for 2021 to 2022, in the last six financial years Confiscation Order receipts associated with Fraud related offences had the most value compared to other primary offence types.
Please note the comparisons above are based on nominal values i.e., not adjusted for inflation.
Confiscation Order Receipts’ Value by agency sector
In 2021 to 2022 Confiscation Order Receipts from Local Police Forces was £56.2m, accounting for 37% of total Confiscation Order Receipts this year, and £47.7m (accounting for 48%) in the previous financial year. Small-medium POCA Agencies and Large POCA Agencies contributed £52.1m (34%) and £19.7m (13%) respectively this year.
Local Police Forces have remained the most prominent agency sector over the last six financial years, accounting for £78.5m (49%) of Confiscation Orders Receipts in 2016 to 2017.
Please note the comparisons above are based on nominal values i.e., not adjusted for inflation.
Data note on Confiscation Order Receipts
The measure for the volume of proceeds of crime recovered from Confiscation Orders Receipts is not reported in this release due to limitations with JARD data. Further information on this is available in the Methodology and Data Quality report.
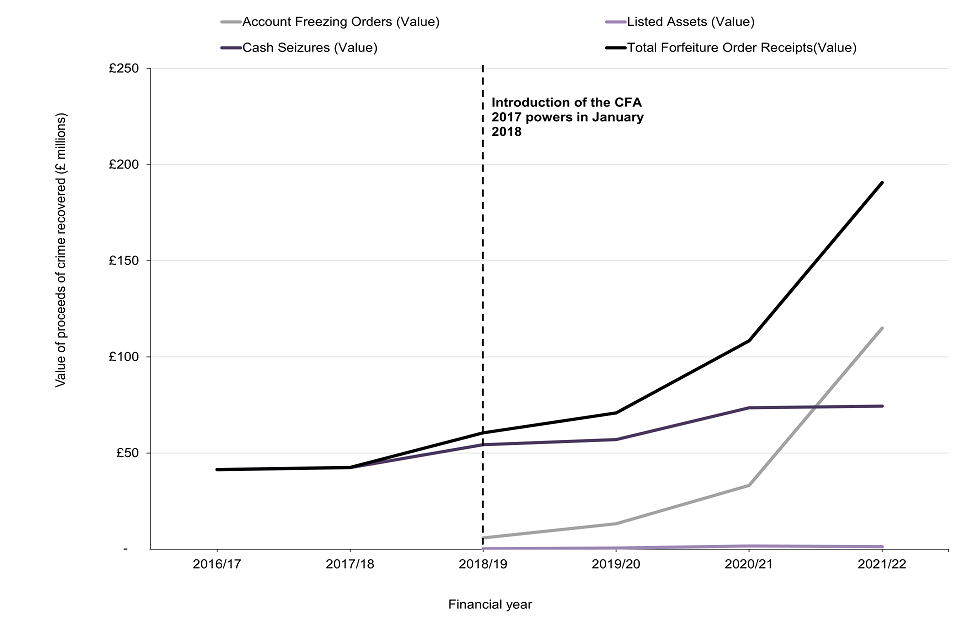
6. Proceeds of crime seized, frozen and recovered through Civil Forfeiture Powers
6.1 The value of proceeds of crime seized and frozen through all Seizure sub-types
Figure 8: The value of proceeds of crime seized and frozen under all Seizure sub-types from financial year 2016 to 2017 until financial year 2021 to 2022, in England and Wales, Northern Ireland and those which have no recorded jurisdiction
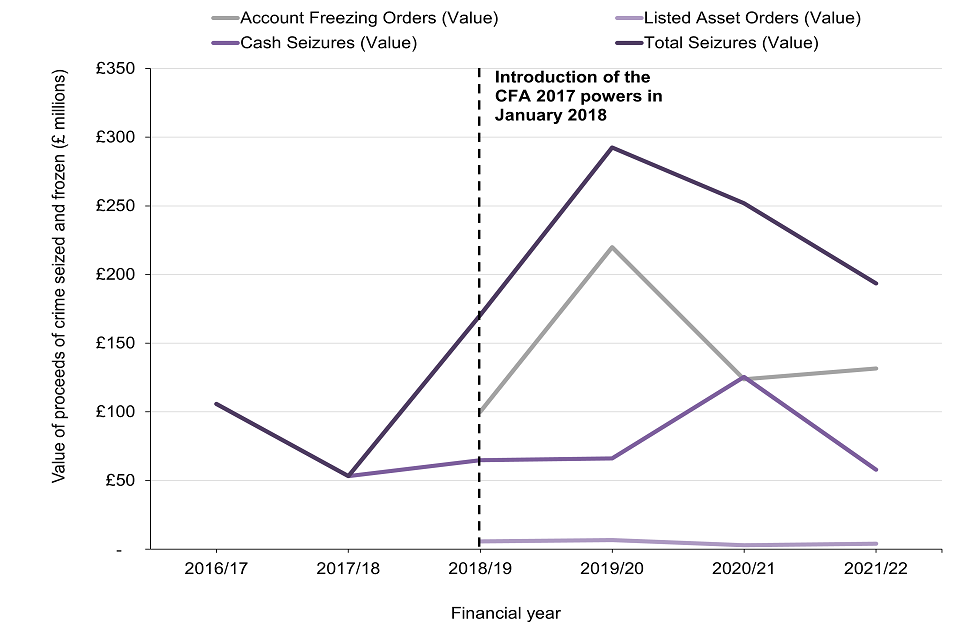
Source: JARD
Notes
-
Data presented in Figure 8 shows the value of assets or proceeds of crime seized (cash, listed assets) and frozen (account freezing orders) that cannot be accessed by the respondent whilst the investigation is undertaken (subject to exclusions, for example, to carry on any trade, business, profession or occupation). It does not reflect the proceeds of crime which are recovered at the end of the investigation.
-
These powers can only be used where assets or proceeds of crime are worth more than the prescribed minimum amount, currently set at £1,000.
-
The data presented in Figure 8 are based on nominal values i.e., not adjusted for inflation.
Since 2016 to 2017 a total of £1.1bn of proceeds of crime have been seized and frozen using seizure powers (based on nominal values i.e., not adjusting for inflation), with Account Freezing Orders generally being the most prominent sub type since 2018 to 2019.
In 2021 to 2022, £193m was seized and frozen under all seizure sub-types, a 23% decrease from the previous financial year (based on nominal values). Of these:
- £132m (68%) was from Account Freezing Orders, compared to £124m (49%) in the previous financial year, based on nominal values
- £57.9m (30%) was from Cash Seizures, compared to £125m (50%) in the previous financial year, based on nominal values
- £3.9m (2%) was from Listed Assets, compared to £2.8m (1%) in the previous financial year, based on nominal values
As shown in Figure 8, there was a steep increase in the total proceeds of crime seized and frozen until 2019 to 2020 which reached a peak of £292m (based on nominal values). The peak was driven by 28 high value seizures under Account Freezing Orders seizure sub type worth £168m, (based on nominal values), which accounted for 57% of proceeds of crime seized and frozen within that year.
After 2019 to 2020 there was a decline in the total amount seized and frozen, but Cash Seizures as a sub type had a record year at £125m (based on nominal values), which was due to a high value operation that year. Despite the decline in the total amount seized and frozen from the previous financial year, the total amount seized and frozen in 2021 to 2022 is 6% higher than the median value for the previous six financial years (£182m) (based on nominal values).
Seizures’ Value by primary offence type
In 2021 to 2022 the value of all Seizures associated with Money Laundering related offences was £101m, accounting for 52% of the total value for all Seizures, compared to £147m (accounting for 58%) in the previous financial year. Other related offences and Drug related offences contributed £36.2m (19%) and £32.4m (17%) respectively this year.
Excluding 2019 to 2020, Money Laundering related offences have remained the most prominent primary offence type for all Seizure sub-types over the last six financial years, accounting for £537m (50%) of the £1.1bn total value of proceeds of crime seized and frozen over this period.
This is partly due to recording practices as POCA Agencies often default to recording seizures as money laundering as a catch-all for illicit finances or because the assets relate to a range of criminal conduct.
Please note the comparisons above are based on nominal values i.e., not adjusted for inflation.
Seizures’ Value by agency sector
In 2021 to 2022 the value of all Seizures from Local Police Forces was £103m, accounting for 53% of the total value for all Seizures, compared to £137m (54%) in the previous financial year. Large POCA Agencies and Regional Police Forces contributed £63.4m (33%) and £21.8m (11%) respectively this year.
Except for 2019 to 2020, Local Police Forces have remained the most prominent agency sector over the last six financial years, accounting for £504m (47%) of proceeds of crime seized and frozen over this period.
Please note the comparisons above are based on nominal values i.e., not adjusted for inflation.
Figure 9: The volume of proceeds of crime seized and frozen under All Seizure Sub-types from the financial year 2016 to 2017 until financial year 2021 to 2022, in England and Wales, Northern Ireland and those which have no recorded jurisdiction
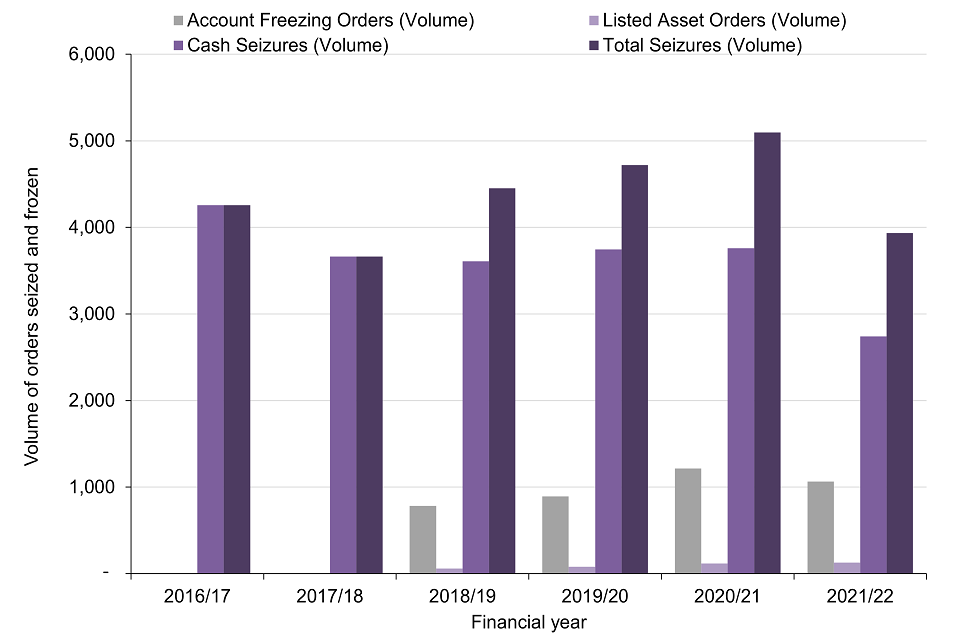
Source: JARD
Notes
- These powers can only be used where assets or proceeds of crime are worth more than the prescribed minimum amount currently set at £1,000.
3,900 Seizures were processed 2021 to 2022, falling by 23% from 5,100 in the previous financial year and by 29% from 2,900 in 2018 to 2019.
The Seizure sub-type breakdown of Seizures in the financial year 2021 to 2022 is:
- 2,700 orders (70%) were associated with Cash Seizures, compared to 3,800 orders (74%) in the previous financial year
- 1,100 orders (27%) were associated with Account Freezing Orders, compared to 1,200 orders (24%) in the previous financial year
- 130 orders (3%) were associated with Listed Asset Orders, compared to 120 orders (2%) in the previous financial year
As shown in Figure 9 the total number of Seizures increased until 2020 to 2021, and then declined in 2021 to 2022. The total number of Seizures in 2021 to 2022 is 10% lower than the median number of total Seizures for the previous six financial years (4,400 orders).
Cash Seizures have remained the most prominent Seizure sub-type over the last six financial years, accounting for 81% of Seizures in 2018 to 2019 when Account Freezing Orders and Listed Assets came into force under the Criminal Finances Act 2017.
Seizures’ Volumes by primary offence type
In 2021 to 2022, 2,000 Seizures were associated with Drugs related offences, accounting for 50% of total Seizures, a negligible fall from 2,700 (53%) in the previous year. Money Laundering related offences and Other related offences accounted for 1,110 seizures (28%) and 400 seizures (10%) respectively this year.
Drugs related offences have remained the most prominent primary offence type for all Seizures over the last six financial years, accounting for 57% of Seizures in 2016 to 2017.
Seizures’ Volumes by agency sector
In 2021 to 2022, 2,800 Seizures (71%) were associated with Local Police Forces, compared to 3,700 (72%) in the previous financial year. Regional Police Forces and Large POCA Agencies accounted for 520 Seizures (13%) and 510 Seizures (13%) respectively.
Local Police Forces have remained the most prominent agency sector over the last six financial years, accounting for 78% of all Seizures processed in 2016 to 2017.
6.2 Forfeiture Order receipts
COVID restrictions that were introduced in the financial year 2020 to 2021 and continued into the following year had an adverse impact on asset recovery performance across investigation, prosecution, conviction and enforcement capacity and capability. Please note these restrictions will have affected some of the statistics in this report.
The definition for Forfeiture Order sub-types can be found in the Background and Information Note in the ‘Definitions of POCA Powers’ section.
Figure 10: The value of Forfeiture Order receipts (total and sub-types) from the financial year 2016 to 2017 until financial year 2021 to 2022, in England and Wales, Northern Ireland and those which have no recorded jurisdiction
Source: JARD
Notes
-
Data presented Figure 10 shows the proceeds of crime recovered at the end of an investigation from the respondent. It includes proceeds of crime recovered on any outstanding Forfeiture Order which means proceeds recovered could be linked to a seizure from a previous financial year.
-
These powers can only be used where assets or proceeds of crime are worth more than the prescribed minimum amount currently set at £1,000.
-
Note that the total sum for Forfeiture Order receipts by sub-type includes seizures where the sub-type was not recorded or specified on JARD.
-
The data presented in Figure 10 are based on nominal values i.e., not adjusted for inflation.
Since 2016 to 2017 a total of £514m of proceeds of crime have been recovered using Forfeiture powers, based on nominal values i.e., not adjusted for inflation. This has mostly been driven by Cash Seizures, with Account Freezing Orders surpassing Cash Seizures in 2021 to 2022.
In 2021 to 2022, £191m was recovered under Forfeiture Orders, the highest ever recorded and an increase of 76% from £110m in 2020 to 2021 (based on nominal values). Of these:
-
a record high of £74.3m (39%) was from Cash Seizures, compared to £73.6m (68%) in the previous financial year due to several high value cases worth £6.6m, based on nominal values
-
a record high of £115m (60%) was from Account Freezing Orders compared to £33.1m (31%) in the previous financial year due to several high value cases worth £93.5m, based on nominal values
-
£1.3m (1%) was from Listed Assets compared to £1.6m (2%) in the previous financial year, based on nominal values
As shown in Figure 10, there has been a steady increase in the value of Forfeiture Orders Receipts over the last six financial years, with an accelerated growth in 2021 to 2022, which is 190% higher than the median value for the previous six financial years (£65.7m).
The peak in 2021 to 2022 was driven by 19 high value orders under the Cash Seizure and Account Freezing Order sub-types worth £100m (based on nominal values), which accounted for 52% of Forfeiture Order receipts in that year. These orders were predominately linked to the seizure of proceeds of crime within the same financial year.
Forfeiture Order Receipts’ Value by primary offence type
In 2021 to 2022, Forfeiture Order Receipts associated with Money Laundering related offences was £112.0m, accounting for 59% of total Forfeiture Order Receipts, compared to £62.4m (58%) in the previous financial year. Other related offences and Drugs related offences contributed £35.4m (19%) and £28.0m (15%) respectively this year.
Money Laundering related offences have remained the most prominent primary offence type for Forfeiture Orders Receipts over the last six financial years, accounting for £22.0m (53%) of proceeds of crime recovered in 2016 to 2017 and £308m (60%) of the £514m total value of Forfeiture Orders Receipts over the six-year period.
This is partly due to recording practices as POCA Agencies often default to recording orders as money laundering as a catch all for illicit finances or because the assets relate to a range of criminal conduct.
Please note the comparisons above are based on nominal values i.e., not adjusted for inflation.
Forfeiture Order Receipts’ Value by agency sector
In 2021 to 2022, Forfeiture Order Receipts from Local Police Forces was £99.9m, accounting for 52% of total Forfeiture Order Receipts compared to £48.0m (44%) in the previous financial year. Large POCA Agencies and Regional Police Forces contributed £78.4m (41%) and £10.7m (6%) respectively.
Except for 2018 to 2019 and 2019 to 2020, Local Police Forces have remained the most prominent agency sector over the last six financial years, accounting for £24.0m (58%) of proceeds of crime recovered from Forfeiture Orders in 2016 to 2017.
In 2018 to 2019 and 2019 to 2020, Large POCA Agencies were the most prominent agency sector, accounting for 51% (£30.6m) and 49% (£34.9m) of the proceeds of crime recovered from Forfeiture Orders respectively.
Please note the comparisons above are based on nominal values i.e., not adjusted for inflation.
Figure 11: The volumes of Forfeiture Order receipts (total and by sub-types) from the financial year 2016 to 2017 until financial year 2021 to 2022, in England and Wales, Northern Ireland and those which have no recorded jurisdiction
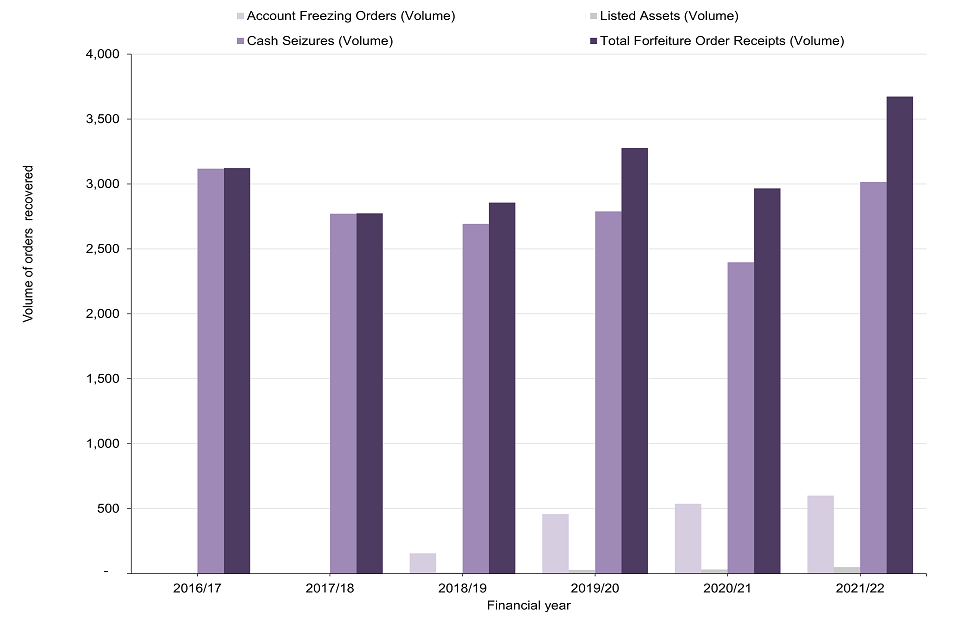
Source: JARD
Notes
-
Data presented Figure 11 shows the proceeds of crime recovered at the end of an investigation from the respondent. It includes proceeds of crime recovered on any outstanding Forfeiture Order which means proceeds recovered could be linked to a seizure from a previous financial year.
-
These powers can only be used where assets or proceeds of crime are worth more than the prescribed minimum amount currently set at £1,000.
-
Note that the total sum for Forfeiture Order receipts by sub-type includes seizures where the sub-type was not recorded or specified on JARD.
3,700 Forfeiture Orders were recovered 2021 to 2022, the highest level in the last six financial years, representing an increase of 24% from 3,000 in 2020 to 2021.
Of these:
- 3,000 orders (82%) were Cash Seizures, compared to 2,400 orders (81%) in the previous financial year
- 600 orders (16%) were Account Freezing Orders, compared to 540 orders (18%) in the previous financial year
- 50 orders (1%) were Listed Asset Orders, compared to 30 orders (1%) in the previous financial year
As Figure 11 shows, except for 2017 to 2018 and 2020 to 2021 there has been an increase in the number of Forfeiture Orders over the last six financial years with Orders in 2021 to 2022 being 21% higher than the 6-year median of 3,000 orders.
Cash Seizures have remained the most prominent sub-type Order over the last six financial years.
Forfeiture Orders’ Volume by primary offence type
In 2021 to 2022, 2,100 Forfeiture Orders were associated with Drugs related offences, accounting for 58% of total Seizures, compared to 1,600 Orders (53%) in the previous financial year. Money Laundering related offences and Other related offences accounted for 900 orders (24%) and 310 orders (8%) respectively this year.
Drugs related offences have remained the most prominent primary offence type for Forfeiture Orders over the last six financial years.
Forfeiture Orders’ Volume by agency sector
In 2021 to 2022, 2,900 Forfeiture Orders (78%) were associated with Local Police Forces, compared 2,200 Orders (73%) in the previous financial year. Large POCA Agencies and Regional Police Forces accounted for 440 Forfeiture Orders (12%) and 310 Forfeiture Orders (9%) respectively this year.
Local Police Forces have remained the most prominent agency sector over the last six financial years.
7. Civil Recovery investigative tools
A UWO is an investigative tool which can be granted to specific law enforcement agencies in respect of individuals or companies suspected of being involved in or having links with serious crime or against Politically Exposed Persons (PEPs) from outside the European Economic Area. An Interim Freezing Order can also be applied for alongside a UWO to prevent property being dissipated during the proceedings.
Further information on the legislative background and the civil system process for proceeds of crime under POCA, including UWOs, can be found in the Background Information Note.
In 2021 to 2022, the NCA had obtained UWOs in 4 orders since their introduction in 2018 with an estimated total value of £143m (based on nominal values i.e., not adjusted for inflation).
There have not been any UWOs obtained between July 2019 and March 2022.
8. Civil Recovery powers
The asset recovery powers in POCA to deprive and recover the proceeds of crime or other property connected to criminal activity can be applied through civil recovery.
Civil Recovery Order powers enable an enforcement authority to recover property which is determined to be or to represent property obtained through unlawful conduct. Applications are made in civil proceedings before the High Court. This section provides a summary of the statistics on the value of the proceeds of crime recovered under the POCA powers for Civil Recovery Order receipts.
Further information on the legislative background and the civil system process for proceeds of crime under POCA, including Civil Recovery Order receipts, can be found in the Background Information Note.
8.1 Civil Recovery Order receipts
These statistics are considered as experimental due to the quality of the administrative dataset which has been used in their production. Data was not provided prior to the financial year 2016 to 2017 due to a lack of available data. For further information on Experimental Statistics please refer to the accompanying Methodology and Data Quality Report. Supporting information on known data quality issues with the various data sources used in the bulletin are outlined in the Methodology and Data Quality report.
Figure 12: The value of proceeds of crime recovered through Civil Recovery Order receipts from the financial year 2016 to 2017 until financial year 2020 to 2021, in England and Wales, Northern Ireland and those which have no recorded jurisdiction
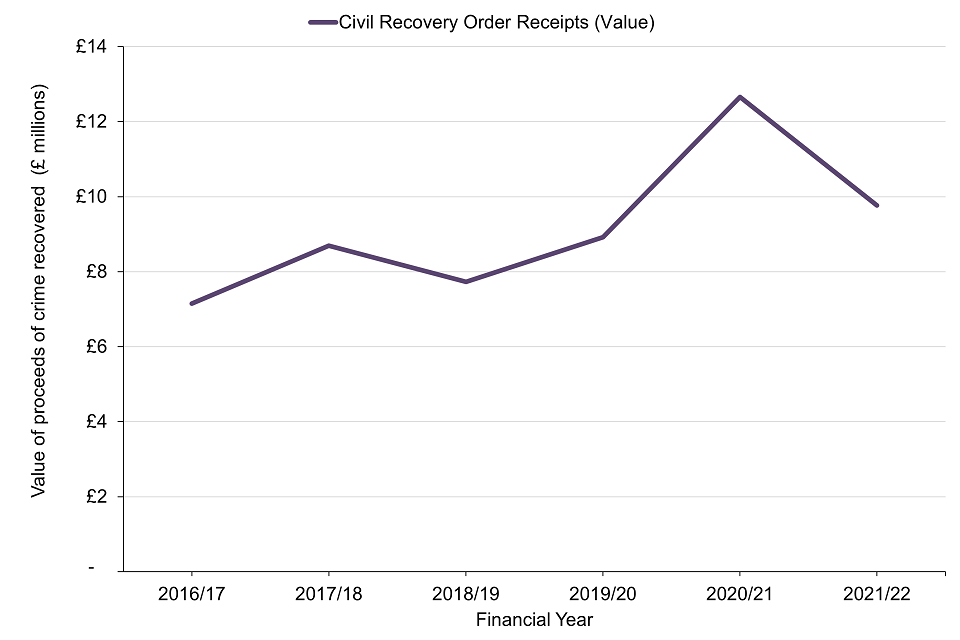
Source: NCA
Notes
-
Data presented in Figure 12 shows the proceeds of crime recovered at the end of the investigation from a respondent. It includes proceeds recovered on any Civil Recovery Orders, which means the proceeds of crime recovered from Civil Recovery Order includes receipts linked to orders made in a previous financial year.
-
Data was not provided prior to the financial year 2016 to 2017 due to the lack of data being available on the administrative database.
-
The data presented in Figure 12 are based on nominal values i.e., not adjusted for inflation.
£9.8m was recovered under Civil Recovery Orders 2021 to 2022, a decrease of 23% from £12.7m in the previous financial year, based on nominal values i.e., not adjusted for inflation.
As shown in Figure 12, there has been a steady increase in the value of Civil Recovery Orders over the last six financial years, peaking at £12.7m in 2019 to 2020. Civil Recovery Orders in 2021 to 2022 were 11% higher than the six-year median of £8.8m (based on nominal values).
9. ARIS allocations distributed to POCA Agencies
The Asset Recovery Incentivisation Scheme (ARIS) was introduced in 2006 to allow a proportion of the proceeds of crime recovered, under POCA to be redistributed to agencies involved in the asset recovery process. The Home Office policy is that agencies should invest ARIS funds in asset recovery capabilities or other crime reduction or community safety projects.
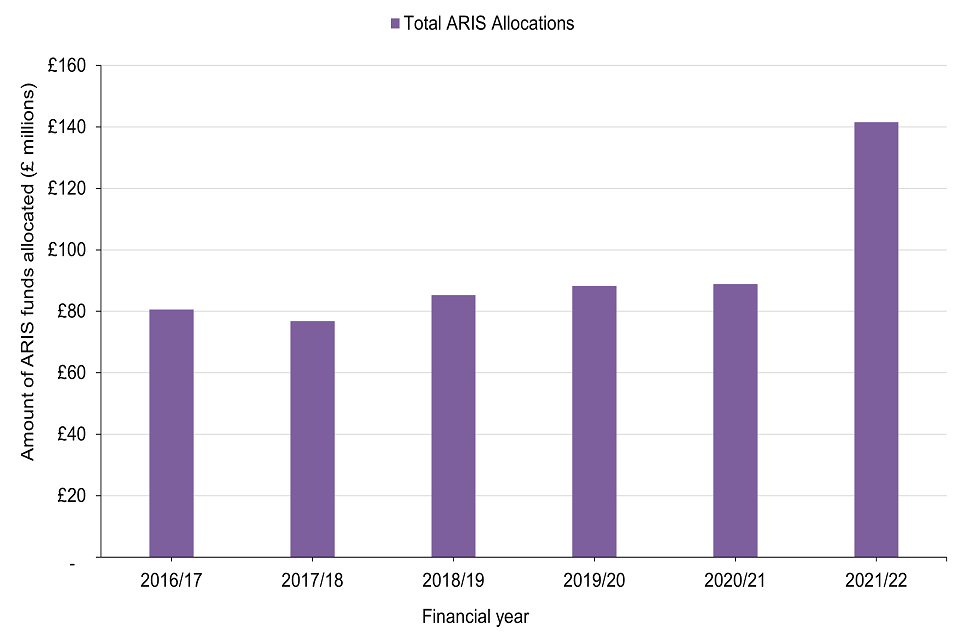
Figure 13: ARIS Allocations distributed to POCA Agencies from the financial year 2016 to 2017 until financial year 2021 to 2022, in England and Wales and Northern Ireland
Source: Home Office
Notes
-
Due to the process for calculating, assuring and distributing funds, ARIS Allocations are distributed a quarter in arrears with the final quarterly payment made in the following financial year.
-
Data presented in Figure 13 shows the distribution of ARIS Allocations based on administrative data managed by the Home Office.
-
The data presented in Figure 13 are based on nominal values i.e., not adjusted for inflation.
-
The breakdown of ARIS Allocations distributed to POCA Agencies, is provided in the ODS table in Worksheet 9. These data are based on nominal values i.e., not adjusted for inflation.
£142m of ARIS funding was distributed to POCA Agencies in 2021 to 2022. The data presented shows that ARIS Allocations to POCA Agencies grew by 76% over the reporting period, up from £80.6m in 2016 to 2017, based on nominal values i.e., not adjusted for inflation.
There was steady growth between 2016 to 2017 to 2020 to 2021, followed by a significant increase of 59% in 2021 to 2022 (based on nominal values). This is aligned with the uplift in asset recovery performance.
10. Use of Asset Recovery Incentivisation Scheme (ARIS) funds
This section presents statistics based on the survey returns submitted by POCA Agencies between the financial year 2016 to 2017 and financial year 2020 to 2021 and are based on nominal values. Please note the statistics reported below do not represent how the total ARIS Allocations distributed were spent by all POCA agencies as the survey returns for 2020 to 2021 account for just 45% (£39.7m) of the ARIS Funds distributed to POCA Agencies in that year (£88.9m).
Furthermore, the response rate for the 2020 to 2021 Use of ARIS Funds Survey was 19%, with 49 law enforcement agencies out of 260 providing a response. A decline of 17% from the previous financial year, where 93 responses (36%) were received from POCA agencies. Most respondents were from Local Police Forces and Regional Police Forces agency sectors.
Statistics for the financial year 2021 to 2022 will be included in the next statistical release.
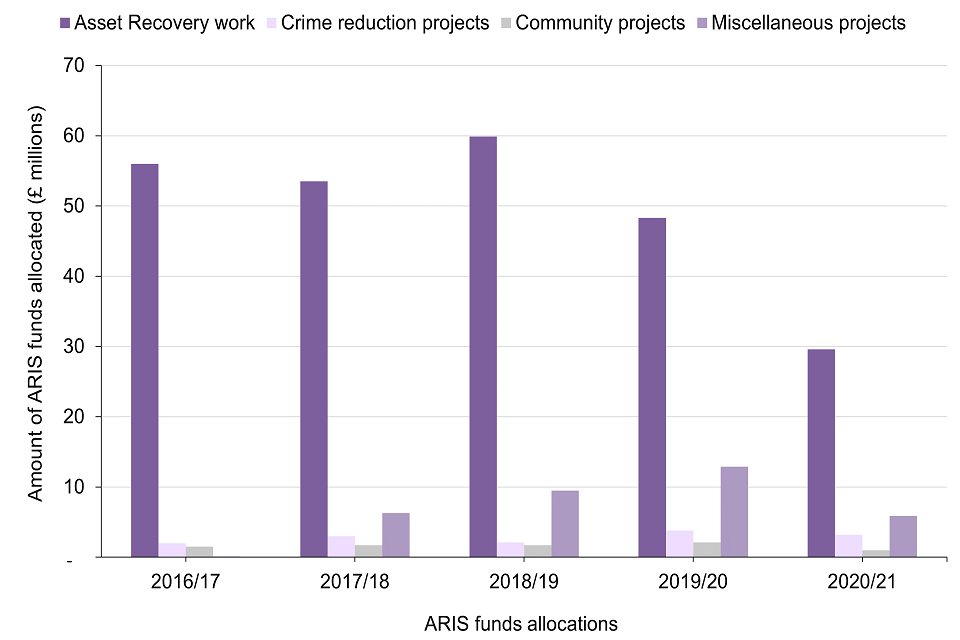
Figure 14: Use of ARIS funds by POCA Agencies on Asset Recovery work, Crime reduction projects, Community projects and Miscellaneous projects provided by survey returns from the financial year 2016 to 2017 until financial year 2020 to 2021, in England and Wales and Northern Ireland
Source: Home Office
Notes
-
Data presented in Figure 14 shows the use of ARIS funds based on survey returns submitted by POCA partners to the Home Office. It does not provide figures on the total of ARIS funds distributed within each financial year.
-
The Miscellaneous category refers to any funds received from ARIS that have been allocated for purposes which fall outside of the other three categories presented.
-
The data presented in Figure 14 are based on nominal values i.e., not adjusted for inflation.
Of the returns provided for financial year ending 2021, 75% of ARIS funds (£29.6m) were invested in asset recovery projects, compared to 72% in 2019 to 2020, based on nominal values i.e., not adjusted for inflation.
The survey returns submitted by POCA Agencies reveal that in 2020 to 2021, 8% of ARIS funds were invested in Crime reduction projects compared to 6% in 2019 to 2020. The survey returns also show that 15% of ARIS funds were invested in Miscellaneous projects, a marked decrease from 19% in 2019 to 2020.
As shown in Figure 14, there was an increase in the amount of ARIS funds invested in asset recovery projects until 2018 to 2019, which peaked at £59.9 million (based on nominal values). From 2018 to 2019, there has been a subsequent decline in the amount invested (based on nominal values) in asset recovery projects by POCA agencies.
The amount of ARIS Funds invested in Crime reduction projects and Miscellaneous have generally followed a positive trend over the previous six financial years, with the exception 2020 to 2021 (based on nominal values).
11. Compensation to victims
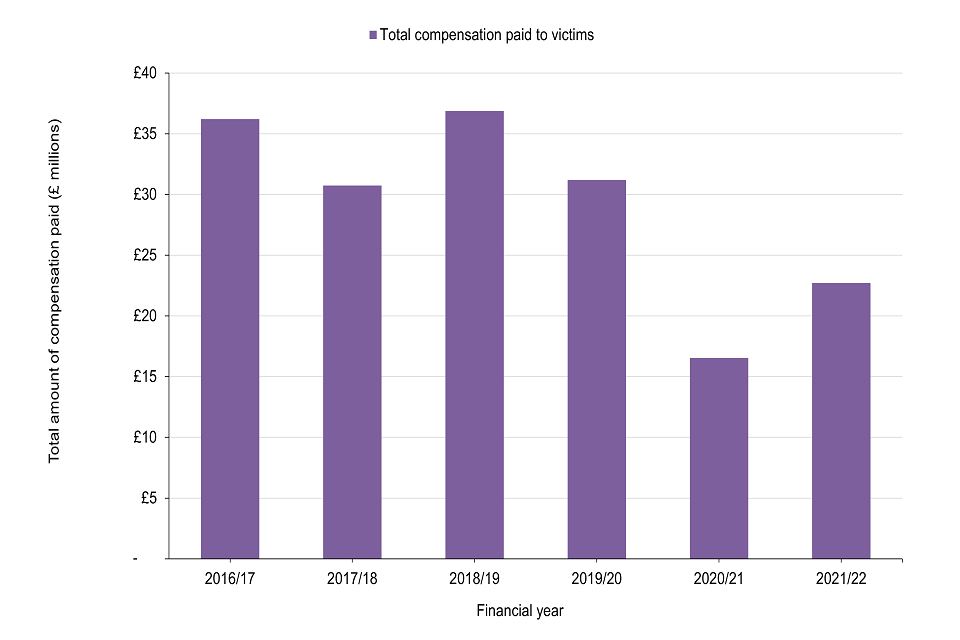
Figure 15: Total compensation paid to victims from the financial year 2016 to 2017 until the financial year 2021 to 2022, in England and Wales, Northern Ireland and those which have no recorded jurisdiction
Source: JARD
Notes
-
A court imposing a Confiscation Order can also order an offender to pay compensation to the victim of their crime. If the offender does not have the means to satisfy both their Confiscation Order and Compensation Order, the court can order that Compensation Order to be payable from the sums recovered as part of the Confiscation Order.
-
Data in Figure 15 captures the total amount paid out to all victims as compensation (from confiscation) from the financial year 2016 to 2017 to the financial year 2021 to 2022.
-
The data presented in Figure 15 are based on nominal values i.e., not adjusted for inflation.
In 2021 to 2022, £22.7m was paid in compensation, a 37% increase from the previous financial year, but a 27% decrease from the six-year median of £31.0m, based on nominal values i.e., not adjusted for inflation.
As shown in Figure 15, there has been a gradual decline in the value of total compensation paid to victims since 2016 to 2017, with the total compensation paid to victims reaching its highest peak in 2018 to 2019 at £36.9m and reaching its lowest trough in 2020 to 2021 at £16.5m (based on nominal values). The peak in 2018 to 2019 and trough in 2020 to 2021 mirror wider trends associated with overall Confiscation Order receipts in those respective years (based on nominal values).
Compensation by primary offence type
Of the £22.7m paid in compensation in 2021 to 2022:
- £14.9m (65%) were associated with Fraud related offences
- £3.9m (17%) were associated with Money Laundering related offences
- £3.2m (14%) were associated with Theft related offences
Fraud related offences have remained the most prominent primary offence type for Compensation over the last six financial years, accounting for 78% of Compensation processed in 2016 to 2017.
Please note the comparisons above are based on nominal values i.e., not adjusted for inflation.
Compensation by agency sector
Of the £22.7m paid in compensation in 2021 to 2022:
- £16.3m (72%) were associated with Local Police Forces
- £2.7m (12%) (£2.7m) were associated with Small-medium POCA Agencies
- £1.5m (7%) were associated with Local Authority Agencies
Local Police Forces have remained the most prominent agency sector over the last six financial years, accounting for 78% of Compensation processed in 2016 to 2017.
Please note the comparisons above are based on nominal values i.e., not adjusted for inflation.
12. Annexes
Annex A presents the main changes and additions to the Bulletin, followed by Annex B and Annex C which present the published subsets of data on (a) Modern Slavery data where the main related criminal offence type is Modern Slavery and (b) International Asset Recovery data for the assets involving international cooperation and asset returns.
12.1 Annex A: Main Changes and Additions to the Bulletin
There have been some changes in the methodology for this statistical release which concern:
- the values and volumes of proceeds of crime seized under Seizure POCA powers and Forfeiture Order POCA powers
- the volume of proceeds of crime recovered under Confiscation Order POCA powers and the total proceeds of crime restrained, seized or frozen under Asset Return orders
The main changes to the statistics presented under the Seizure and Forfeiture Order POCA powers are due to data reporting issues identified for (a) the measure used for the ‘Cash Seizure Date’ field on JARD which is not a mandatory field to complete and (b) the measure used for the value of proceeds of crime recovered from Forfeiture Orders. This statistical release has implemented an approach that has been approved with operational partners, which involves using the ‘Order Date’ field for Seizure POCA powers where the ‘Cash Seizure Date’ field is not recorded and the original order amount for Forfeiture Order POCA powers.
In addition, the amendments made to statistics previously presented on volumes under Confiscation Order POCA powers are due to the lack of available measures on JARD which measures the number of orders associated with the total value of proceeds of crime from Confiscation Orders recovered for the same period. The previous release in September 2021 used a proxy measure, which represented the volume of Confiscation Orders imposed where the orders are granted but not the corresponding full amount has not been paid by the defendant. The decision to implement this was made after a consultation and review with operational partners in 2022.
As a result of the above-mentioned changes, there will be differences in figures reported in this release to those previously released. Further details of these changes can be found in the Methodology and Data Quality Report.
Furthermore, there have been changes to the metric used when making comparisons over the long term. Statistical releases prior to September 2021 used the mean value or volumes under the respective POCA powers for the previous six financial years.
From September 2022 statistical releases will use the median as the metric for long term comparisons on value and volumes under the respective POCA powers. This decision has been taken because the median can better account for outliers in the underlying data sources. Information on the metrics for long term comparison is provided in the Methodology and Data Quality Report.
New additions to the September 2022 edition of the Bulletin
Official statistics on the ARIS Allocations distributed to POCA Agencies covering the financial years from 2016 to 2017 until 2021 to 2022 have also been included in this release for the first time.
Values and volumes of proceeds of crime by criminal offence types have also been included. Please note the statistics presented on criminal offence type have known limitations due to data reporting issues on JARD. This means these statistics might not provide a representative figure of the true criminal offence type for a given order. Information on how these criminal offence types are grouped can be found in the Methodology and Data Quality Report.
Further information on these statistics can be found in the Methodology and Data Quality Report under the section for JARD Data.
12.2 Annex B: Modern Slavery data
Modern Slavery data is published as a distinct subset of data, where the main related criminal offence type is Modern Slavery. It has been provided to support the Modern Slavery Annual Report released in October 2020.
Figure 16: The value of proceeds of crime restrained and recovered through Restraint Orders, Confiscation Orders and Forfeitures receipts where the main related criminal offence type is Modern Slavery from the financial year 2016 to 2017 until financial year 2021 to 2022, in England and Wales, Northern Ireland and those which have no recorded jurisdiction
Source: JARD
The value of proceeds of crime restrained and recovered from Restraint Orders and Forfeiture Orders associated with Modern Slavery offences have increased since 2020 to 2021, based on nominal values i.e., not adjusted for inflation. However, the proceeds of crime recovered from Confiscation Orders has fallen in the same time period (based on nominal values).
As Figure 16 shows, the proceeds of crime recovered from Confiscation Orders and Forfeiture Orders associated with Modern Slavery offences have followed a generally positive trend over the last six financial years (based on nominal values).
Restraint Orders however have been on a generally downward trend since 2017 to 2018, where they peaked at £6.3m and then fell, reaching their lowest trough in 2020 to 2021 and increasing slightly in 2021 to 2022 (based on nominal values).
More specifically:
-
£0.4m was recovered from Confiscation Orders receipts in 2021 to 2022, a 57% decrease from £0.9m in the previous financial year, based on nominal values
-
£1.1m was recovered from Forfeiture Orders receipts in 2021 to 2022, a 370% increase from £0.2m in the previous financial year, based on nominal values
-
£1.0m was restrained from Restraint Orders in 2021 to 2022, a 95% increase from £0.5m in the previous financial year, based on nominal values
Figure 17: The volume of proceeds of crime restrained and recovered through Restraint Orders and Forfeiture Orders receipts where the offence is Modern Slavery from the financial year 2016 to 2017 until financial year 2021 to 2022, in England and Wales, Northern Ireland and those which have no recorded jurisdiction
Source: JARD
In 2021 to 2022 there were approximately 30 Forfeiture Orders, showing an increase of 129% compared to the previous financial year where there were approximately 10 Orders. Restraint Orders, however, have decreased by 15% from the previous financial year.
As Figure 17 shows, the number of Forfeiture Orders has gradually increased over the last six financial years whilst Restraint Orders have declined consistently since financial year 2017 to 2018.
12.3 Annex C: international asset recovery
These statistics are badged as experimental due to the quality of the administrative datasets which have been used to produce them.
International cooperation
This section sets out the value and volume of proceeds of crime recovered from asset recovery orders that are:
-
executed in England and Wales, or Northern Ireland following receipt of a mutual legal assistance request from another country
-
executed abroad following receipt of a mutual legal assistance from England and Wales, and Northern Ireland
We have defined this, in this document, as “International Cooperation”.
The UK engages in asset sharing, the division of funds recovered under asset recovery powers between countries, as a recognition of joint efforts to recover assets and to encourage further co-operation.
The sharing of confiscated assets is an administrative process between the Home Office and the Government of the requesting or requested country or territory. The usual proportion that is shared is 50:50, however, the UK may decide to negotiate different proportions if there are victims involved.
These statistics are experimental. Supporting information on known data quality issues with the various data sources used in the bulletin for Experimental Statistics are outlined in the Methodology and Data Quality report.
Figure 18: The total value of proceeds of crime recovered as a result of International Cooperation between the financial year 2019 to 2020 to financial year 2021 to 2022, in England and Wales and Northern Ireland
Source: Home Office
Notes
-
Figures presented for “Total value of proceeds of crime recovered” show the full value of proceeds of crime recovered as a result of International Cooperation. The “Value of proceeds of crime shared with UK government” represents the value of proceeds of crime recovered which are retained by the UK government.
-
The data presented in Figure 18 are based on nominal values i.e., not adjusted for inflation.
In the financial year 2021 to 2022 a total of £2.8m was recovered through International Cooperation, a decrease of 5% compared to £2.9m in 2020 to 2021, based on nominal values i.e., not adjusted for inflation. However, the value of money retained by the UK Government has decreased from £1.3m to £0.6m, as the percentage of proceeds of crime retained has reduced from 45% to 20% (based on nominal values). This is because some cases in 2021 to 2022 involved overseas victims, leading the UK to share above the usual proportion of 50% of the recovered proceeds to recognise this and allow for compensation to be paid.
Operational agencies in England and Wales and Northern Ireland have cooperated with the following countries over the relevant three-year time period: Belgium, Cayman Islands, Czech Republic, Finland, France, Germany, Guernsey, Italy, Jamaica, Netherlands, Romania, Spain, Switzerland and the United States of America.
Asset return
Asset return refers to the process by which the proceeds of corruption are returned to their prior legitimate owner or to compensate the victims of the crime.
The UK, as a signatory to the UN Convention Against Corruption is obligated to return funds where the conditions for mandatory return are met; however, the UK also exercises its discretion to return funds in appropriate cases when it is not otherwise mandated (in line with Article 57(3)(c) of the Convention).
This section sets out, for the financial year 2021 to 2022, the value of (a) assets due to be returned and (b) assets returned based on nominal values. This section also includes the value of assets restrained, seized or frozen up until the financial year ending 2022, based on nominal values.
| Financial year | Total value of proceeds of crime recovered but not returned | Total value of proceeds of crime returned to foreign government |
|---|---|---|
| 2021 to 2022 | £18,000,000 | £456,068 |
Source: Home Office
In 2021 to 2022, the estimated total value of assets restrained, seized or frozen was £239m, based on nominal values.
In September 2021, £456,068, based on nominal values, was returned to Moldova following the recovery of the proceeds of crime related to Luca Filat, the son of the former Moldovan Prime Minister.
This return was carried out under Article 57(3)(c) of UNCAC. Details on the return of the proceeds of crime for this case, including how the funds have been spent, are set out in an Memorandum of Understanding signed by the UK and Moldova in 2021.
For asset returns where the proceeds of crime, based on nominal values, have been agreed to be returned in principle but are yet to be transferred, see the following cases:
-
£65,622 will be returned to Kuwait following the recovery of proceeds of crime by the Metropolitan Police Service (MPS) in 2020 to 2021
-
the recovery took place in financial year 2020 to 2021, however the process to return the funds was not commenced before the end of the financial year
Users should note figures presented for proceeds of crime restrained, seized and frozen relate to ongoing investigations which means no further information can be shared. These cases have been identified at an early stage in the process which means if they were to be successful any recovered proceeds of crime would be returned abroad. It should be noted there are further cases which are ongoing but are not recorded as ‘Asset Returns’.
13. About these Statistics
Future releases of this statistical publication are pre-announced on the statistics release calendar on the GOV.UK website.
The accompanying Methodology and Quality Data Report provides information on the different data sources used and the processes for this statistical release, as well as other statistical information about the bulletin.
13.1 Feedback
Home Office is keen to receive feedback on its statistical publications to maintain their relevance for users. Any feedback should be directed to the Asset Recovery Performance team through email: POCAPerformance@homeoffice.gov.uk
Press enquiries for this release should be directed to pressoffice@homeoffice.gov.uk or alternatively by telephone at 020 7035 3535.
Other enquiries on these statistics should be directed by email to: CriminalFinancesandAssetRecoveryUnit@homeoffice.gov.uk
Lead Statistician: Molly Lamb
Statistician: Michelle Chingono