Analysis relating to the Pension Protection Fund compensation cap and labour market experience of older workers
Published 18 May 2020

© Crown copyright 2020
This publication is licensed under the terms of the Open Government Licence v3.0 except where otherwise stated. To view this licence, visit nationalarchives.gov.uk/doc/open-government-licence/version/3 or write to the Information Policy Team, The National Archives, Kew, London TW9 4DU, or email: psi@nationalarchives.gov.uk.
Where we have identified any third party copyright information you will need to obtain permission from the copyright holders concerned.
This publication is available at https://www.gov.uk/government/statistics/analysis-relating-to-the-ppf-compensation-cap-and-labour-market-experience-of-older-workers/analysis-relating-to-the-pension-protection-fund-compensation-cap-and-labour-market-experience-of-older-workers
Background
The Pension Protection Fund (PPF) is a public corporation, established by the Pensions Act 2004 and run by an independent Board.
It provides compensation to members of eligible defined benefit occupational pension schemes[footnote 1] where the scheme’s sponsoring employer has experienced a qualifying insolvency event[footnote 2] or is treated as having done so, and where the scheme is assessed as having insufficient assets in the scheme to pay benefits at the level of compensation[footnote 3] determined by the Act. As at 31 March 2018 there were 243,136 PPF members, of which 135,377 were in receipt of compensation.
The PPF provides two levels of compensation: 100% to people who have reached Normal Pension Age[footnote 4] or are in receipt of an ill-health or survivor’s pension at the time the scheme enters the PPF assessment period and, in other cases, 90% compensation subject to the application of a statutory cap[footnote 5].
This analytical release contains new analysis that has been produced by the Department for Work and Pensions relating to the level of the PPF compensation cap and the labour market experience of older workers. The analysis presented is derived from Department for Work and Pensions (DWP) and Office for National Statistics (ONS) survey data.
This analysis provides context around the level of the PPF compensation cap, in relation to income and earnings as well as context on durations of employment and age of retirement.
The analysis includes the:
- proportion of pensioner benefit units with income from an occupational pension of a certain amount
- proportions of employees in a defined benefit pension scheme aged 16+ and 60+ with annual gross pay above certain levels
- people in employment aged 50 to 75 by length of time with current employer
- duration of continuous employment for those in employment aged 55 to 64
- people who retired in 2017 by age in 2017
- duration of continuous employment for those in employment aged 55 to 64
- people who retired in 2017 by age in 2017
Proportion of benefit units with occupational pension income equivalent to around £33,684 or more per year
The Pensioners’ Incomes Series provides analysis on pensioner benefit units, known as pensioner units[footnote 6].
In 2016 to 2017, the annual PPF Compensation Cap (at age 65) was £37,420.42 so 90% of the cap was £33,678.38.
Data from the pensioners’ incomes series shows that 62% of all pensioner benefit units (including both singles and couples) were in receipt of income from an occupational pension[footnote 7].
Of these pensioner benefit units with income from an occupational pension, 9% had an occupational pension income of £646 or more per week in 2016 to 2017, equivalent to around £33,684 or more per year. (2016 to 2017 prices).
Source: DWP pensioners’ incomes series, United Kingdom, 2016 to 2017.
Proportion of employees in a defined benefit pension scheme aged 60+ with annual gross pay above £33,678.38
Data from the annual survey of hours and earnings shows that in the financial year 2016 to 2017, 26.5% of employees in a defined benefit pension scheme (includes private and public sector) aged 60+[footnote 8] had annual gross pay above £33,678.38.
For comparison with all employees (not just those in a defined benefit pension scheme), 18.8% of employees aged 60+[footnote 9] had annual gross pay above £33,678.38.
Source: ONS annual survey of hours and earnings, Great Britain, 2016 to 2017.
Assumptions and limitations
The data source does not contain information on self-employed. Includes both public and private sector employee jobs.
Employees with more than one job concurrently will be counted more than once. employees in a defined benefit pension scheme in the reference week may not have been in that pension during the entire year.
Proportion of employees in a defined benefit pension scheme aged 16+ with annual gross pay above certain levels
The age range for employees in a defined benefit scheme was 16 to 84 and the age range for all employees was 16 to 95[footnote 10].
The following section illustrates the equivalent salary that would be required under 2 common accrual rates[footnote 11].
Based on 90% of the 2016 to 2017 PPF compensation cap level (£33,678.38), the salary earned to have accrued pension at cap level with an accrual rate of 40/60ths of final salary is £50,517.57.
Data from the annual survey of hours and earnings shows that in the financial year 2016 to 2017, 10.4% of employees in a defined benefit pension scheme (includes private and public sector) aged 16+ had annual gross pay above £50,517.57.
For comparison with all employees (not just those in a defined benefit pension scheme), 9.1% of employees aged 16+ had annual gross pay above £50,517.57.
Based on 90% of the 2016 to 2017 PPF compensation cap level (£33,678.38), the salary earned to have accrued pension at cap level with an accrual rate of 40/80ths of final salary is £67,356.76.
Data from the annual survey of hours and earnings shows that in the financial year 2016 to 2017, 4.2% of employees in a defined benefit pension scheme (includes private and public sector) aged 16+ had annual gross pay above £67,356.76.
For comparison with all employees (not just those in a defined benefit pension scheme), 4.4% of employees aged 16+ had annual gross pay above £67,356.76.
Table 1: Proportion of employees in a defined benefit pension scheme aged 16+ with annual gross pay above the affected levels
| Accrual rate | Salary earned to have accrued pension at or above cap level (90% is £33,678.38 in 2016 to 2017) | Proportion of employees in a defined benefit pension scheme aged 16+ with annual gross pay above the affected level |
|---|---|---|
| Pensions of 40/60ths of Final Salary | £50,517.57 (i.e. 50,517.57 / 60 x 40 = 33,678.38) | 10.4% |
| Pensions of 40/80ths of Final Salary | £50,517.57 (i.e. 50,517.57 / 60 x 40 = 33,678.38) | 4.2% |
Source: ONS annual survey of hours and earnings, Great Britain, 2016 to 2017.
For some very high earners with defined benefit pensions rights it is possible that the compensation cap level will result in a minority of cases where individuals subject to the PPF cap may receive less than 50% of their accrued pension rights.
Based on 90% of the 2016 to 2017 PPF compensation cap level (£33,678.38), the salary earned if the cap level is 50% of an individual’s accrued defined benefit pension rights with an accrual rate of 40/60ths of final salary is £101,035.13.
Data from the annual survey of hours and earnings shows that in the financial year 2016/17, 1.4% of employees in a defined benefit pension scheme (includes private and public sector) aged 16+ had annual gross pay above £101,035.13.
For comparison with all employees (not just those in a defined benefit pension scheme), 1.6% of employees aged 16+ had annual gross pay above £101,035.13.
Based on 90% of the 2016 to 2017 PPF compensation cap level (£33,678.38), the salary earned if the cap level is 50% of an individual’s accrued defined benefit pension rights with an accrual rate of 40/80ths of final salary is £134,713.51.
Data from the annual survey of hours and earnings shows that in the financial year 2016 to 2017, 0.5% of employees in a defined benefit pension scheme (includes private and public sector) aged 16+ had annual gross pay above £134,713.51.
For comparison with all employees (not just those in a defined benefit pension scheme), 0.7% of employees aged 16+ had annual gross pay above £134,713.51.
Table 2: Proportion of employees in a defined benefit pension scheme aged 16+ with annual gross pay above the affected levels
| Accrual Rate | Accrued defined benefit pension rights if cap level is 50% of an individual’s accrued pension | Salary earned if cap level (90% is £33,678.38 in 2016/17) is 50% or less of an individual’s accrued defined benefit pension rights | Proportion of employees in a defined benefit pension scheme aged 16+ with annual gross pay above the affected level |
|---|---|---|---|
| Pensions of 40/60ths of final salary | £67,356.76 | £101,035.13 (i.e. 101,035.13 / 60 x 40 = 67,356.76) | 1.4% |
| Pensions of 40/80ths of final salary | £67,356.76 | £134,713.51 (i.e. 134,713.51 / 80 x 40 = 67,356.76) | 0.5% |
Source: ONS annual survey of hours and earnings, Great Britain, 2016/17
Assumptions and limitations
The data source does not contain information on self-employed. Includes both public and private sector employee jobs.
Employees with more than one job concurrently will be counted more than once. Employees in a defined benefit pension scheme in the reference week may not have been in that pension during the entire year.
People in employment aged 50 to 75 by length of time with current employer
The following data explores the labour market experience of older workers including the durations of employment and the age at which people retired.
Data from the Labour Force Survey shows that the vast majority of employees aged 50 to 75 have been with their current employer for 12 months or more.
Only 7.8% of those in employment aged 50 to 75 have been with their current employer up to 12 months.
Table 3: People in employment aged 50 to 75 by length of time with current employer
| Length of time with current employer | Respondents aged 50 to 75 (%) | Length of time with current employer | Respondents aged 50 to 75 (%) Cumulative |
|---|---|---|---|
| Less than 3 months | 1.9% | Less than 3 months | 1.9% |
| Between 3 and 6 months | 1.9% | Up to 6 months | 3.9% |
| Between 6 and 9 months | 3.9% | Up to 12 months | 7.8% |
| 12 months or more | 91.5% | All lengths | 99.2% |
Source: ONS Labour Force Survey, United Kingdom, October – December 2018.
Assumptions and Limitations
Survey data is self-reported and therefore relies on people accurately reporting their circumstances.
As with all survey data there will be sampling and non-sampling errors. This means that the numbers derived from the LFS are estimates and subject to statistical uncertainty.
Further details about survey errors and how to quantify the uncertainty are given in Volume 1: Background and Methodology of the LFS user guides.
Duration of continuous employment for those in employment aged 55 to 64
Data from the Labour Force Survey shows that over a quarter (26.5%) of those in employment aged 55 to 64 have been continuously employed for at least 10 years but less than 20 years, 0.9% of those in employment aged 55 to 64 have been continuously employed for exactly 40 years and 2.2% of those in employment aged 55 to 64 have been continuously employed for over 40 years.
Table 4: Proportion of those in employment aged 55 to 64 that have been continuously employed for certain periods of time
| Duration of continuous employment | Proportion of those in employment (aged 55 to 64) |
|---|---|
| 0 years but less than 1 year | 7.7% |
| 1 year but less than 2 | 5.7% |
| 2 years but less than 5 | 14.3% |
| 5 years but less than 10 | 15.8% |
| 10 years but less than 20 | 26.5% |
| 20 years but less than 30 | 15.6% |
| 30 years but less than 40 | 10.5% |
| 40 years | 0.9% |
| Over 40 years | 2.2% |
Source: ONS Labour Force Survey, United Kingdom, October – December 2018
Please note this does not sum to 100% due to non-responses
Assumptions and limitations
Survey data is self-reported and therefore relies on people accurately reporting their circumstances.
As with all survey data there will be sampling and non-sampling errors. This means that the numbers derived from the LFS are estimates and subject to statistical uncertainty.
Further details about survey errors and how to quantify the uncertainty are given in Volume 1: Background and Methodology of the LFS user guides.
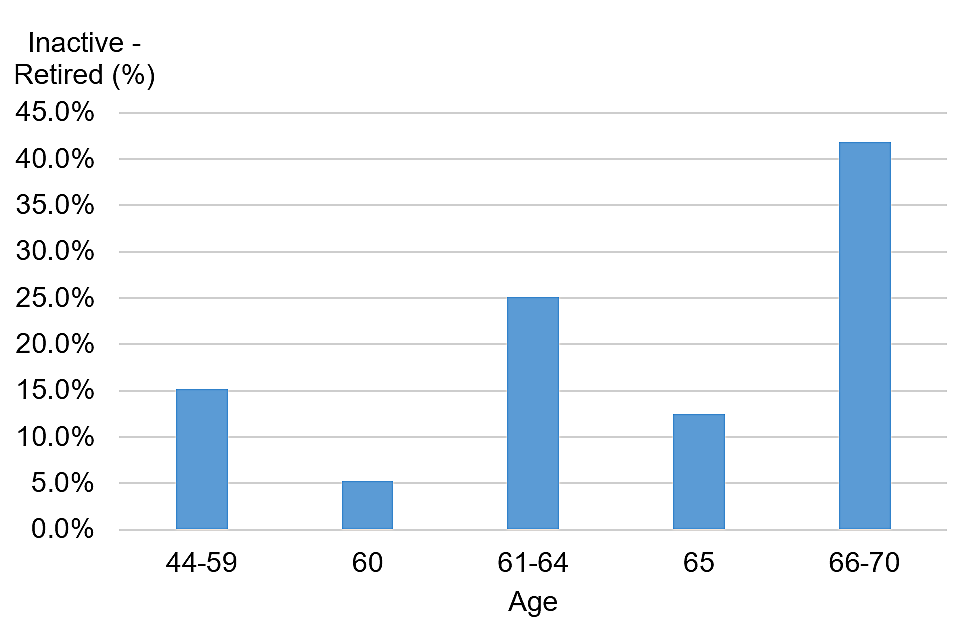
People who retired in 2017 by age in 2017
Data from the Annual Population Survey shows that, of the people who retired in 2017, 41.9% were aged 66 to 70. 20.5% were aged 44 to 60, 25.1% were aged 61 to 64 and 12.5% were age 65.
Chart 1: People who retired in 2017 – by age in 2017
This chart uses longitudinal Annual Population Survey data to compare across two periods. This dataset is restricted to those aged 15 to 69 in the first year.
People who retired in 2017 - by age in 2017
Source: ONS Longitudinal Annual Population Survey, United Kingdom, January 2016 – December 2017.
Assumptions and limitations
The dataset is restricted to those aged 15 to 69 in the first year and would therefore not show if anyone had retired over the age of 70.
The analysis looks at only those who were not retired in 2016 and were retired in 2017 to show proportions who retired in 2017 by age in 2017. It includes people who retired in 2017 and had any labour market status other than ‘retired’ in 2016 i.e. includes people who were previously employees, self-employed, unemployed and inactive for a reason other than retirement (for example, looking after family/home, sick, injured or disabled, student, other).
Survey data is self-reported and therefore relies on people accurately reporting their circumstances. This analysis looks at people who self-report their labour market status as ‘retired’ and will not include people who are retired but report a different labour market status, for example someone who is both retired and caring for someone may report they are ‘looking after family/home’.
The LFS does not automatically pick up retirement (for example based on whether someone is receiving pension income) so we infer it from people reporting their circumstances.
As with all survey data there will be sampling and non-sampling errors. This means that the numbers derived from the annual population survey are estimates and subject to statistical uncertainty.
Further details about survey errors and how to quantify the uncertainty are given in Volume 1: Background and Methodology of the LFS user guides. In addition, estimates using longitudinal APS may be subject to some attrition bias.
Further details about this are given in Volume 11: Longitudinal user guide.
Statement of compliance with the code of practice for statistics
The code of practice for statistics (the code) is built around 3 main concepts, or pillars:
- trustworthiness is about having confidence in the people and organisations that produce statistics and data
- quality is about using data and methods that produce assured statistics
- value is about releasing statistics that support society’s needs for information
The following explains how we have applied the pillars of the code in a proportionate way.
Trustworthiness
DWP analysts work to a professional competency framework and Civil Service core values of integrity, honesty, objectivity, and impartiality. The analysis in this release has been scrutinised and received sign off by the expert lead analyst.
The analysis has been seen in advance by Ministers and officials. We are publishing to ensure equality of access to the analysis.
We protect the security of our data in order to maintain the privacy of the citizen, fulfil relevant legal obligations and uphold our guarantee that no statistics will be produced that are likely to identify an individual, while at the same time taking account of our obligation to obtain maximum value from the data we hold for statistical purposes.
All analysts are given security training and the majority of data accessed by analysts is obfuscated and access is business case controlled based to the minimum data required.
Quality
The analysis presented is derived from DWP and ONS survey data. The data sources used in this analysis are also used for published statistics. The methodology and calculations have been quality assured by DWP analysts to ensure they are the best estimates using information available at the time.
Value
This analysis provides detailed evidence relating to the Pension Protection Fund Compensation Cap. This analysis will reduce the administrative burden of answering Parliamentary Questions, Freedom of Information requests and ad hoc queries to ensure timely responses to public queries regarding the analysis.
Further Information
- Pension Protection Fund
- Pension Protection Fund, The Purple Book
- PPF Compensation Cap Factors
- PPF Compensation Cap Factors - Previous periods
- Pensioners’ incomes series: financial year 2016/17
- Pensioners’ incomes series: financial year 2017/18
- Labour Force Survey (LFS) methodology and guidance
- Annual Survey of Hours and Earnings (ASHE) methodology and guidance
Contact information
For press enquiries, contact DWP Press Office on: 0203 267 5125
-
The legislation provides that a scheme is eligible for the PPF if it is ‘not a money purchase scheme’. This means that the PPF covers defined benefit schemes and the defined benefit elements of hybrid schemes, with some exceptions set out in the legislation. ↩
-
As defined in section 121 of the Pensions Act 2004. ↩
-
The remaining members are deferred pensioner members (members with compensation not yet in payment). Pension Protection Fund, The Purple Book, December 2018 Pension Protection Fund, The Purple Book. ↩
-
Normal Pension Age (NPA) is defined by section 180 of the Pension Schemes Act 1993 as the earliest age at which a member of a pension scheme becomes entitled to receive their pension under the scheme rules. ↩
-
The total amount of payments PPF members can receive each year is capped at a certain level. For levels, see PPF Compensation Cap Factors and PPF Compensation Cap Factors - previous periods. ↩
-
The Pensioners’ Incomes Series provides analysis on pensioner benefit units (known as pensioner units), which include single pensioners (individuals over State Pension age), Pensioner couples (married or cohabiting pensioners where one or more are over State Pension age) and income related to any dependent children in pensioner units. For further information see Pensioners’ Incomes Series Background information and methodology. ↩
-
In practice, the age range for employees in a defined benefit scheme was 60 to 84 since there are no employees aged 85 or over in the sample. ↩
-
In practice, the age range for employees was 60 to 95 since there are no employees aged 96 or over in the sample. ↩
-
In practice, the age range for employees in a defined benefit scheme was 16 to 84 and the age range for all employees was 16 to 95 since there were no employees over these ages in the sample. ↩
-
Average salary schemes would require higher lifetime earnings than final salary schemes. ↩