Chapter 6: Prices
Updated 3 September 2026

© Crown copyright 2026
This publication is licensed under the terms of the Open Government Licence v3.0 except where otherwise stated. To view this licence, visit nationalarchives.gov.uk/doc/open-government-licence/version/3 or write to the Information Policy Team, The National Archives, Kew, London TW9 4DU, or email: psi@nationalarchives.gov.uk.
Where we have identified any third party copyright information you will need to obtain permission from the copyright holders concerned.
This publication is available at https://www.gov.uk/government/statistics/agriculture-in-the-united-kingdom-2025/chapter-6-prices
Summary
- The annual average price index for all agricultural outputs increased by 3.0% from 2024 to 2025.
- The largest upward contribution to the annual inflation rate for agricultural outputs was from cattle and calves (4.8 percentage points), followed by milk (1.4 percentage points). The main downward contributions came from potatoes (-1.7 percentage points) and cereals (-1.2 percentage points).
- The annual average price index for all agricultural inputs increased by 0.2% from 2024 to 2025.
- The largest upward contribution to the annual inflation rate for agricultural inputs was from fertilisers and soil improvers (0.9 percentage points). The largest downward contribution was from compound feedingstuffs (-0.7 percentage points).
Data sources
The Agricultural Price Index (API) measures the monthly and annual price changes in agricultural outputs and inputs for the UK.
Outputs:
- The output series reflects farm-gate prices, which are the prices farmers receive for their products.
- Information is collected for all major crop categories (e.g., cereals, fruits and vegetables) and livestock/animal products (e.g., sheep, milk and eggs).
Inputs:
- The input series reflects the prices farmers pay for various goods and services.
It is further divided into two categories:
- Goods and services currently consumed: These are items used up during production, such as fertiliser or seeds.
- Goods and services contributing to investment: These are items necessary for production but not consumed directly, such as tractors or farm buildings.
Trends in annual price indices
Figure 6.1: Annual average price indices for agricultural outputs and inputs from 2014 to 2025 (2020 = 100)
Enquiries: prices@defra.gov.uk
| Year | All agricultural outputs | All agricultural inputs |
|---|---|---|
| 2014 | 95.2 | 93.0 |
| 2015 | 86.4 | 89.6 |
| 2016 | 85.5 | 87.1 |
| 2017 | 93.6 | 91.8 |
| 2018 | 99.6 | 98.9 |
| 2019 | 96.2 | 100.4 |
| 2020 | 100.0 | 100.0 |
| 2021 | 110.0 | 112.6 |
| 2022 | 130.7 | 143.3 |
| 2023 | 132.3 | 135.4 |
| 2024 | 135.6 | 127.2 |
| 2025 | 139.6 | 127.5 |
Source: Agricutural Price Index
Download the full prices dataset
Figure 6.1 shows the annual average price indices for agricultural outputs and inputs since 2014. Compared with 2024, the annual average price index for agricultural outputs in 2025 increased by 3.0% while agricultural inputs increased by 0.2%.
Contributions to change in the annual agricultural outputs and inputs inflation rate
Figure 6.2: Contributions to change in the agricultural outputs annual inflation rate between 2024 and 2025 (2020 = 100)
Enquiries: prices@defra.gov.uk
| Category | Contribution (percentage points) |
|---|---|
| Cattle and calves | 4.81 |
| Milk | 1.42 |
| Oilseed rape | 0.20 |
| Sheep and lambs | 0.19 |
| Fresh fruit | 0.09 |
| Eggs | 0.08 |
| Sugar beet | -0.17 |
| Oats | -0.18 |
| Pigs | -0.19 |
| Barley | -0.38 |
| Poultry | -0.40 |
| Fresh vegetables | -0.54 |
| Wheat | -0.60 |
| Cereals | -1.15 |
| Potatoes | -1.72 |
Source: Agricutural Price Index
Notes:
- Not all agricultural output categories are shown in Figure 6.2. Therefore, the sum of the contributions in Figure 6.2 may be slightly less than the annual inflation rate.
Download the full prices dataset
Figure 6.2 shows the contributions to the 3.0% increase in the agricultural outputs inflation rate between 2024 and 2025. This was driven by positive contributions from cattle and calves, and milk, which more than offset negative contributions from potatoes and cereals.
Cattle and calves made the largest positive contribution to the annual inflation rate, with deadweight GB prime cattle prices reaching historical highs, peaking at 697.2p/kg in April 2025. High prices were driven by reduced beef production due to an ongoing contraction of the national cattle herd. The next largest contribution was from milk, where high prices continued from 2024 due to rising production costs and reduced global dairy product supply. A historically high milk-to-feed price ratio incentivised increased production in the summer, leading to a decrease in farm-gate price in the last months of 2025 into early 2026. Cereals and potatoes pulled inflation down, with cereal prices easing as supply improved and potato prices falling from the high levels seen in 2024.
Figure 6.3: Contributions to change in the agricultural inputs annual inflation rate between 2024 and 2025 (2020 = 100)
Enquiries: prices@defra.gov.uk
| Category | Contribution (percentage points) |
|---|---|
| Fertilisers and soil improvers | 0.92 |
| Other goods and services | 0.43 |
| Maintenance of materials | 0.38 |
| Materials | 0.24 |
| Veterinary services | 0.16 |
| Maintenance of buildings | 0.07 |
| Buildings | 0.03 |
| Seeds | -0.04 |
| Energy and fuel | -0.28 |
| Plant protection products | -0.32 |
| Straight feedingstuffs | -0.68 |
| Compound feedingstuffs | -0.73 |
Source: Agricutural Price Index
Download the full prices dataset
Figure 6.3 shows the positive and negative contributions to the 0.2% decrease in the agricultural inputs inflation rate between 2024 and 2025. This was driven by negative contribution from animal feedingstuffs, which outweighed a positive contribution from fertilisers and soil improvers.
Fertilisers and soil improvers made the largest positive contribution with high prices driven by elevated natural gas prices, reduced domestic production and constrained supply on the global markets. Animal feedingstuffs made the largest negative contribution, as lower cereal and protein input prices outweighed stronger feed demand across livestock sectors.
Trends in agricultural outputs price indices through the year
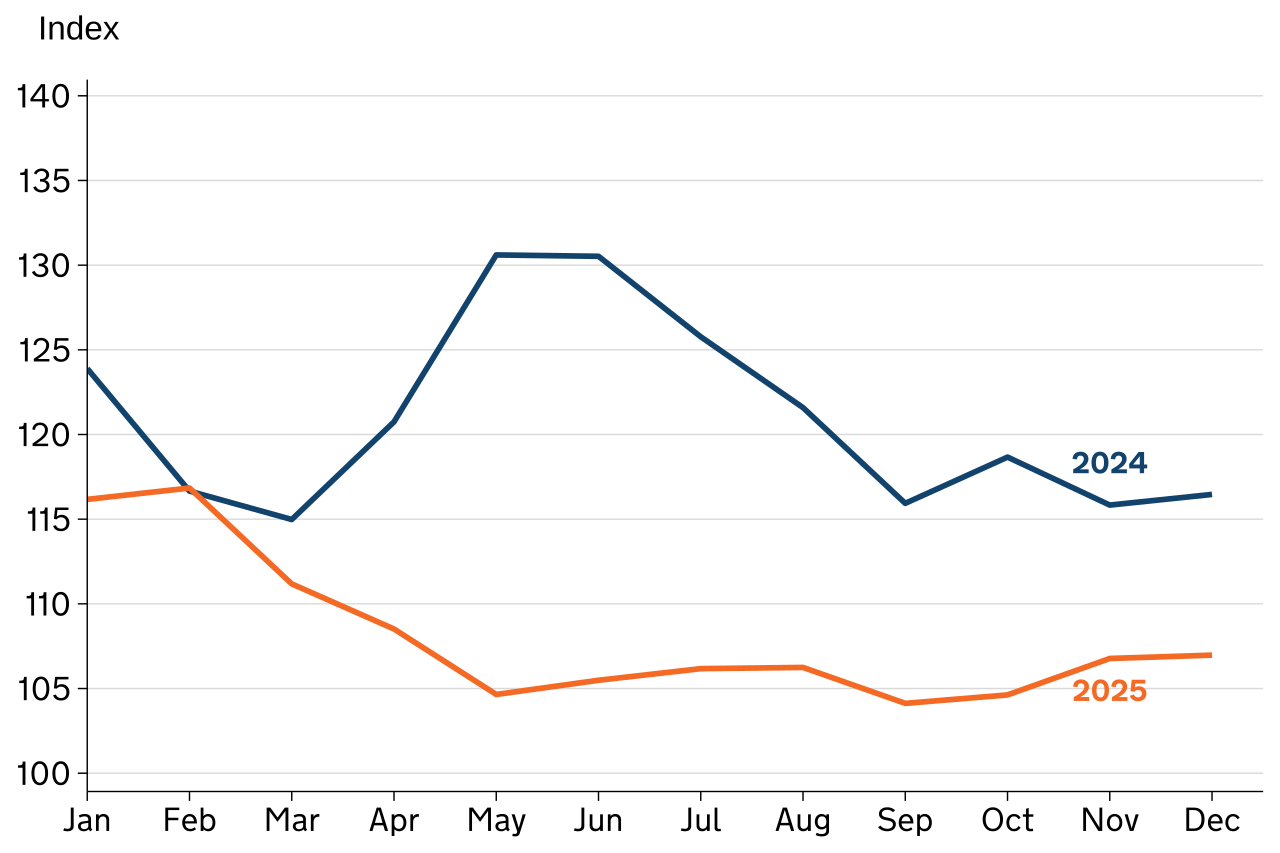
Figure 6.4: Monthly cereals price index 2024 and 2025 (2020 = 100)
Enquiries: prices@defra.gov.uk
Source: Agricutural Price Index
Text description for Figure 6.4: Line chart showing the cereals price index from January 2024 to December 2025. In 2024, the index falls early in the year, rises sharply to a peak in late spring, then declines through the summer before edging up slightly towards year end. The 2025 index starts lower than 2024, declines through the first half of the year, then remains relatively stable with a gradual increase towards the end of the year. Overall, prices are consistently lower and less volatile in 2025 than in 2024.
Download the full prices dataset
The annual price index for cereals decreased by 10% in 2025 compared with 2024.
This decrease reflects a continued easing from the exceptionally high price levels seen in 2022, as global cereal markets adjusted to improved supply conditions. Increased global wheat supplies reduced price pressures through the year, while subdued export demand and a greater reliance on domestic supplies limited upward movement in UK prices. UK cereal production increased, driven by a 7.3% increase in wheat production to around 12.0 million tonnes in 2025, with a 9.1% increase in planted area and a 1.7% decrease in wheat yields to 7.2 tonnes per hectare compared with 2024. For other cereals, production outcomes were weaker: UK barley production fell by 10% to 6.4 million tonnes and oat production fell by 2.3% to 0.9 million tonnes. Although domestic production remained below longer‑term averages, this was outweighed by weaker global prices and competitive international markets, resulting in a broadly downward trend across the year.
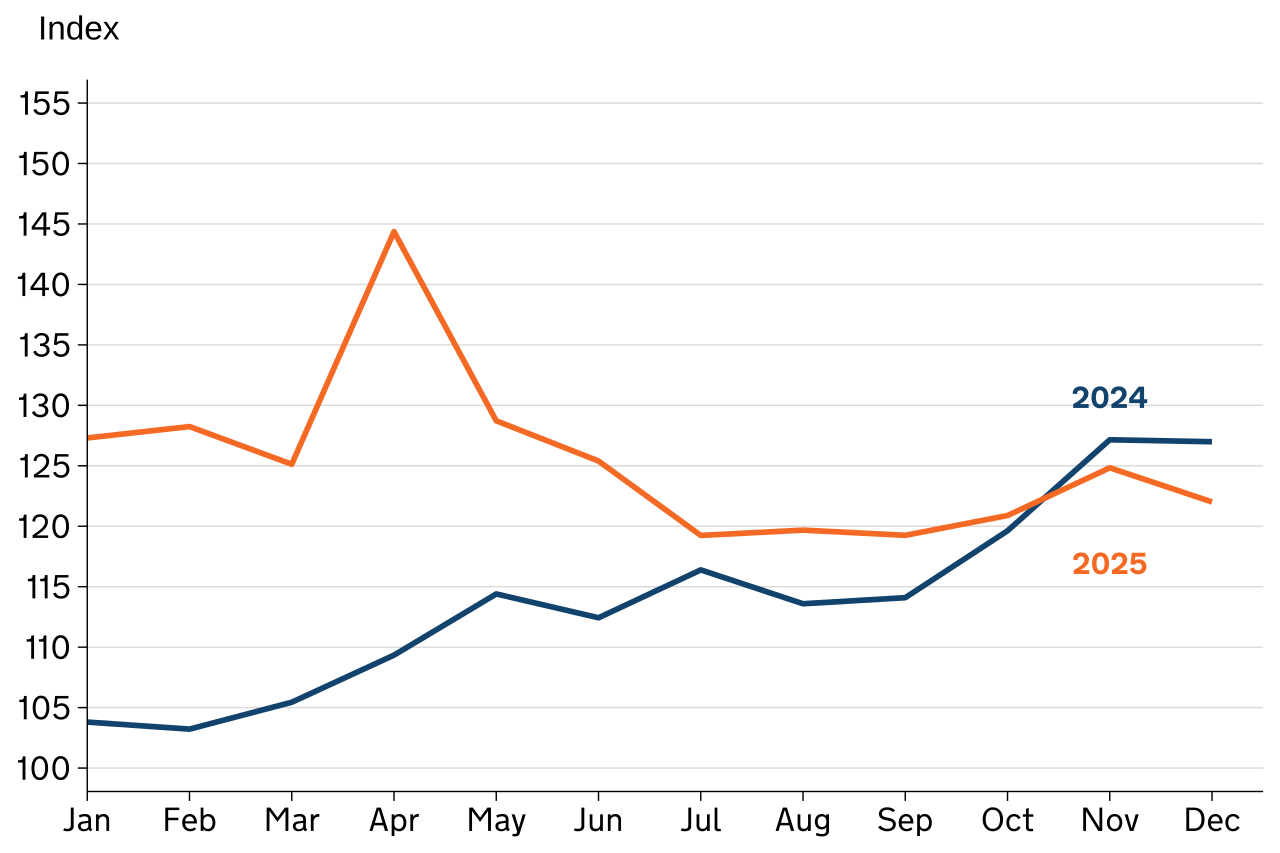
Figure 6.5: Monthly oilseed rape price index 2024 and 2025 (2020 = 100)
Enquiries: prices@defra.gov.uk
Source: Agricutural Price Index
Text description for Figure 6.5: Line chart showing the oilseed rape price index from January 2024 to December 2025. In 2024, the index rises steadily through the year, with a small dip in early summer, before increasing more sharply in the final quarter. In contrast, the 2025 index starts at a higher level, peaks in spring, then declines through the summer and stabilises towards the end of the year. Overall, 2025 shows greater volatility and higher prices early in the year, while 2024 displays a clearer upward trend over time.
Download the full prices dataset
The annual price index for oilseed rape increased by 10% in 2025 compared with 2024.
In 2025, oilseed prices were generally higher through much of the year, reflecting continued tight supply conditions in the UK and internationally. While production recovered slightly, increasing by 7.0% from the very low level seen in 2024 to 893 thousand tonnes, planted area remained historically low at 241 thousand hectares, limiting overall availability. Global oilseed markets also remained sensitive to supply conditions, with competition from alternative protein crops such as soybeans influencing price movements through the year. Overall, constrained supply supported firmer prices in 2025 compared with 2024.
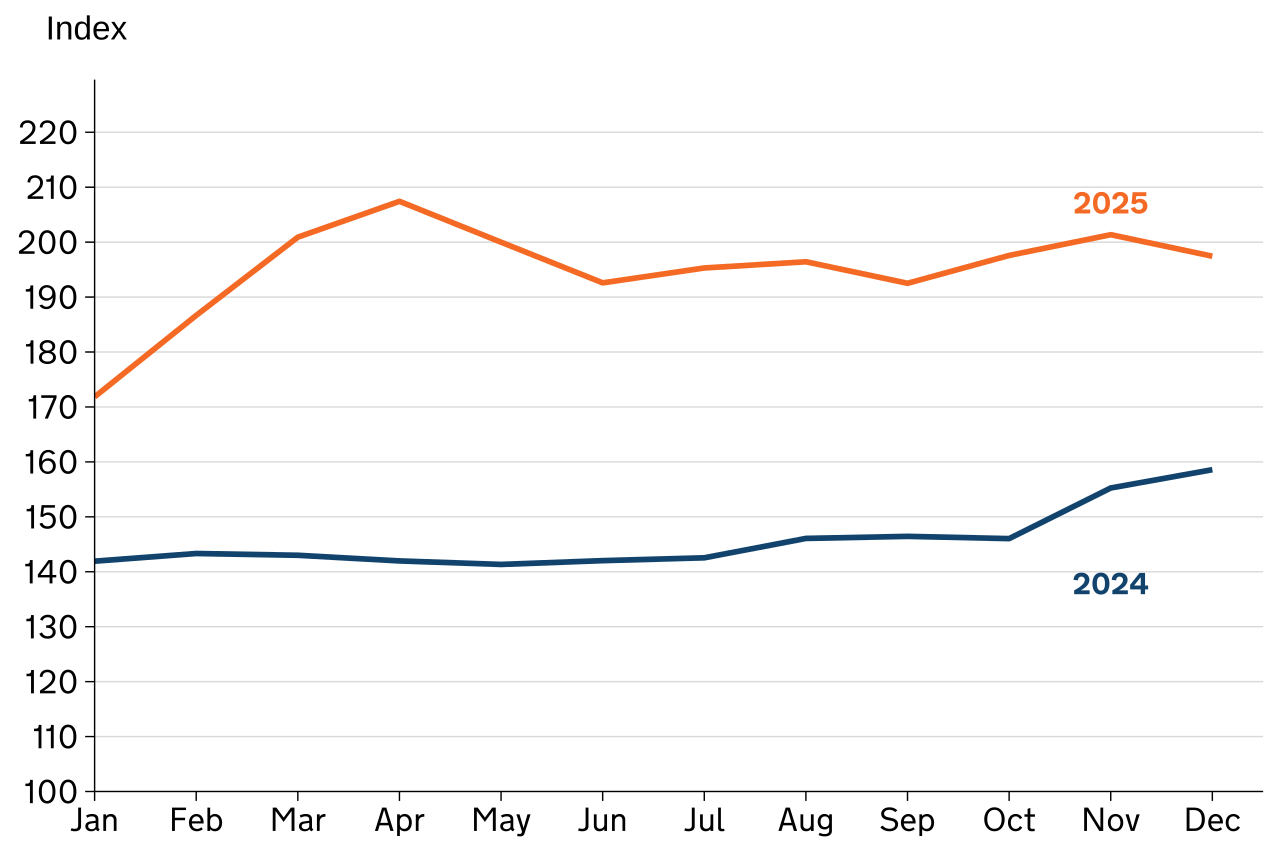
Figure 6.6: Monthly cattle price index 2024 and 2025 (2020 = 100)
Enquiries: prices@defra.gov.uk
Source: Agricutural Price Index
Text description for Figure 6.6: Line chart showing the cattle price index from January 2024 to December 2025. In 2024, the index remains relatively stable through the year, with a slight dip in spring followed by a gradual rise towards the end of the year. In contrast, the 2025 index is substantially higher throughout, rising sharply in the first half of the year, dipping slightly over the summer, and increasing again in the autumn before easing marginally in December. Overall, prices in 2025 are consistently higher and more volatile than in 2024.
Download the full prices dataset
The annual price index for cattle increased by 34% in 2025 compared with 2024.
The higher cattle price index in 2025 is consistent with tighter domestic supply. The UK cattle and calf population fell by 1.3% to 9.3 million at 1 June 2025, with the beef breeding herd down 4.1% to 1.3 million. As a result of several years of beef herd contraction, 2025 UK home fed beef production fell by 3.4% from 2024 to 898 thousand tonnes dressed carcase weight, the lowest level of production since 2015.
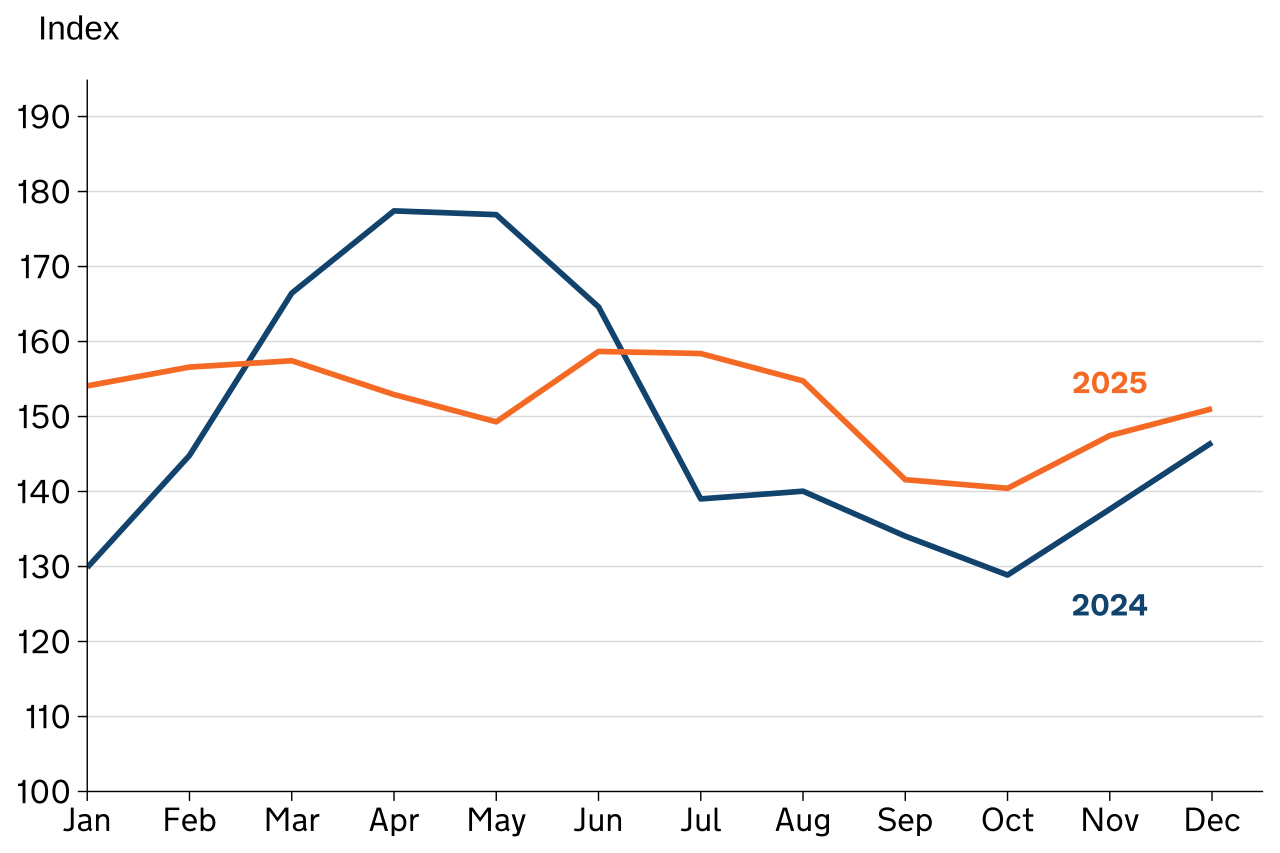
Figure 6.7: Monthly sheep price index 2024 and 2025 (2020 = 100)
Enquiries: prices@defra.gov.uk
Source: Agricutural Price Index
Text description for Figure 6.7: Line chart showing the sheep price index from January 2024 to December 2025. In 2024, the index rises sharply to a peak in spring, then falls through the summer to an autumn low before recovering towards the end of the year. In contrast, the 2025 index starts at a higher level, remains relatively stable in the first half of the year, declines into early autumn, and then increases gradually towards December. Overall, 2025 prices are generally higher and less volatile than those seen in 2024.
Download the full prices dataset
The annual price index for sheep increased by 3.0% in 2025 compared with 2024.
The higher sheep price index in 2025 was driven by continued constrained production, with lower output from abattoirs early in the year, alongside ongoing flock contraction. The UK sheep and lamb population was down 1.7% to 30.5 million at 1 June 2025, with lamb numbers down 2.9%. UK home fed sheep meat production increased by 1.9% overall, to 282 thousand tonnes dressed carcase weight, however production remained 4.4% below the five year average. Prices and slaughter patterns in spring 2025 differed from the same period in 2024 when holiday timing and retailer promotions supported stronger demand and lower prices.
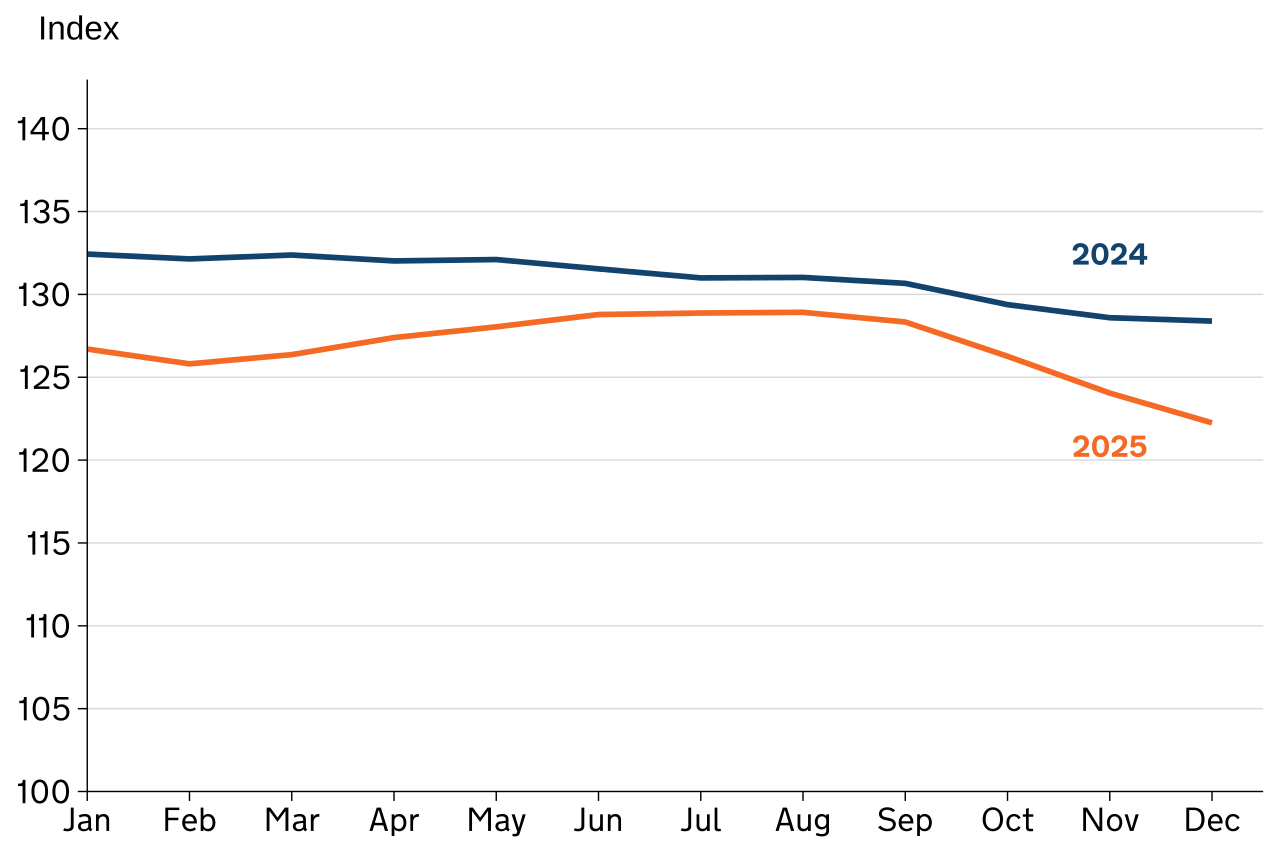
Figure 6.8: Monthly pigs price index 2024 and 2025 (2020 = 100)
Enquiries: prices@defra.gov.uk
Source: Agricutural Price Index
Text description for Figure 6.8: Line chart showing the pigs price index from January 2024 to December 2025. In 2024, the index remains relatively stable in the first half of the year before declining gradually towards the end of the year. The 2025 index starts slightly lower, rises modestly through the summer, then falls more sharply from early autumn to December. Overall, prices are consistently lower in 2025 than in 2024, with a more pronounced downward trend in the final months.
Download the full prices dataset
The annual price index for pigs decreased by 3.2% in 2025 compared with 2024.
GB deadweight standard pig price (UK spec) fell by 4.8p in 2025 to 201.3 p/kg, driven primarily by an increase in pig meat production as the cost of production eased in 2025. The UK pig population saw a small increase of 0.5% to 4.7 million at 1 June 2025, with a 3.2% decline in breeding pigs to 407 thousand from 2024. UK home fed pig meat production increased by around 2.6% to 937 thousand tonnes, driven by a 1.8% rise in home fed clean pig slaughterings to 9.9 million head and a 1.1% increase in average carcase weight. Pig meat demand remained subdued in 2025, particularly from the foodservice and export sectors, while consumers continued to seek out cheaper protein options such as poultry.
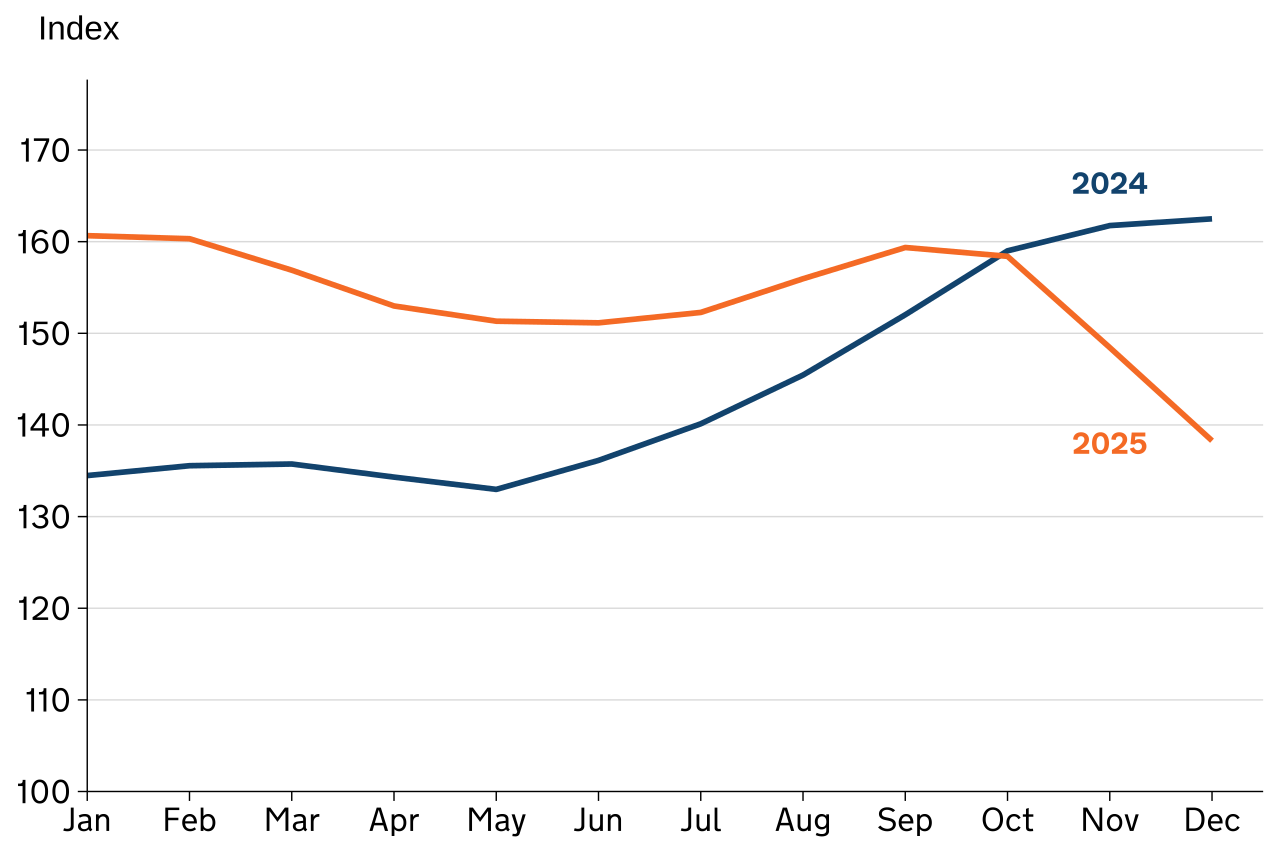
Figure 6.9: Monthly milk price index 2024 and 2025 (2020 = 100)
Enquiries: prices@defra.gov.uk
Source: Agricutural Price Index
Text description for Figure 6.9: Line chart showing the milk price index from January 2024 to December 2025. In 2024, the index increases steadily through the year, particularly from summer onwards, reaching its highest level in the final months. In contrast, the 2025 index starts at a higher level, declines through spring, rises again in late summer, and then falls sharply towards the end of the year. Overall, 2024 shows a clear upward trend, while 2025 is more variable and ends at a lower level.
Download the full prices dataset
The annual price index for milk increased by 6.7% in 2025 compared with 2024.
High farm-gate milk prices continued from 2024, reaching 46 pence per litre in January 2025, due to rising production costs and reduced global dairy product supply. A historically high milk-to-feed price ratio and favourable weather conditions incentivised increased production in the spring flush into the summer. UK milk production in the second quarter of 2025 was up 6.3% on the same period in 2024. This, combined with global production recovery, led to a sharp decline in dairy commodity values in September resulting in a decrease in farmgate price in the last months of 2025 to 40 pence per litre in December 2025.
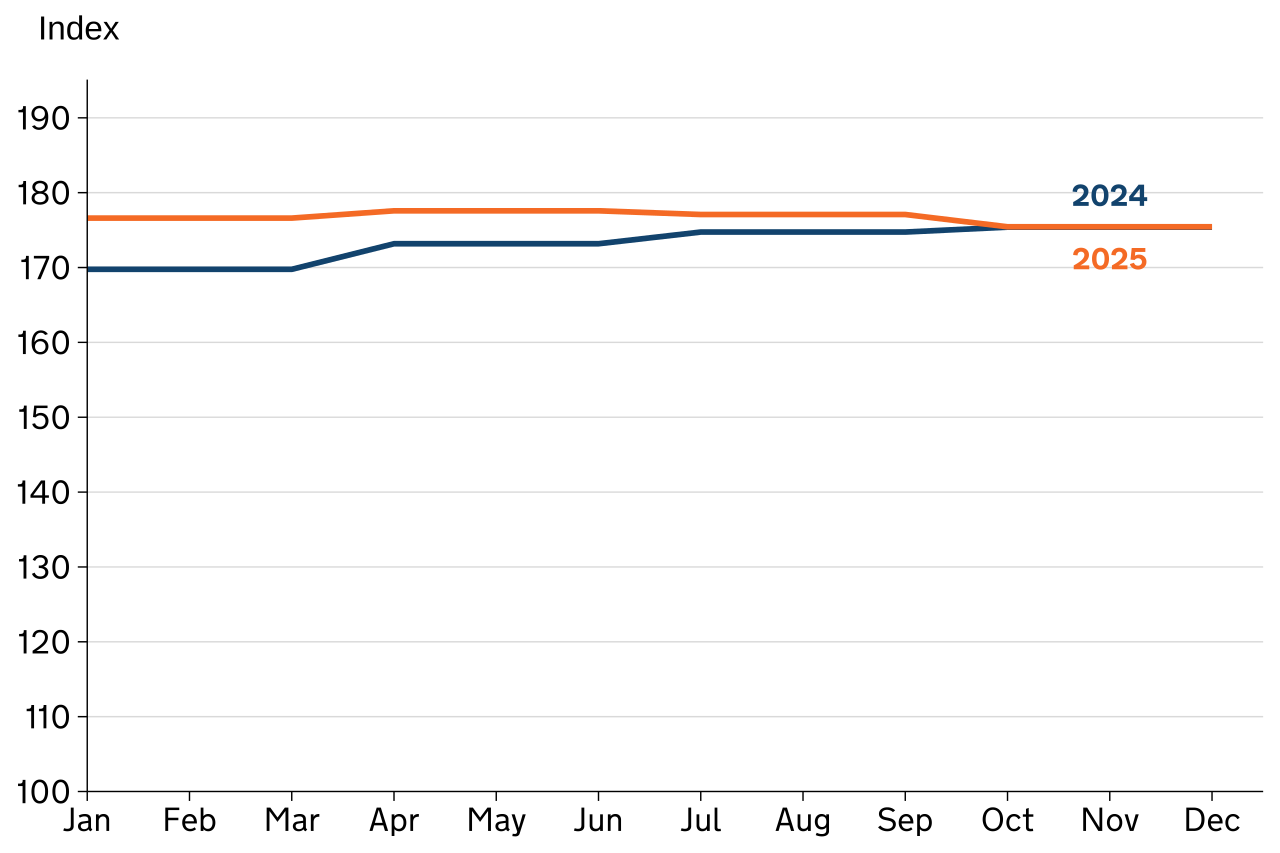
Figure 6.10: Monthly egg price index 2024 and 2025 (2020 = 100)
Enquiries: prices@defra.gov.uk
Source: Agricutural Price Index
Text description for Figure 6.10: Line chart showing the egg price index from January 2024 to December 2025. In 2024, the index increases gradually from early in the year and then remains broadly stable through the second half of the year. The 2025 index starts slightly higher, stays relatively flat for most of the year, and then converges with 2024 levels towards the final months. Overall, both years show limited volatility, with prices remaining at broadly similar levels by year end.
Download the full prices dataset
The annual price index for eggs increased by 2.0% in 2025 compared with 2024.
The small decline in the egg price index in the autumn of 2025 reflects a more balanced market following a period of elevated prices, as production and supply continued to recover. UK egg production for human consumption increased through 2025, with overall volumes 5.2% higher than 2024, supported by a 2.0% increase in the laying flock and 1.6% increase in layer chick placings as the sector rebuilt capacity following earlier avian influenza impacts. Increased production eased pressure on prices, while retail demand remained relatively stable, resulting in only limited price movement through the year.
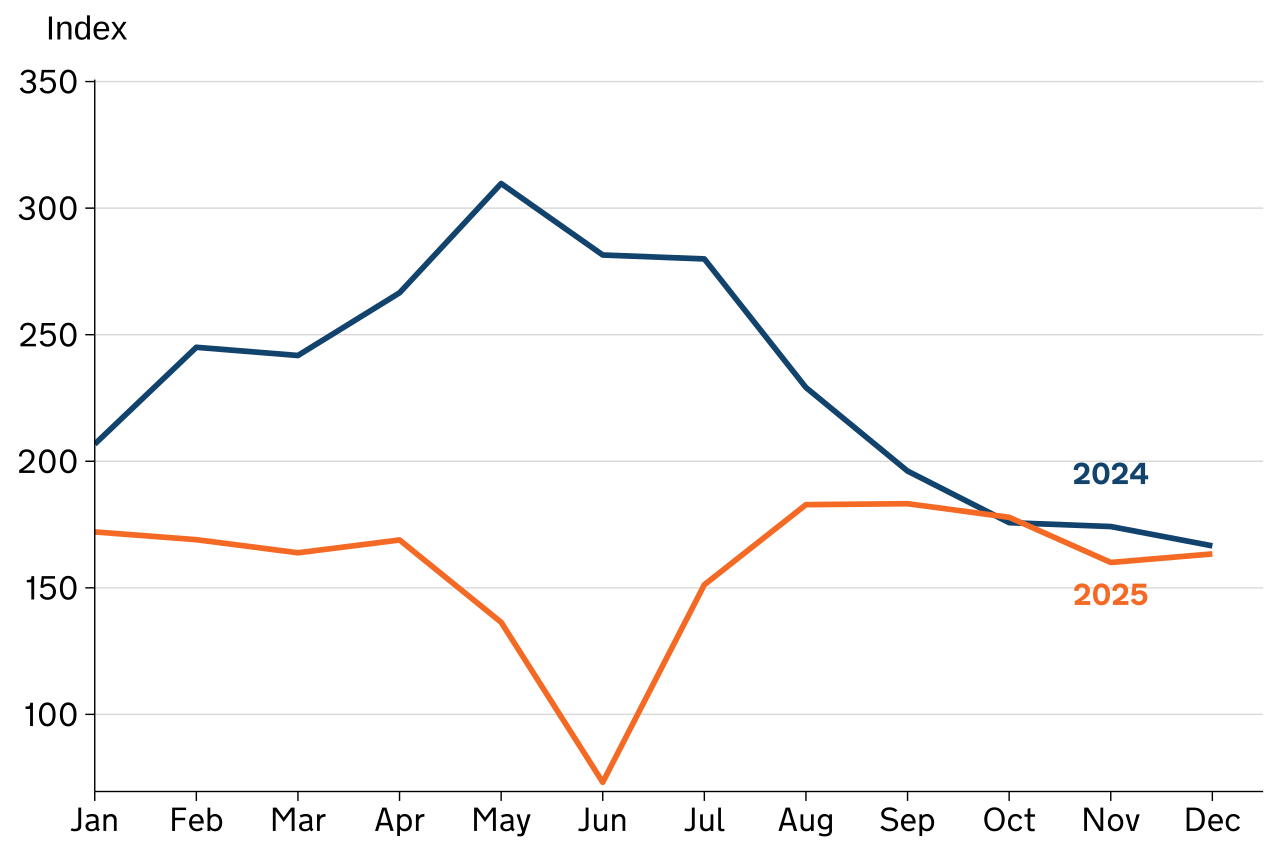
Figure 6.11: Monthly potatoes price index 2024 and 2025 (2020 = 100)
Enquiries: prices@defra.gov.uk
Source: Agricutural Price Index
Text description for Figure 6.11: Line chart showing the potatoes price index from January 2024 to December 2025. In 2024, the index rises sharply to a peak in late spring, then falls steadily through the second half of the year. In contrast, the 2025 index shows an almost mirror image pattern, starting slightly lower, and declining further to a mid‑year low, before recovering in late summer through to year end. Overall, 2024 shows greater volatility and higher peak prices, while 2025 remains lower for most of the year.
Download the full prices dataset
The annual price index for potatoes decreased by 31% in 2025 compared with 2024.
Potato prices decreased in 2025 due to an increase in production. Prices were exceptionally high in 2024 following a difficult harvest, which encouraged increased planting and resulted in ample supplies in 2025. As the 2025 season progressed, free‑buy and open‑market potato prices fell sharply due to high availability and subdued demand, particularly as buyers were already covered by contracts agreed earlier in the season. Substantial oversupply, combined with weaker seasonal consumption and the arrival of new‑crop potatoes, produced the mid‑year dip seen in the 2025 index. Prices recovered somewhat in late summer as stocks tightened, but remained well below the peaks recorded in 2024.
Trends in agricultural inputs price indices through the year
Figure 6.12: Monthly fertilisers and soil improvers price index 2024 and 2025 (2020 = 100)
Enquiries: prices@defra.gov.uk

Source: Agricutural Price Index
Text description for Figure 6.12: Line chart showing the fertilisers and soil improvers price index from January 2024 to December 2025. In 2024, the index declines slowly bur steadily through most of the year before stabilising towards year end. In contrast, the 2025 index starts at a similar level but rises gradually through the first half of the year, remaining higher than 2024 throughout and easing slightly in the final months. Overall, prices are consistently higher in 2025, while 2024 shows a gradual downward trend.
Download the full prices dataset
The annual price index for fertilisers and soil improvers increased by 11% in 2025 compared with 2024.
Fertiliser and soil improvers prices increased in 2025 due to upward pressure on nitrogen fertiliser costs, largely driven by energy markets. Natural gas typically accounts for 60 to 80% of nitrogen fertiliser production costs, and gas prices remained elevated through 2025 compared with 2024, despite easing from earlier crisis peaks. UK ammonium nitrate prices averaged £385 per tonne in 2025, up from £338 per tonne in 2024 (an increase of £47 per tonne, 14%), although still below the 2023 average of £453 per tonne. This reflected higher production costs and tighter global supply, alongside ongoing geopolitical and trade pressures in fertiliser markets.
Figure 6.13: Monthly energy and fuel price index 2024 and 2025 (2020 = 100)
Enquiries: prices@defra.gov.uk

Source: Agricutural Price Index
Text description for Figure 6.13: Line chart showing the energy and fuel price index from January 2024 to December 2025. In 2024, the index rises slightly early in the year before declining steadily to a low point in early autumn and then increasing modestly towards year end. In contrast, the 2025 index falls gradually in the first half of the year, then rises from late summer to finish the year at a higher level than 2024. Overall, 2024 shows a mid‑year decline followed by partial recovery, while 2025 follows a clearer upward trend in the latter part of the year.
Download the full prices dataset
The annual price index for energy and fuel decreased by 3.0% in 2025 compared with 2024.
The annual average price of red diesel fell from 80.8 pence per litre in 2024 to 76.0 pence per litre in 2025, while average crude oil prices declined from £62.50 per barrel in 2024 to £52.80 per barrel in 2025, contributing to lower prices earlier in the year. However, firmer fuel prices later in 2025 led to the late year increase seen in the index.
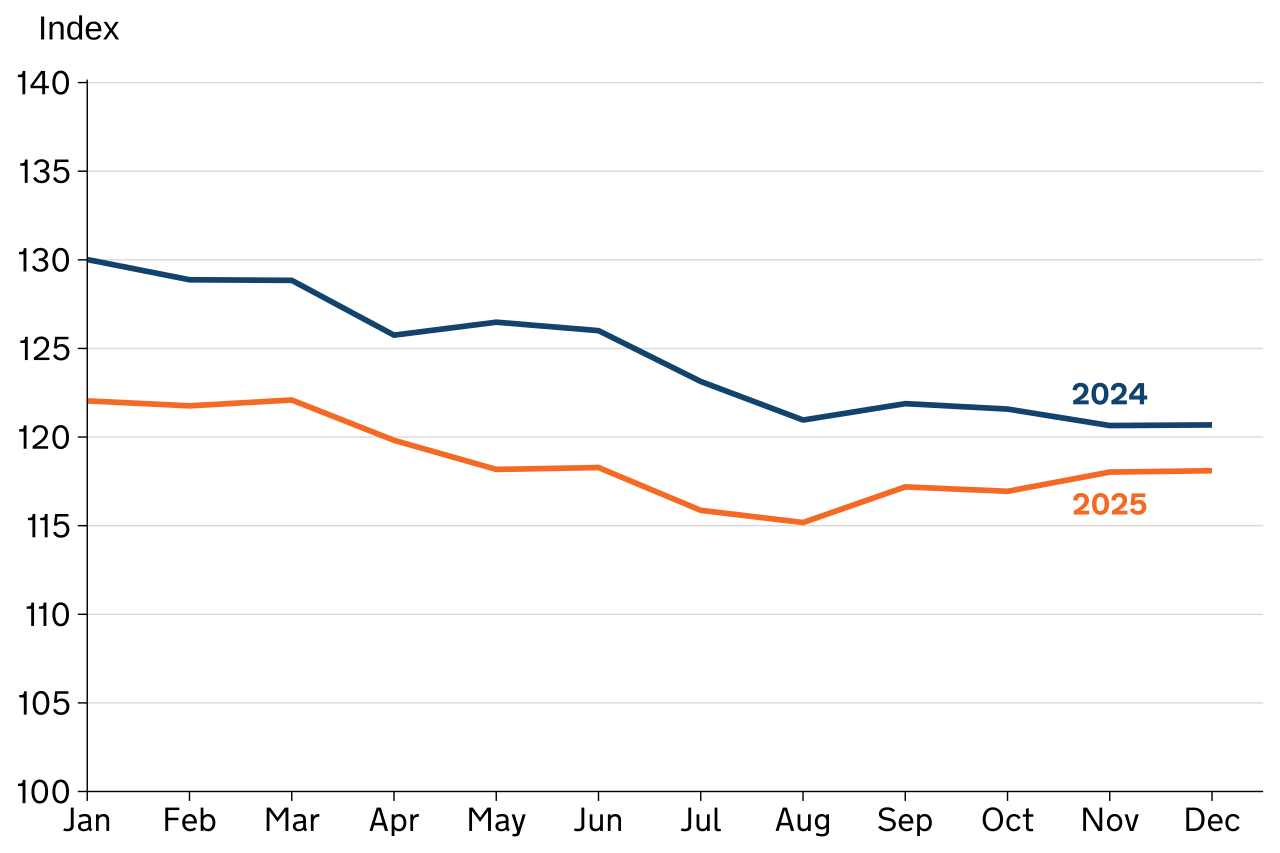
Figure 6.14: Monthly animal feedingstuffs price index 2024 and 2025 (2020 = 100)
Enquiries: prices@defra.gov.uk
Source: Agricutural Price Index
Text description for Figure 6.14: Line chart showing the animal feedingstuffs price index from January 2024 to December 2025. In 2024, the index declines gradually through the first half of the year and then remains broadly stable towards year end. The 2025 index starts at a lower level, falls further into mid‑year, and then rises modestly in the second half of the year, but remains below 2024 throughout. Overall, both years show a similar trend, with limited volatility, and 2025 consistently lower than 2024.
Download the full prices dataset
The annual price index for animal feedingstuffs decreased by 4.7% in 2025 compared with 2024.
Animal feedingstuffs price fell in 2025 due to decreases in underlying commodity prices, despite increased demand for feed across several livestock sectors. Defra feed accounts show that compound animal feed production increased by 2.6% to 13.6 million tonnes in 2025, but the total value of compound feed fell by 1.2% as cheaper cereals and protein inputs offset higher volumes. Demand for feed strengthened in the cattle, calf and sheep sectors, supported by higher beef, lamb and milk prices and a shortage of good‑quality forage during the dry and hot spring and summer of 2025, which increased reliance on compound feeds. At the same time, lower global prices for key feed commodities such as wheat and soyabean meal helped constrain feed costs, contributing to falling prices for both compound feed and straights.
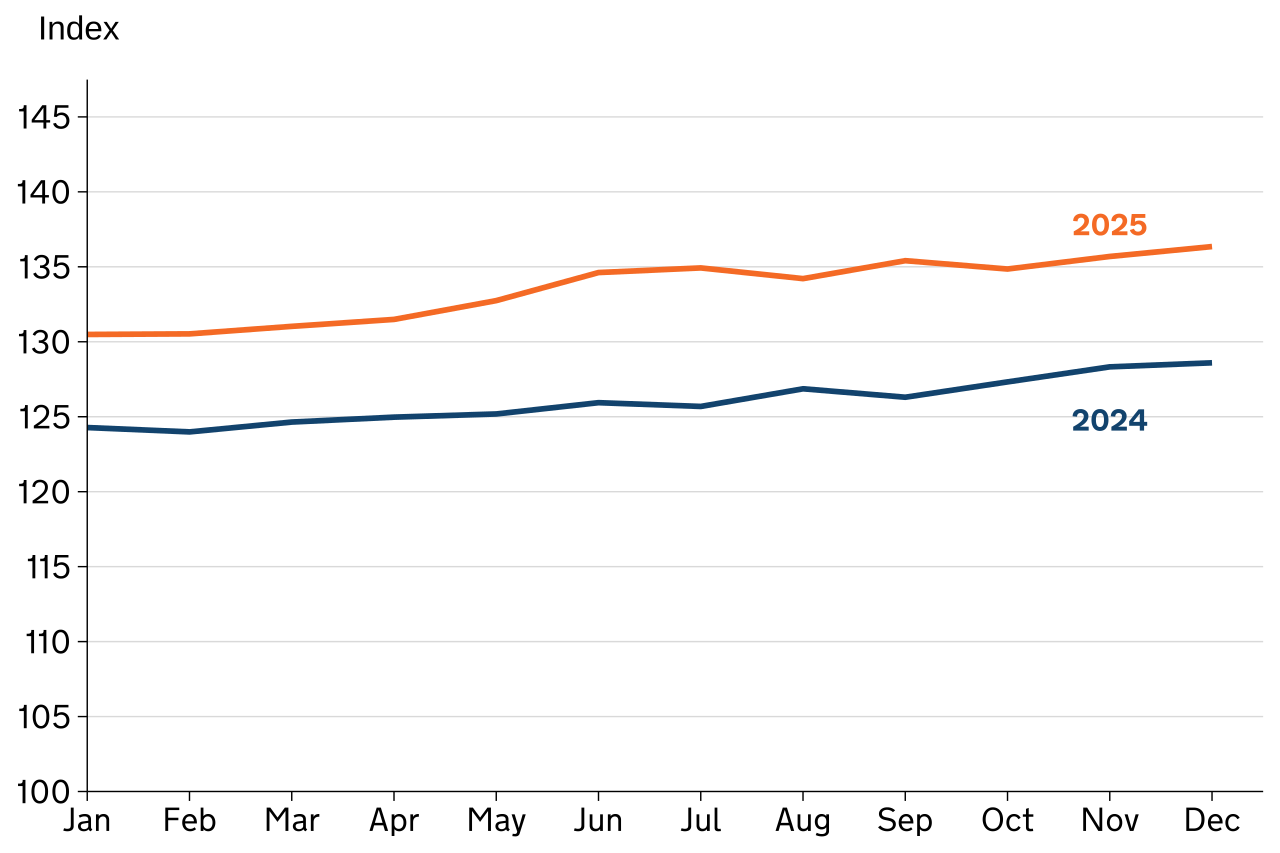
Figure 6.15: Monthly maintenance of materials price index 2024 and 2025 (2020 = 100)
Enquiries: prices@defra.gov.uk
Source: Agricutural Price Index
Text description for Figure 6.15: Line chart showing the Maintenance of materials price index from January 2024 to December 2025. In 2024, the index increases gradually over the year with small month‑to‑month fluctuations. In contrast, the 2025 index starts at a higher level and rises more steadily through the year, remaining consistently above 2024. Overall, both years show a similar upward trend, with higher prices throughout 2025.
Download the full prices dataset
The annual price index for maintenance of materials increased by 6.0% in 2025 compared with 2024.
Maintenance of materials increased in 2025 due to continuing cost pressures on machinery repairs, spare parts and building materials, following sustained inflation in these areas in earlier years. Machinery‑related and building‑related maintenance costs have remained elevated, driven by high prices for steel, components and specialist labour, even as some other inputs have eased. Building material prices and construction input costs remained high through 2025, supported by energy costs, supply‑chain disruption and higher labour expenses, feeding through to farm building repairs and maintenance.
Summary tables of price indices
Table 6.1: Annual average price indices for agricultural outputs 2024 to 2025 (2020 = 100)
Enquiries: prices@defra.gov.uk
| Category | 2024 | 2025 | Annual inflation rate (%) |
|---|---|---|---|
| Cereals | 120.6 | 108.2 | -10.3 |
| Wheat | 115.0 | 105.6 | -8.1 |
| Barley | 129.6 | 114.7 | -11.6 |
| Oats | 160.3 | 108.0 | -32.6 |
| Oilseed rape | 113.9 | 125.4 | 10.1 |
| Sugar beet | 165.5 | 139.3 | -15.8 |
| Forage plants | 124.4 | 124.6 | 0.1 |
| Fresh vegetables | 137.0 | 125.3 | -8.6 |
| Plants and flowers | 115.7 | 115.7 | 0.0 |
| Potatoes | 231.1 | 158.5 | -31.4 |
| Fresh fruit | 117.4 | 120.3 | 2.4 |
| Cattle and calves | 145.6 | 194.9 | 33.9 |
| Pigs | 131.0 | 126.8 | -3.2 |
| Sheep and lambs | 147.0 | 151.4 | 3.0 |
| Poultry | 108.1 | 103.8 | -4.0 |
| Milk | 144.2 | 153.8 | 6.7 |
| Eggs | 173.3 | 176.7 | 2.0 |
| All agricultural outputs | 135.6 | 139.6 | 3.0 |
Source: Agricutural Price Index
Download the full prices dataset
Table 6.2: Annual average price indices for agricultural inputs 2024 to 2025 (2020 = 100)
Enquiries: prices@defra.gov.uk
| Category | 2024 | 2025 | Annual inflation rate (%) |
|---|---|---|---|
| Seeds | 107.0 | 106.0 | -0.9 |
| Energy and fuel | 148.8 | 144.3 | -3.0 |
| Fertilisers and soil improvers | 154.1 | 170.8 | 10.8 |
| Plant protection products | 110.3 | 103.1 | -6.5 |
| Veterinary services | 111.8 | 119.1 | 6.6 |
| Straight feedingstuffs | 114.5 | 104.5 | -8.7 |
| Compound feedingstuffs | 128.6 | 124.4 | -3.3 |
| Maintenance of materials | 126.0 | 133.5 | 6.0 |
| Maintenance of buildings | 136.5 | 138.7 | 1.7 |
| Other goods and services | 118.1 | 122.1 | 3.3 |
| Materials | 124.6 | 127.1 | 2.0 |
| Buildings | 140.7 | 141.5 | 0.6 |
| All agricultural inputs | 127.2 | 127.5 | 0.2 |
Source: Agricutural Price Index
Download the full prices dataset
Revisions
Figures in these tables for 2025 are provisional and may be subject to revision.
Fertilisers and soil improvers prices were revised from 2014 to 2025 to correct a historical error in the annual weights.
Eggs and milk prices were revised from 2024 to reflect revisions to the underlying data series.