Chapter 12: Organics
Updated 3 September 2026

© Crown copyright 2026
This publication is licensed under the terms of the Open Government Licence v3.0 except where otherwise stated. To view this licence, visit nationalarchives.gov.uk/doc/open-government-licence/version/3 or write to the Information Policy Team, The National Archives, Kew, London TW9 4DU, or email: psi@nationalarchives.gov.uk.
Where we have identified any third party copyright information you will need to obtain permission from the copyright holders concerned.
This publication is available at https://www.gov.uk/government/statistics/agriculture-in-the-united-kingdom-2025/chapter-12-organics
Summary
In 2025:
-
540 thousand hectares were farmed organically in the UK.
-
56% of UK organic land was in England, 31% in Scotland, 12% in Wales and 1.2% in Northern Ireland.
-
Permanent pasture (including rough grazing) accounted for 64% of organic land in the UK, covering 346 thousand hectares.
-
9.3% of organic land in the UK was used to grow cereals (50 thousand hectares).
-
2.8% of cattle in the UK were reared organically.
-
There were a total of 5,004 organic operators in the UK.
Introduction
Organic farming is a method of farming that requires farmers to operate to a system based on ecological principles which impose strict limitations on the inputs that can be used, with the aim of minimising damage to the environment and wildlife. Emphasis is placed on natural methods of production and pest control.
All foods sold as organic must originate from growers, processors and importers who are registered with an approved control body and subject to regular inspection. During these inspections, the crop areas and numbers of livestock present on the organic holding are recorded. Due to the nature of the inspections, the data are collected at varying times through the year. The data presented in this chapter therefore do not give an exact snapshot of organic farming at any specific time of year and this should be considered when interpreting the results.
Organic land area
Land area farmed organically
In 2025, the UK had a total area of 540 thousand hectares of land farmed organically, an increase of 7.3% compared to 2024. The total area includes both the fully converted area and area under conversion.
Organic production comes from fully converted land, which is land that has undergone conversion to meet organic standards. In 2025, the UK had 461 thousand hectares of fully organic land. This represents an increase of 1.4% from 2024.
Land in-conversion is discussed in detail below.
Figure 12.1: Land area farmed organically, 2016 to 2025 (thousand hectares)
Enquiries: organic-stats@defra.gov.uk
| Year | In-conversion | Fully organic | Total |
|---|---|---|---|
| 2016 | 25 | 483 | 508 |
| 2017 | 33 | 485 | 517 |
| 2018 | 33 | 441 | 474 |
| 2019 | 28 | 457 | 485 |
| 2020 | 31 | 458 | 489 |
| 2021 | 42 | 465 | 507 |
| 2022 | 40 | 468 | 509 |
| 2023 | 36 | 462 | 498 |
| 2024 | 49 | 454 | 503 |
| 2025 | 79 | 461 | 540 |
Notes:
- Totals may differ to the sum of the components due to rounding.
Source: Defra organic farming statistics
Download the full organics dataset
Table 12.1: Area farmed organically by country, 2025 (thousand hectares)
Enquiries: organic-stats@defra.gov.uk
| Country | Area in-conversion | Fully organic area | Total organic area | Total area on agricultural holdings at June | Total organic area as % of June area |
|---|---|---|---|---|---|
| United Kingdom | 79 | 461 | 540 | 16,773 | 3.2% |
| England | 24 | 276 | 301 | 8,946 | 3.4% |
| Wales | 2.4 | 62 | 64 | 1,770 | 3.6% |
| Scotland | 52 | 116 | 168 | 5,024 | 3.3% |
| Northern Ireland | 0.1 | 6.6 | 6.7 | 1,032 | 0.6% |
Notes:
-
Total land area on agricultural holdings at June, excludes common land.
-
Totals may differ to the sum of the components due to rounding.
Source: Defra organic farming statistics and June Survey of Agriculture as at 1 June 2025: Crops
Download the full organics dataset
Land in-conversion
Before an area can be considered fully organic, it must undergo a conversion process. In 2025, the UK had 79 thousand hectares of land in-conversion. This constitutes an increase of 63% from 2024.
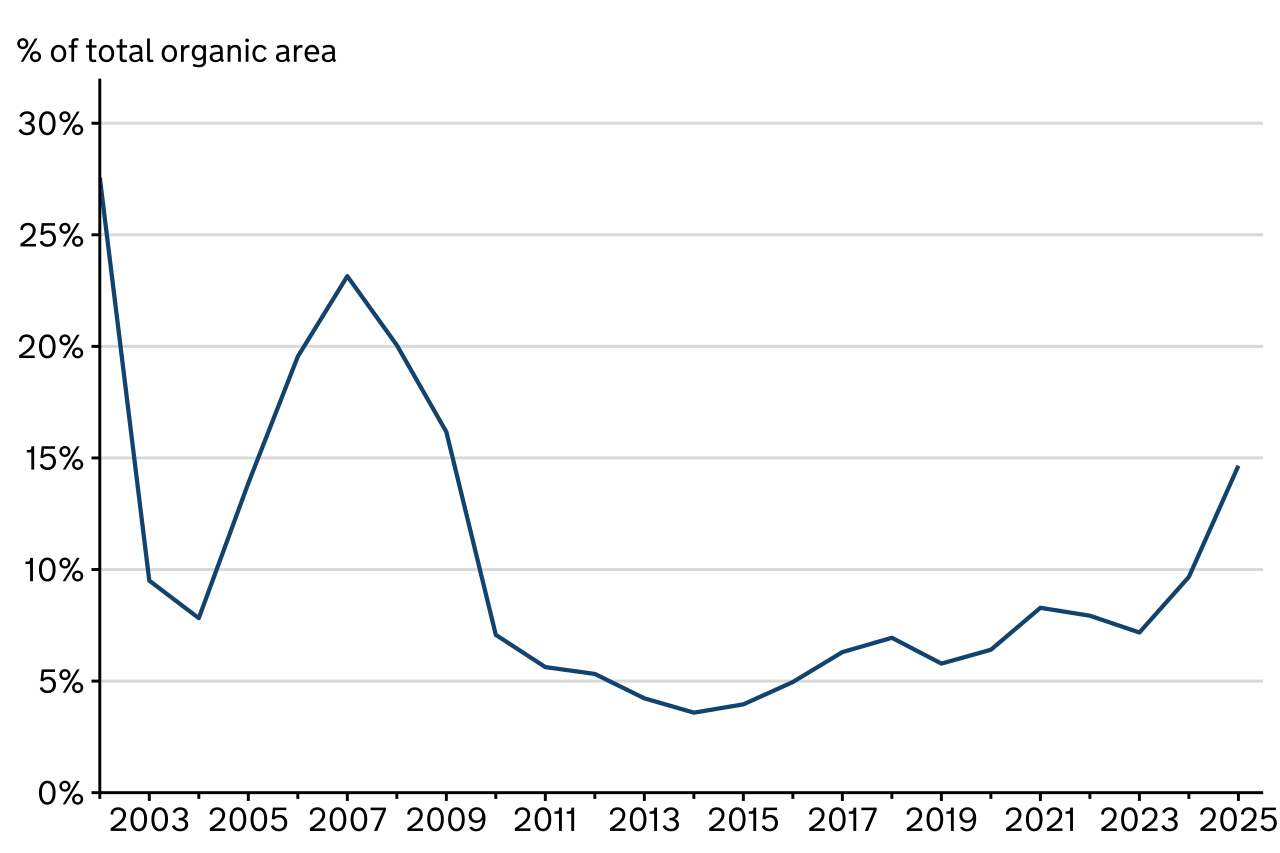
The area in-conversion expressed as a percentage of the total organic area can give an indication of the potential growth in the organic sector. In 2025, land in-conversion made up 15% of the total organic land in the UK. This was an increase of 5.0 percentage points from 2024.
Figure 12.2: Land in-conversion as a proportion of the total area farmed organically, 2002 to 2025
Enquiries: organic-stats@defra.gov.uk
Source: Defra organic farming statistics
Text description of Figure 12.2: Figure 12.2 shows the area of land in-conversion as a proportion of total land area farmed organically in the UK from 2002 to 2025. The percentage of land in-conversion in the UK peaked in 2002, with the lowest percentage occurring in 2014. Since 2014, the area of in-conversion land has fluctuated but generally shows an upward trend.
Download the full organics dataset
Organic land use
Organic land use
Permanent pasture (including rough grazing) accounts for the biggest share of the organic area in the UK (64%), followed by temporary pasture (17%) and cereals (9.3%). The full breakdown of organic land use in the UK is shown in Figure 12.3 and Tables 12.2 and 12.3.
Figure 12.3: Organic land use, 2025 (thousand hectares)
Enquiries: organic-stats@defra.gov.uk
| Use | Area |
|---|---|
| Permanent pasture (incl. rough grazing) | 346 |
| Temporary pasture | 93 |
| Cereals | 50 |
| Woodland | 20 |
| Vegetables (incl. potatoes) | 10 |
| Other arable crops | 9.8 |
| Unutilised & unknown | 7.9 |
| Fruit & nuts | 2.4 |
| Herbaceous & ornamentals | 0.6 |
Notes:
-
Includes fully organic land and land in-conversion.
-
Some land areas are provided without a crop category or land use description, therefore these are classified as unknown.
Source: Defra organic farming statistics
Download the full organics dataset
Table 12.2: Organic land use, 2022 to 2025 (thousand hectares)
Enquiries: organic-stats@defra.gov.uk
| Use | 2022 | 2023 | 2024 | 2025 | Percentage change 2024/2025 |
|---|---|---|---|---|---|
| Cereals | 49 | 50 | 50 | 50 | 0.4% |
| Other arable crops | 11 | 11 | 12 | 9.8 | -17% |
| Fruit & nuts | 2.3 | 2.2 | 2.2 | 2.4 | 6.1% |
| Vegetables (incl. potatoes) | 10 | 10 | 9.8 | 10 | 3.3% |
| Herbaceous & ornamentals | 0.7 | 0.5 | 0.6 | 0.6 | 6.2% |
| Temporary pasture | 96 | 91 | 90 | 93 | 3.3% |
| Permanent pasture (incl. rough grazing) | 314 | 307 | 311 | 346 | 11% |
| Woodland | 17 | 18 | 18 | 20 | 6.8% |
| Unutilised land | 3.2 | 3.2 | 4.4 | 4.0 | -9.9% |
| Unknown | 4.4 | 4.2 | 5.2 | 4.0 | -24% |
| Total | 509 | 498 | 503 | 540 | 7.3% |
Notes:
-
Includes fully organic land and land in-conversion.
-
Some land areas are provided without a crop category or land use description, therefore these are classified as unknown.
-
Totals may differ to the sum of the components due to rounding.
Source: Defra organic farming statistics
Download the full organics dataset
Table 12.3: Detailed organic land use, 2025 (thousand hectares)
Enquiries: organic-stats@defra.gov.uk
| Use | Area in-conversion | Fully organic area | Total organic area | Total area on agricultural holdings at June | Total organic area as % of June area |
|---|---|---|---|---|---|
| Cereals | 2.4 | 48 | 50 | 3,013 | 1.7% |
| Wheat | 0.9 | 20 | 21 | 1,670 | 1.2% |
| Barley | 0.7 | 4.4 | 5.2 | 1,080 | 0.5% |
| Oats | 0.3 | 17 | 17 | 198 | 8.8% |
| Other cereals | 0.5 | 6.6 | 7.1 | 65 | 11% |
| Other arable crops | 0.9 | 9.0 | 9.8 | 949 | 1.0% |
| Sugar beet | 0.0 | 0.3 | 0.3 | 93 | 0.3% |
| Fodder, forage & silage | 0.8 | 7.7 | 8.5 | 75 | 11% |
| Maize, oilseeds & protein crops | 0.1 | 1.0 | 1.1 | 781 | 0.1% |
| Fruit & nuts | 0.2 | 2.1 | 2.4 | 29 | 8.0% |
| Vegetables | 0.4 | 8.0 | 8.4 | 103 | 8.1% |
| Potatoes | 0.0 | 1.8 | 1.8 | 127 | 1.4% |
| Herbaceous & ornamentals | 0.1 | 0.5 | 0.6 | 12 | 5.2% |
| Temporary pasture | 8.1 | 85 | 93 | 1,313 | 7.1% |
| Permanent pasture (excl. rough grazing) | 25 | 218 | 243 | 5,985 | 4.1% |
| Rough grazing | 38 | 65 | 103 | 3,494 | 2.9% |
| Woodland | 2.4 | 17 | 20 | 902 | 2.2% |
| Unutilised land | 0.9 | 3.1 | 4.0 | [x] | [x] |
| Unknown | 0.5 | 3.4 | 4.0 | [x] | [x] |
| Total | 79 | 461 | 540 | [x] | [x] |
Notes:
-
Total land area on agricultural holdings at June, excludes common land.
-
Some land areas are provided without a crop category or land use description, therefore these are classified as unknown.
-
“[x]” indicates no comparable June survey data is available.
-
Totals may differ to the sum of the components due to rounding.
Source: Defra organic farming statistics and June Survey of Agriculture as at 1 June 2025: Crops
Download the full organics dataset
Organic crops
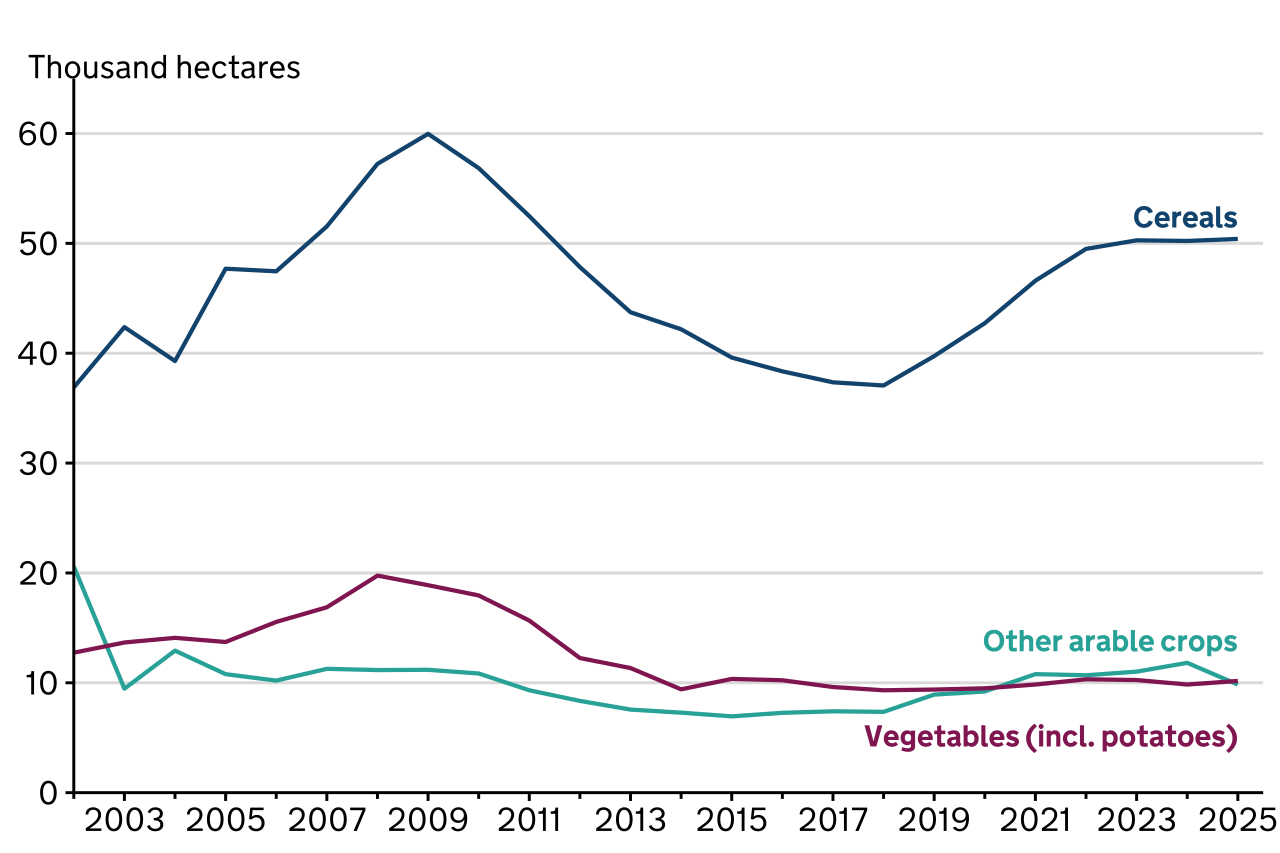
The three main crop types grown organically are cereals, other arable crops and vegetables (including potatoes). In the UK the area of organically grown cereal crops increased by 0.4% to 50 thousand hectares in 2025. Other arable crops decreased by 17% to 9.8 thousand hectares. The area of organically grown vegetables (including potatoes) increased by 3.3% to 10 thousand hectares in 2025.
Figure 12.4: Organic crops, 2002 to 2025 (thousand hectares)
Enquiries: organic-stats@defra.gov.uk
Notes:
- Includes fully organic land and land in-conversion.
Source: Defra organic farming statistics
Text description of Figure 12.4: Figure 12.4 shows the area of land, in thousand hectares, used to organically farm cereals, other arable crops and vegetables (including potatoes) from 2002 to 2025. Cereals have the highest area of organic farming, which peaked in 2009. From this peak, the organic area used to farm cereals declined until 2018. Since 2018, the area of cereals increased steadily until 2023 then remained stable. Other arable crops and vegetables (including potatoes) have had similar areas of organic farming throughout the time series. Other arable crops peaked in 2002 and vegetables peaked in 2008.
Download the full organics dataset
Organic livestock
Table 12.4: Detailed organic livestock numbers, 2025 (thousand head)
Enquiries: organic-stats@defra.gov.uk
| Livestock | Total organic livestock | Total livestock at June | Organic livestock as % of June livestock |
|---|---|---|---|
| Cattle | 259 | 9,292 | 2.8% |
| For slaughter | 116 | 3,617 | 3.2% |
| Dairy cows | 46 | 3,181 | 1.4% |
| Other cattle | 98 | 2,494 | 3.9% |
| Sheep | 617 | 30,484 | 2.0% |
| Breeding females | 340 | 14,780 | 2.3% |
| Other sheep | 278 | 15,704 | 1.8% |
| Pigs | 13 | 4,739 | 0.3% |
| Fattening pigs | 5.8 | 4,332 | 0.1% |
| Breeding sows | 1.3 | 316 | 0.4% |
| Other pigs | 5.8 | 91 | 6.4% |
| Poultry | 4,755 | 183,332 | 2.6% |
| Broilers | 2,383 | 120,959 | 2.0% |
| Laying hens | 2,233 | 42,703 | 5.2% |
| Other poultry | 139 | 19,670 | 0.7% |
| Other livestock | 6.7 | [x] | [x] |
| Farmed deer | 4.9 | 37 | 13% |
| Goats | 1.2 | 107 | 1.1% |
| Horses | 0.4 | 195 | 0.2% |
| Others | 0.2 | [x] | [x] |
Notes:
-
Data relates to fully organic livestock only.
-
“Others” include camelids and any livestock not recorded elsewhere.
-
“[x]” indicates no comparable June survey data is available.
-
Totals may differ to the sum of the components due to rounding.
Source: Defra organic farming statistics, June Survey of Agriculture as at 1 June 2025: Livestock and the Cattle Tracing System for cattle populations
Download the full organics dataset
Organic cattle
In 2025, organically reared cattle numbers decreased by 3.8% to 259 thousand head. This represents 2.8% of the total herd in the UK.
Figure 12.5: Number of organic cattle, 2016 to 2025 (thousand head)
Enquiries: organic-stats@defra.gov.uk
| Years | For slaughter | Dairy cows | Other cattle | Total |
|---|---|---|---|---|
| 2016 | 99 | 81 | 116 | 296 |
| 2017 | 111 | 76 | 107 | 294 |
| 2018 | 116 | 88 | 120 | 324 |
| 2019 | 88 | 90 | 123 | 301 |
| 2020 | 122 | 60 | 122 | 304 |
| 2021 | 120 | 59 | 117 | 296 |
| 2022 | 122 | 57 | 119 | 299 |
| 2023 | 129 | 51 | 110 | 290 |
| 2024 | 120 | 48 | 101 | 270 |
| 2025 | 116 | 46 | 98 | 259 |
Notes:
-
Data relates to fully organic livestock only.
-
Totals may differ to the sum of the components due to rounding.
Source: Defra organic farming statistics
Download the full organics dataset
Organic sheep
The number of sheep reared organically decreased by 4.6% to 617 thousand head and accounted for 2.0% of the total flock in the UK.
Figure 12.6: Number of organic sheep, 2016 to 2025 (thousand head)
Enquiries: organic-stats@defra.gov.uk
| Years | Breeding females | Other sheep | Total |
|---|---|---|---|
| 2016 | 431 | 410 | 841 |
| 2017 | 462 | 425 | 887 |
| 2018 | 447 | 380 | 827 |
| 2019 | 390 | 393 | 782 |
| 2020 | 400 | 332 | 731 |
| 2021 | 393 | 330 | 724 |
| 2022 | 385 | 349 | 734 |
| 2023 | 370 | 322 | 692 |
| 2024 | 353 | 294 | 647 |
| 2025 | 340 | 278 | 617 |
Notes:
-
Data relates to fully organic livestock only.
-
Totals may differ to the sum of the components due to rounding.
Source: Defra organic farming statistics
Download the full organics dataset
Organic pigs
The number of pigs reared organically decreased by 21% to 13 thousand head and accounted for 0.3% of the total pig herd in the UK.
Figure 12.7: Number of organic pigs, 2016 to 2025 (thousand head)
Enquiries: organic-stats@defra.gov.uk
| Years | Fattening pigs | Breeding sows | Other pigs | Total |
|---|---|---|---|---|
| 2016 | 21 | 4.3 | 5.7 | 31 |
| 2017 | 25 | 5.2 | 8.7 | 39 |
| 2018 | 21 | 3.8 | 12 | 37 |
| 2019 | 21 | 3.4 | 9.9 | 34 |
| 2020 | 16 | 1.6 | 9.3 | 27 |
| 2021 | 21 | 2.9 | 7.8 | 32 |
| 2022 | 23 | 3.4 | 9.1 | 35 |
| 2023 | 15 | 2.0 | 5.7 | 23 |
| 2024 | 10 | 1.7 | 4.6 | 16 |
| 2025 | 5.8 | 1.3 | 5.8 | 13 |
Notes:
-
Data relates to fully organic livestock only.
-
Totals may differ to the sum of the components due to rounding.
Source: Defra organic farming statistics
Download the full organics dataset
Organic poultry
Organically reared poultry numbers decreased by 2.0% to 4.8 million birds and accounted for 2.6% of the total population in the UK.
Figure 12.8: Number of organic poultry, 2016 to 2025 (thousand birds)
Enquiries: organic-stats@defra.gov.uk
| Years | Broilers | Laying hens | Other poultry | Total |
|---|---|---|---|---|
| 2016 | 1,574 | 1,135 | 112 | 2,821 |
| 2017 | 1,725 | 1,239 | 95 | 3,060 |
| 2018 | 1,879 | 1,413 | 89 | 3,381 |
| 2019 | 1,768 | 1,584 | 112 | 3,464 |
| 2020 | 1,708 | 1,981 | 97 | 3,786 |
| 2021 | 1,910 | 2,015 | 96 | 4,021 |
| 2022 | 1,577 | 2,005 | 83 | 3,665 |
| 2023 | 2,200 | 2,021 | 144 | 4,365 |
| 2024 | 2,511 | 2,174 | 167 | 4,851 |
| 2025 | 2,383 | 2,233 | 139 | 4,755 |
Notes:
-
Data relates to fully organic livestock only.
-
Totals may differ to the sum of the components due to rounding.
Source: Defra organic farming statistics
Download the full organics dataset
Organic operators
In 2025, there were 5,004 producers and processors registered with the organic control bodies in the UK, a decrease of 2.5% from 2024.
Figure 12.9: Organic operators by type, 2016 to 2025
Enquiries: organic-stats@defra.gov.uk
| Years | Producers | Producers & Processors | Processors | Total |
|---|---|---|---|---|
| 2016 | 3,398 | 161 | 2,804 | 6,363 |
| 2017 | 3,465 | 144 | 2,977 | 6,586 |
| 2018 | 3,483 | 136 | 2,569 | 6,188 |
| 2019 | 3,494 | 123 | 2,512 | 6,129 |
| 2020 | 3,407 | 197 | 2,150 | 5,754 |
| 2021 | 3,401 | 205 | 2,126 | 5,732 |
| 2022 | 3,285 | 223 | 1,988 | 5,496 |
| 2023 | 3,193 | 223 | 1,814 | 5,230 |
| 2024 | 3,118 | 227 | 1,788 | 5,133 |
| 2025 | 3,048 | 241 | 1,715 | 5,004 |
Notes:
- Processors can include abattoirs, bakers, storers and wholesalers. The recorded location depends on the address registered with the control bodies and so larger businesses may be recorded at their headquarters.
- In 2018 work was carried out to clarify how operators were recorded. This resulted in a number of operators that were previously recorded as processors being recorded in the correct categories of wholesalers/traders/retailers etc. We were unable to backdate these changes so earlier data are not directly comparable.
- In 2020 work was carried out by some control bodies to group existing operators together, so they effectively became ‘one operator’ whilst previously they may have been separate operators with separate licences.
Source: Defra organic farming statistics
Download the full organics dataset
Table 12.5: Number of organic operators by type and country, 2025
Enquiries: organic-stats@defra.gov.uk
| Country | Number of producers only | Number of producers and processors | Number of processors only | Total organic producers and processors |
|---|---|---|---|---|
| United Kingdom | 3,048 | 241 | 1,715 | 5,004 |
| England | 2,068 | 192 | 1,489 | 3,749 |
| Wales | 453 | 28 | 74 | 555 |
| Scotland | 396 | 15 | 119 | 530 |
| Northern Ireland | 131 | 6 | 33 | 170 |
Notes:
- Processors can include abattoirs, bakers, storers and wholesalers. The recorded location depends on the address registered with the control bodies and so larger businesses may be recorded at their headquarters.
Source: Defra organic farming statistics
Download the full organics dataset
Table 12.6: Number of organic operators by country, 2022 to 2025
Enquiries: organic-stats@defra.gov.uk
| Country | 2022 | 2023 | 2024 | 2025 | Percentage change 2024/2025 |
|---|---|---|---|---|---|
| United Kingdom | 5,496 | 5,230 | 5,133 | 5,004 | -2.5% |
| England | 4,103 | 3,882 | 3,841 | 3,749 | -2.4% |
| Wales | 663 | 639 | 570 | 555 | -2.6% |
| Scotland | 528 | 521 | 530 | 530 | 0.0% |
| Northern Ireland | 202 | 188 | 192 | 170 | -11% |
Notes:
- Processors can include abattoirs, bakers, storers and wholesalers. The recorded location depends on the address registered with the control bodies and so larger businesses may be recorded at their headquarters.
Source: Defra organic farming statistics