Chapter 11: Agri-environment
Updated 3 September 2026

© Crown copyright 2026
This publication is licensed under the terms of the Open Government Licence v3.0 except where otherwise stated. To view this licence, visit nationalarchives.gov.uk/doc/open-government-licence/version/3 or write to the Information Policy Team, The National Archives, Kew, London TW9 4DU, or email: psi@nationalarchives.gov.uk.
Where we have identified any third party copyright information you will need to obtain permission from the copyright holders concerned.
This publication is available at https://www.gov.uk/government/statistics/agriculture-in-the-united-kingdom-2025/chapter-11-agri-environment
Summary
- Estimated greenhouse gas and air pollution emissions from agriculture have fallen 15% between 1990 and 2024.
- After a continuous increase from 2010 to 2018, total pesticide usage declined 27% in 2020. This was followed by an 18% increase in 2022, followed by a 14% decline in 2024 to levels seen in 2020.
- Since the late 1990s, nitrogen and phosphate fertiliser application rates have fallen, and were at their lowest in 2022. Phosphate application rates have remained at their lowest through to 2024 at 10 kg/ha, while nitrogen application rates increased in 2023 before declining again in 2024 to 73 kg/ha.
- Soil nutrient balances for nitrogen and phosphorus have fluctuated over time, but have shown an overall downward trend and were at their lowest levels in 2022 at 78kg/ha and 4.5kg/ha for nitrogen and phosphorus respectively.
Introduction
Whilst agriculture contributes less than 1% to the United Kingdom’s economy, it provides around three-quarters of the indigenous food we eat and is responsible for around 70% of land use.
Agricultural production and the associated land use and management are key drivers of the environmental impacts from the sector. A key challenge is to decouple production from its environmental impact so that production can be increased whilst reducing the overall environmental footprint.
Farm practices and the use of inputs (particularly fertilisers and pesticides) directly influence the environmental pressures from farming, including the quality, composition and availability of habitats, and impact on air, water and soils.
In recent years, the key drivers of change in terms of environmental pressures from agriculture are declines in the number of livestock, specifically ruminants, and reductions in fertiliser applications, particularly on grassland.
All the data presented in this chapter is the most recent at the time of publication. Links to further information on source data has been provided for each section of this chapter.
Emissions
Agriculture accounts for around 13% of greenhouse gases in the UK. Three greenhouse gases emitted by agriculture are nitrous oxide, methane and carbon dioxide. Agriculture is also responsible for a large proportion of the UK’s ammonia emissions, which impact on air quality and subsequently human and animal health.
Figure 11.1 Emissions from agriculture in 2024 (percentage)
| Emissions | Agriculture | Other sectors or sources | Total |
|---|---|---|---|
| Nitrous oxide | 59 | 41 | 100 |
| Methane | 49 | 51 | 100 |
| Carbon dioxide | 2.5 | 98 | 100 |
| Ammonia | 89 | 11 | 100 |
Notes:
- Data for greenhouse gas emissions are revised each year to take account of methodological improvements in the UK emissions inventory.
Source: UK territorial greenhouse gas emissions national statistics, DESNZ (Department for Energy Security and Net Zero), Emissions of air pollutants, Defra
Download the full agri-environment dataset
Agriculture is a major source of nitrous oxide, methane and ammonia in the UK, accounting for 59% of nitrous oxide emissions, 49% of methane emissions and 89% of ammonia emissions in 2024. In contrast, agriculture only accounted for 2.5% of carbon dioxide emissions in 2024.
As shown in Figures 11.2 to 11.4, total amounts of nitrous oxide, methane and carbon dioxide have reduced since 1990, however this is mainly due to reductions in non-agricultural sources. Therefore, whilst agriculture has seen reductions in emissions of nitrous oxide and methane, they now account for a larger proportion of total emissions.
Figure 11.2 Nitrous oxide emissions for 1990 and 2024 (million tonnes carbon dioxide equivalent)
| Year | Agriculture | Non-agriculture | Total |
|---|---|---|---|
| 1990 | 16 | 30 | 46 |
| 2024 | 12 | 8.7 | 21 |
Notes:
- Data for greenhouse gas emissions are revised each year to take account of methodological improvements in the UK emissions inventory.
Source: UK territorial greenhouse gas emissions national statistics, DESNZ
Download the full agri-environment dataset
The majority of agricultural nitrous oxide emissions are sourced from soils, particularly as a result of nitrogen fertiliser application, manure (both applied and excreted on pasture) and leaching or run-off. In 2024, nitrous oxide emissions from agriculture were estimated to have fallen by approximately 26% since 1990. This is consistent with trends in fertiliser usage.
Figure 11.3 Methane emissions for 1990 and 2024 (million tonnes carbon dioxide equivalent)
| Year | Agriculture | Non-agriculture | Total |
|---|---|---|---|
| 1990 | 33 | 99 | 132 |
| 2024 | 27 | 28 | 55 |
Notes:
- Data for greenhouse gas emissions are revised each year to take account of methodological improvements in the UK emissions inventory.
Source: UK territorial greenhouse gas emissions national statistics, DESNZ
Download the full agri-environment dataset
The majority of methane emissions from agriculture are from enteric fermentation (digestive processes) in ruminating animals, with manure management practices accounting for the remainder. In 2024, methane emissions from agriculture were estimated to have fallen by 18% since 1990, mainly as a result of decreasing livestock numbers.
Figure 11.4 Carbon dioxide emissions for 1990 and 2024 (million tonnes carbon dioxide equivalent)
| Year | Agriculture | Non-agriculture | Total |
|---|---|---|---|
| 1990 | 5.6 | 592 | 598 |
| 2024 | 7.2 | 283 | 291 |
Notes:
- Data for greenhouse gas emissions are revised each year to take account of methodological improvements in the UK emissions inventory.
Source: UK territorial greenhouse gas emissions national statistics, DESNZ
Download the full agri-environment dataset
Agriculture’s emissions of carbon dioxide have remained low since 1990 and accounted for only 2.5% of total emissions in 2024. Whilst the proportion of carbon dioxide emissions related to agriculture are low, levels increased in 2004, where they have since fluctuated but remained at similar levels.
Figure 11.5 Ammonia emissions for 1990 and 2024 (thousand tonnes)
| Year | Agriculture | Non-agriculture | Total |
|---|---|---|---|
| 1990 | 283 | 25 | 308 |
| 2024 | 227 | 29 | 256 |
Source: Emissions of air pollutants, Defra
Download the full agri-environment dataset
In 2024, agriculture accounted for 89% of the UK’s ammonia emissions. The main sources of ammonia emissions in the UK are agricultural soils and livestock, in particular cattle.
In 2024, ammonia emissions from agriculture are estimated to have fallen by 20% since 1990 due to long-term reductions in cattle numbers and more efficient fertiliser use. Emissions have generally fluctuated since 2010, in part driven by annual variations in weather conditions affecting crop planting and fertiliser use, as well as energy prices affecting the use of fertilisers.
Pesticide use
Figure 11.6 Weight of pesticides applied to arable crops, 2010 to 2024 (tonnes)
| Year | Fungicides | Growth regulators | Herbicides | Insecticides | Molluscicides | Other | Total |
|---|---|---|---|---|---|---|---|
| 2010 | 4,811 | 2,631 | 6,253 | 336 | 174 | 0 | 14,205 |
| 2012 | 5,292 | 2,803 | 6,619 | 344 | 126 | 0 | 15,183 |
| 2014 | 5,592 | 2,730 | 7,051 | 245 | 132 | 92 | 15,843 |
| 2016 | 5,883 | 2,639 | 7,770 | 187 | 158 | 88 | 16,724 |
| 2018 | 5,745 | 2,547 | 8,414 | 164 | 174 | 90 | 17,134 |
| 2020 | 4,449 | 1,799 | 6,074 | 133 | 96 | 1.1 | 12,552 |
| 2022 | 4,045 | 2,672 | 7,848 | 135 | 85 | 15 | 14,799 |
| 2024 | 3,898 | 2,197 | 6,445 | 93 | 113 | 21 | 12,767 |
Notes:
-
Data not available for values showing as “0”.
-
‘Other’ refers to chemicals grouped together because they were applied to less than 0.1% of the total area treated with pesticides.
Source: Pesticide usage surveys, FERA
Download the full agri-environment dataset
Plant protection products (pesticides) are used to regulate growth and to manage pests, weeds, and diseases in crops. They play a major role in maintaining high crop yields and therefore greater production from agricultural land. However, they can have detrimental impacts on the environment, particularly on terrestrial and aquatic biodiversity.
The need for pesticide usage varies from year to year depending on growing conditions, particularly the weather which influences disease, weed and pest pressures. In addition, longer term variations are due to changes in the range and activity of active substances, the economics of pest control, and resistance issues.
In the United Kingdom, pesticides applied to arable crops (which include cereals, oilseeds, potatoes, pulses, and sugar beet) make up around 85-90% of all pesticides applied to agricultural land. Whilst the estimated total area used for growing arable crops has remained relatively stable since 2010 (~4 million hectares), the weight of pesticides applied to these crops has varied over the same time period.
In absolute terms, there has been little change in total pesticide usage since 2010 (14,205 tonnes in 2010 vs 12,767 tonnes in 2024). Within that time period, however, between 2010 to 2018 there was a gradual increase in the weight of pesticides applied. Substantial drops in pesticide usage were seen in both 2020 and 2024, due to weather disruptions to normal cropping patterns in the previous autumns, reducing winter sowing and forcing a shift toward spring sown crops, which require fewer pesticide applications.
Fertiliser use
Nitrogen and phosphorous are key nutrients needed for crop growth. A deficit in either or both of these nutrients can have a negative impact on crop yields and levels of production. The main source of these nutrients are mineral fertilisers and organic fertilisers such as manures and slurries from livestock.
Fertilisers can have an adverse impact on the environment depending on the application method, through over-application and natural losses from soils and manures. These impacts include water quality (nitrogen and phosphorous levels in waterbodies), air quality (ammonia emissions) and climate change (nitrous oxide emissions).
Most agricultural soils do not contain enough naturally occurring plant-available nitrogen to meet the needs of a crop throughout the growing season so supplementary nitrogen applications are needed each year. Nitrogen usually has a large immediate effect on crop growth, yield and quality. Correct rate and timing of applications is important to ensure crop growth requirements are met.
Annual levels of nitrogen and phosphate applications are influenced by fertiliser prices, crop prices, crop type and weather-related issues during the growing season.
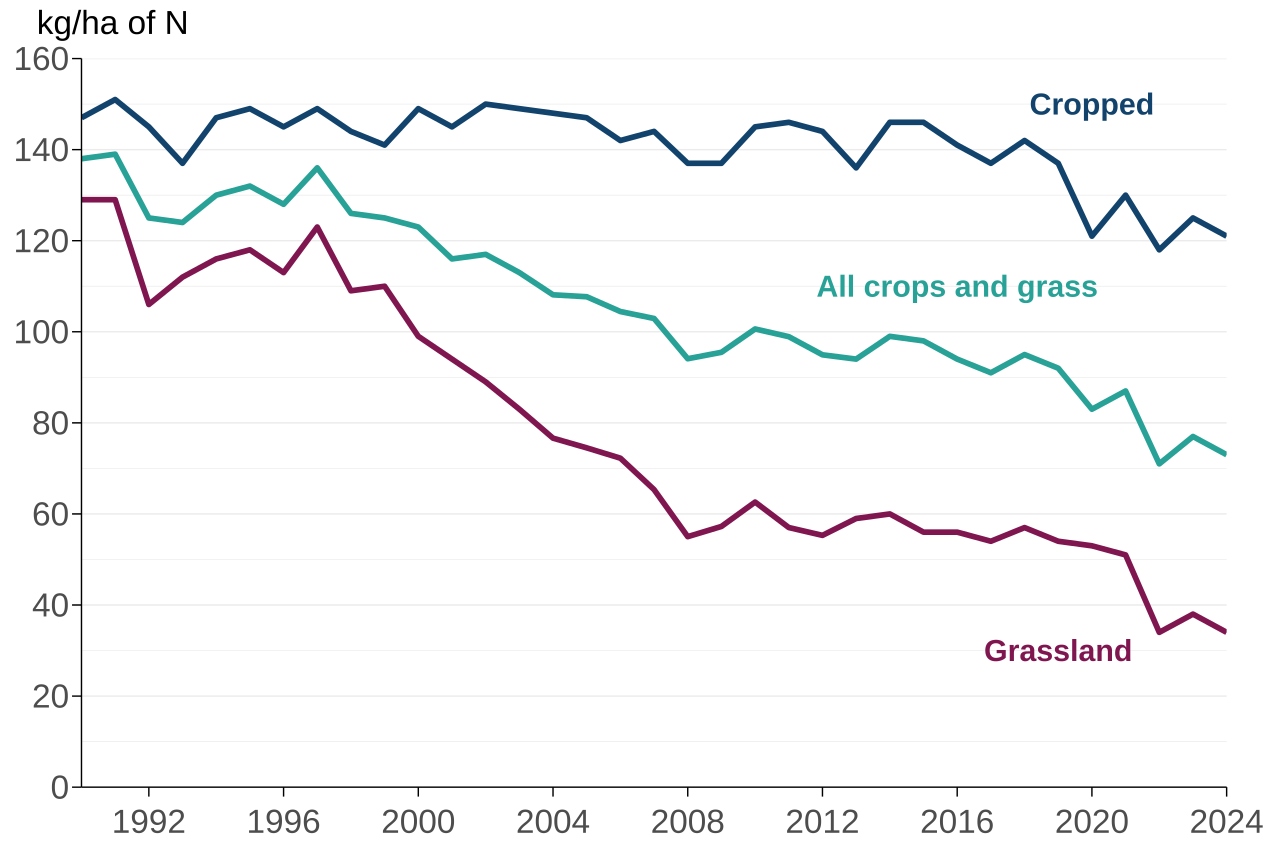
Figure 11.7 Overall application rate of nitrogen (N) on all crops and grass (kilograms per hectare), Great Britain, 1990 to 2024
Notes:
- Cropped land is tillage crops.
Source: British survey of fertiliser practice, Defra
Text description of Figure 11.7: Figure 11.7 is a line chart showing the overall application rate of nitrogen on all crops and grass, cropped land and grassland from 1990 to 2024. Overall application rates of nitrogen have shown an overall decline on grassland, steadily decreasing from around 1998. Rates have been similar since 2008, although between 2021 and 2022 there was the largest decline for some years. Application rates on cropped land have fluctuated over time but saw a large decline in 2020 before increasing again in 2021. Rates declined again in 2024, following an increase in 2023.
Download the full agri-environment dataset
In Great Britain between 1990 and 2018 the overall application rate of mineral nitrogen on cropped land was largely in the range of 140-150 kg/ha (kilograms per hectare), but it has declined in recent years. In 2024, the rate of nitrogen application on cropped land was 121 kg/ha. This was a decrease of 4 kg/ha compared to 2023.
For grassland, nutrient application rates have always been lower than for cropped land. Between 1990 and 2024, there was a downward trend in the overall mineral nitrogen application rate on grassland. The fall in application rates until 2008 is likely to be related in part to decreases in ruminant livestock numbers. The rate of nitrogen application to grassland remained relatively constant until 2022, when it dropped by 17kg/ha (-33%) to 34kg/ha, and has remained low since. This recent reduction in application rates coincides with high prices for fertilisers in 2022 and 2023, driven by increases in the cost of gas, a key ingredient in fertiliser production.
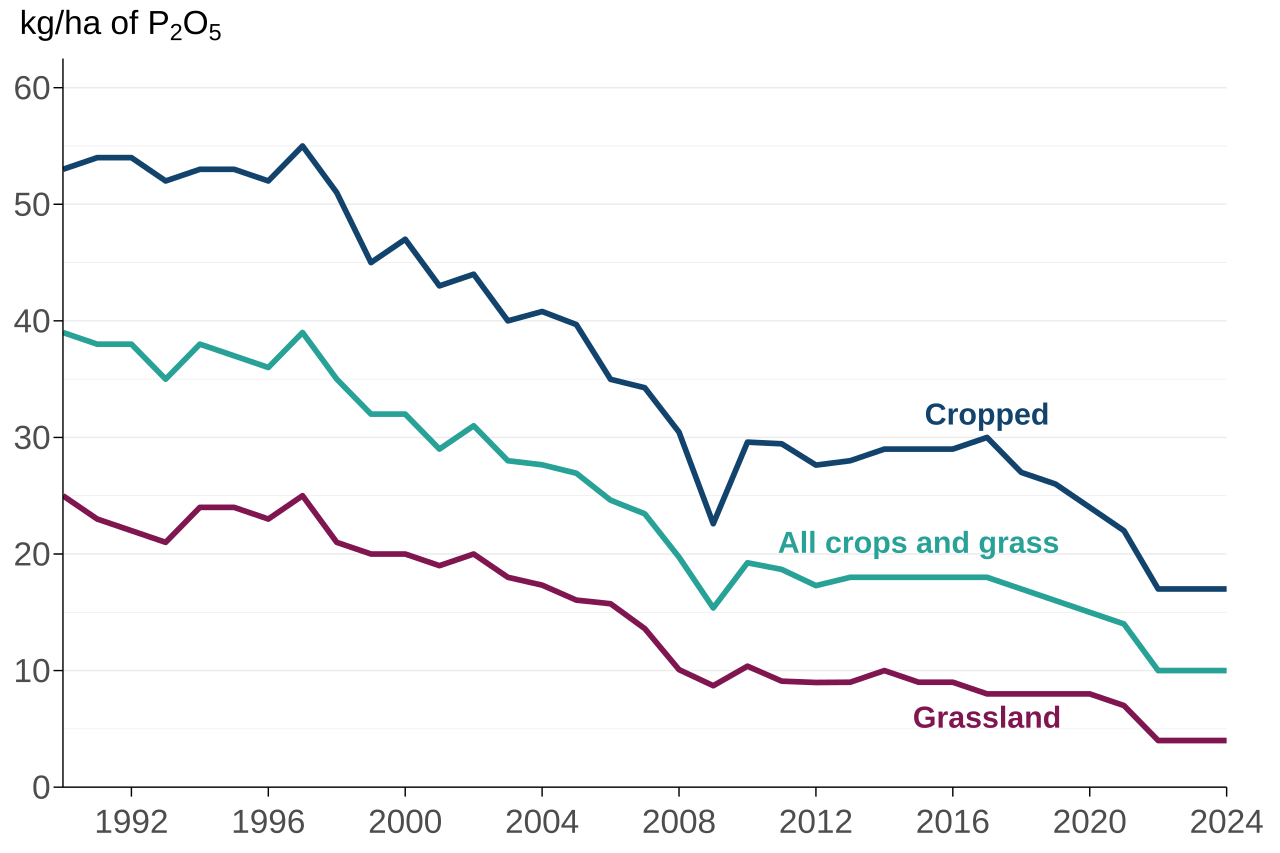
Figure 11.8 Overall application rate of phosphate (P2O5) on all crops and grass (kg/ha), Great Britain, 1990 to 2024
Notes:
- Cropped land is tillage crops.
Source: British survey of fertiliser practice, Defra
Text description of Figure 11.8: Figure 11.8 is a line chart showing the overall application rate of phosphate on all crops and grass, cropped land and grassland from 1990 to 2024. Whilst overall rates have been higher on cropped land, the trends of phosphate application rates on cropped land and grassland have been similar, showing a steady overall decline, which has levelled off since 2022.
Download the full agri-environment dataset
Phosphate is applied in fertilisers and manures, particularly to replace the quantities removed in harvested crops. Most British soils can hold large quantities of phosphate in forms that are available for crop uptake over several years. Therefore, managing the supply of phosphate is based on maintaining appropriate levels in the soil, with the timing of applications less critical.
Since 2022, phosphate application rates have remained at the lowest level in the timeseries for both cropped land and grassland. In 2024, the overall application rate on all crops and grass was 10 kg/ha, which is around a quarter of the level seen in 1990.
As with nitrogen, application rates of phosphate on grassland have always been less than on cropped land and both have shown an overall downward trend between 1990 and 2024. In recent years, the rates for grassland levelled off from around 2012, before decreasing to their lowest level of 4kg/ha from 2022 onwards.
Soil nutrient balances
Soil nutrient balances provide an indication of the overall environmental pressure from nitrogen and phosphorus in agricultural soils. They measure the difference between nutrients applied to soils (largely as fertilisers and manures) and those removed from soils by the growth of crops, including grass for fodder and grazing. They give an indication of the potential risk associated with losses of nutrients to the environment, which can impact on air and water quality and on climate change.
The nutrient balances are used as a high-level indicator of farming’s pressure on the environment and how that pressure is changing over time. The balances do not estimate the actual losses of nutrients to the environment, but significant nutrient surpluses are directly linked with losses to the environment.
An increase in the balance per hectare indicates a greater environmental risk from nutrient losses and their associated emissions, whereas a decrease in the balance per hectare broadly indicates a reduced environmental risk. However, there is a risk that nutrient deficits lead to poor soil fertility and subsequent loss of yields.
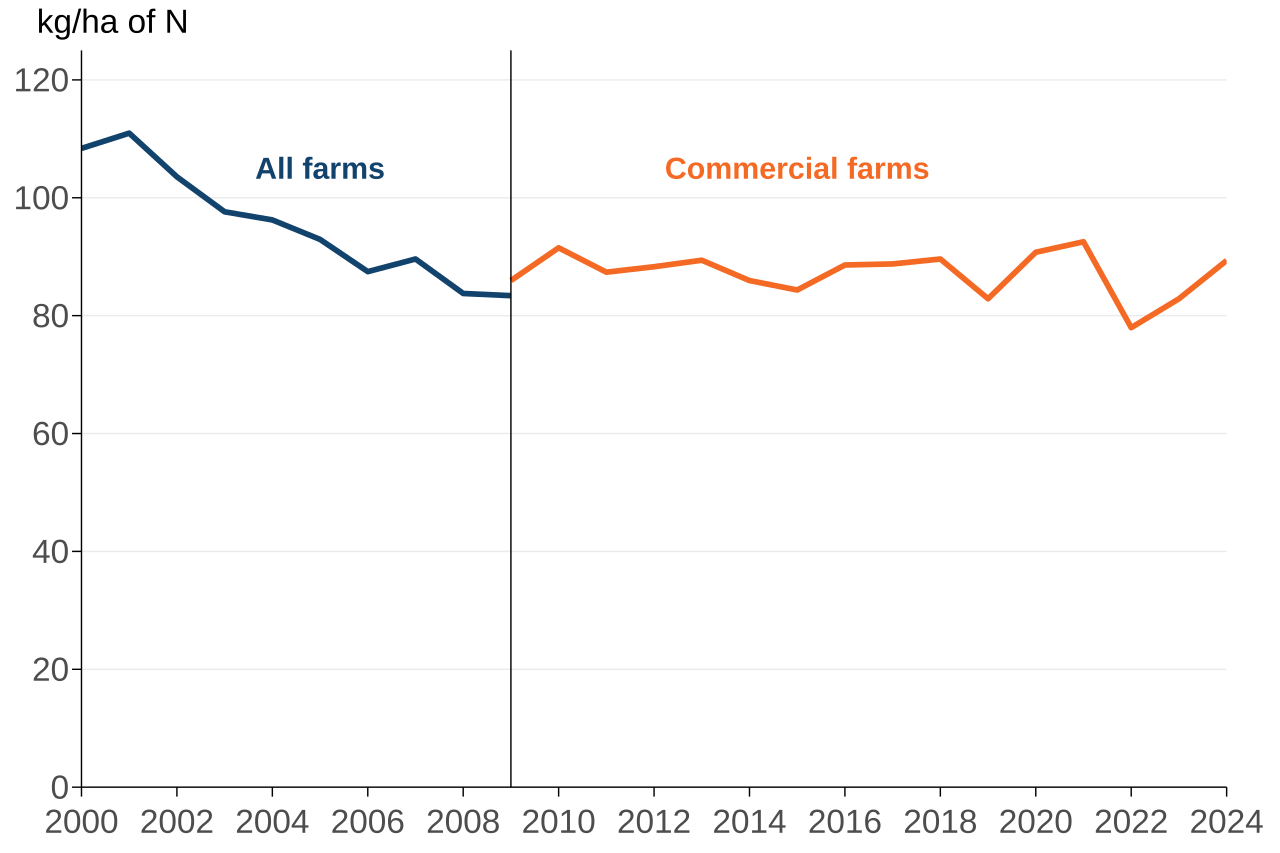
Figure 11.9 Nitrogen (N) soil nutrient balance (kg/ha), 2000 to 2024
Notes:
- From 2010 in England, June survey data for land and animals is collected only for commercial farms.
- From 2000 to 2008 data is for all farms and hence based on a larger population.
- For comparability, data for 2009 have been presented on both the definition used for 2000 to 2008 and that used from 2010 onwards.
- The series break in 2009 is due to changes in farm survey data collection.
Source: Soil nutrient balances, Defra
Text description of Figure 11.9: Figure 11.9 is a line chart showing the nitrogen soil nutrient balance on farms from 2000 to 2024. Balances have fluctuated over time and remained between 80 kg/ha and 100 kg/ha from 2002 up to 2021. In 2022, the balance dropped below 80 kg/ha for the first time since the series began, before increasing again in 2023 and 2024, with a balance of 89 kg/ha in 2024.
Download the full agri-environment dataset
Estimates for 2024 show that the nitrogen balance for the UK was a surplus of 89 kg/ha on managed agricultural land. This was an increase of 6.5kg/ha (7.8%) compared to 2023. This was driven by a decrease in total offtake of 7.6 kg/ha (-7.7%) mainly from a reduction in offtake from harvested cereal crops. Total offtake was more than offset by a decrease in total inputs of 1.1 kg/ha (-0.6%) over the same period, mainly from a reduction in livestock manure production and a reduction in estimated biological fixation.
The 2024 estimate shows a reduction of 19 kg/ha (18%) to the nitrogen balance surplus compared to 2000. Since 2000, total inputs of nitrogen decreased by 57 kg/ha (-24%), which more than offset a decrease in total offtake of 38 kg/ha (-29%). The main drivers behind the decrease in total inputs of nitrogen were reductions in the application of both inorganic manufactured fertiliser and cattle manure. The main drivers behind the decrease in total offtake of nitrogen were a decrease in pasture consumption due to a reduction in the number of grazing livestock, and a decrease in harvested cereals.
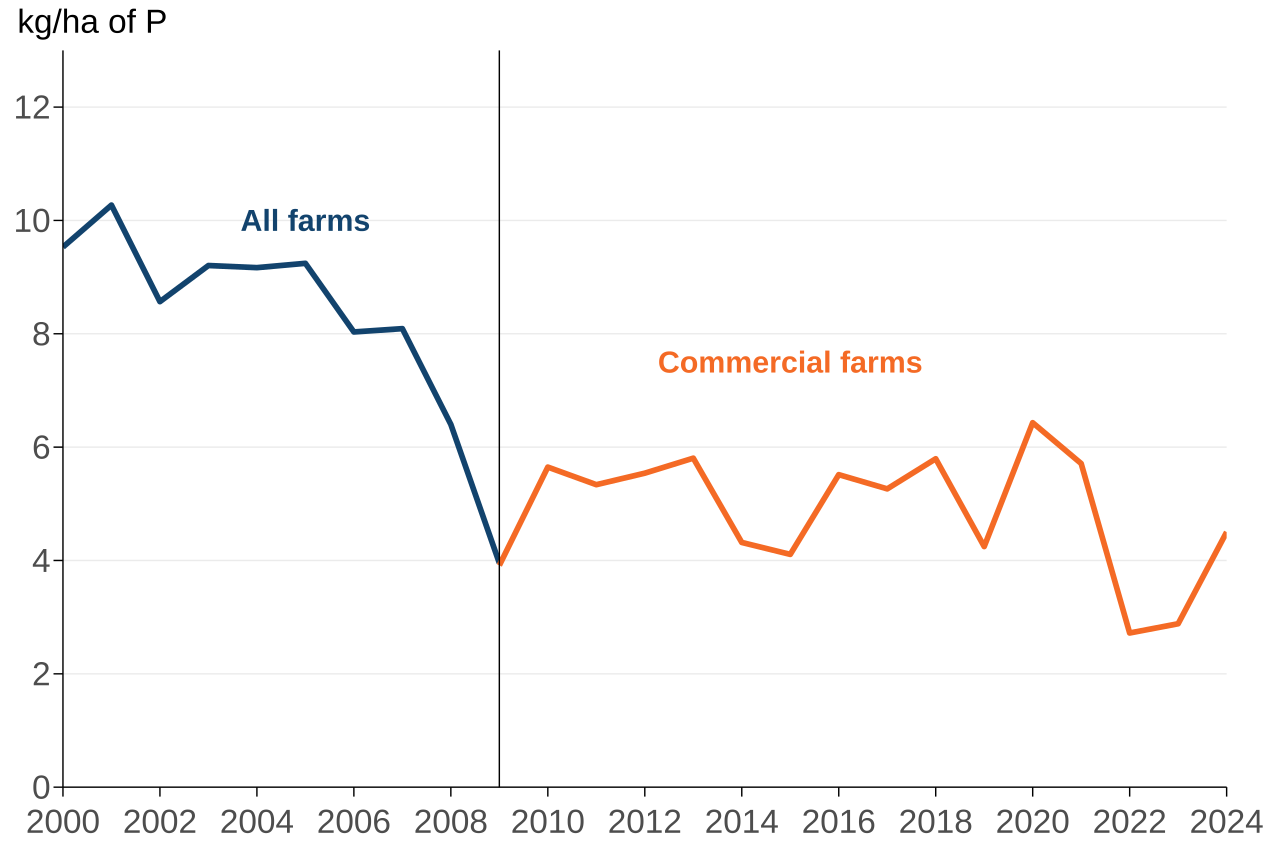
Figure 11.10 Phosphorus (P) soil nutrient balance (kg/ha) 2000 to 2024
Notes:
- From 2010 in England, June survey data for land and animals is collected only for commercial farms.
- From 2000 to 2008 data is for all farms and hence based on a larger population.
- For comparability, data for 2009 have been presented on both the definition used for 2000 to 2008 and that used from 2010 onwards.
- The series break in 2009 is due to changes in farm survey data collection.
Source: Soil nutrient balances, Defra
Text description for Figure 11.10: Figure 11.10 is a line chart showing the phosphorus soil nutrient balance on farms from 2000 to 2024. The soil nutrient balance has fluctuated over this period, but showed an overall decline from approximately 10 kg/ha in 2000 to approximately 4 kg/ha in 2009. Since then, the balance has continued to fluctuate but remained between 4 and 8 kg/ha up to 2021. In 2022, the balance fell to 2.7 kg/ha, which was the lowest level since the time series began, and remained low in 2023 before increasing to 4.5 kg/ha in 2024.
Download the full agri-environment dataset
Estimates for 2024 show that the phosphorus balance for the UK was a surplus of 4.5 kg/ha on managed agricultural land. This is an increase of 1.6kg/ha (56%) compared to 2023. This was driven by a decrease in total offtake of 1.2 kg/ha (-6.8%) (mainly from a reduction in harvested crops), which more than offset an increase in total inputs of phosphorus of 0.5kg/ha (2.3%) (mainly from an increase in the application of inorganic manufactured fertiliser) over the same period.
The longer-term trend (2024 compared to 2000) shows an overall reduction of 5.0 kg/ha (-53%). Over this time, total inputs of phosphorus decreased by 10 kg/ha (-34%), which more than offset a decrease in total offtake of 5.5 kg/ha (-26%).
As with nitrogen, the main drivers behind the decrease in total inputs of phosphorus were reductions in the application of both inorganic manufactured fertiliser and cattle manure. The main driver behind the decrease in total offtake of phosphorus was a decrease in pasture consumption due to a reduction in the number of grazing livestock.
Revisions
The methodologies for the underlying data sources of this chapter are often reviewed and updated. Wherever applicable, data in this chapter is revised to reflect any changes to the underlying data following any methodological changes or routine updates. Updates have been made to historic GHG emissions data to remove small amounts from international aviation. This is in line with the latest DESNZ advice and ensures the data aligns with data reported for UK territorial totals.