Statistical analysis of candidate progression through judicial selection tools 1 April 2015 to 31 March 2021
Published 9 December 2021

© Crown copyright 2021
This publication is licensed under the terms of the Open Government Licence v3.0 except where otherwise stated. To view this licence, visit nationalarchives.gov.uk/doc/open-government-licence/version/3 or write to the Information Policy Team, The National Archives, Kew, London TW9 4DU, or email: psi@nationalarchives.gov.uk.
Where we have identified any third party copyright information you will need to obtain permission from the copyright holders concerned.
This publication is available at https://www.gov.uk/government/statistics/ad-hoc-analysis-of-judicial-diversity-statistics-2021/statistical-analysis-of-candidate-progression-through-judicial-selection-tools-1-april-2015-to-31-march-2021
1. Main Points
This publication is an ad-hoc experimental statistical release based on the data from judicial selection exercises concluding in the period between 1 April 2015 and 31 March 2021. In total, it contains data from 46 legal and 14 non-legal exercises (listed in the accompanying tables), equivalent to 22,000 legal and 2,300 non-legal applicants.
The purpose of this analysis is to control for the effect of selected factors in relation to the progress of different groups through judicial selection tools, in order to understand the differences in the success for target groups in both legal and non-legal recruitment exercises.
The methodology involves fitting statistical (logistic regression) models to the data to identify variables which are statistically significant in explaining variations in success rates for a particular tool. These variables are then controlled for in an approach which involves calculating relative rate indices for each tool and characteristic of interest.
The controlling process aims to isolate the impact of a particular factor – for example, ethnicity – by averaging out the impact of other significant factors. This allows an assessment to be made of whether, for example, variations in success rates for Black, Asian and minority ethnic (BAME) and white candidates might be explained by other factors – for example, legal profession or having attended an Oxbridge university.
There are limitations relating to this analysis, which are expanded upon below, but it should be noted that even with the number of applicants involved, the nature of the analysis means that results can be volatile and a small change in numbers of one group could lead to different conclusions. And in general, an analysis framework such as this will not pick up on all social factors related to progression through a series of selection exercises, so conclusions will only ever be limited.
This is a summary of the main results:
For legal exercises:
-
There is no difference in success rates between women and men.
-
Even after controlling for legal profession and Oxbridge attendance, overall Black, Asian and minority ethnic candidates do less well than white candidates for the majority of selection tools.
-
Similarly, overall solicitor candidates do less well than barrister candidates for all selection tools, even when controlling for ethnicity and Oxbridge attendance.
For non-legal exercises:
-
There is no difference in success rates between women and men.
-
There is no evidence of differences between outcomes for Black, Asian and minority ethnic candidates and white candidates for the selection tools analysed. Controlling for the additional variables of gender and Oxbridge attendance also shows very little difference.
2. Statistician’s Comment
This publication presents a summary of the analysis undertaken to examine more closely the difference in the progression between some groups of candidates when applying for judicial roles, by identifying and controlling for various factors that are found to be significant.
In general, the results show that the factors that were investigated for this report, when specifically controlled for, do not alone explain the differences in progression observed between certain candidate groups – for both legal and non-legal exercises.
Gender was not found to be a significant factor in progression through the judicial application process. However, in legal exercises at least, differences in success rate between Black, Asian and minority ethnic and white candidates cannot be explained by differences in profession or Oxbridge attendance. Similarly, different success rates between solicitors and barristers cannot be explained by differences in ethnicity or Oxbridge attendance. But, for the smaller number of non-legal exercises, there was no evidence of differences in the outcomes for Black, Asian and minority ethnic candidates compared to white candidates, even though the selection tools used for both types of exercise are the same.
The statistics in this report are classified as experimental as the methodology was recently developed, and as such the methods and approach used in this report are subject to modification, although this is an ad hoc report meaning that no future iterations of this publication are planned. The intention is for further research and analysis to be conducted, particularly where the steepest drop-offs of target group candidates are seen, using a blend of qualitative and quantitative methods, in order to better understand the factors influencing target group progression through selection exercises.
3. Things you need to know
3.1 Background
Overall
The annual publication of JAC diversity statistics (since 2020 in the Diversity of the Judiciary publication) has shown differences in the progression of certain groups in JAC exercises – namely women, BAME, disabled and solicitor candidates. These are the JAC’s four ‘target groups’ of candidates who are underrepresented in the judiciary. In order to better understand these differences, further analysis was carried out on data collected since 2015 to investigate the effect of selected factors in relation to the progress of different groups through the different selection tools – as described below. This ad-hoc publication summarises the main findings of those analyses.
The different JAC selection tools are as follows:
-
Online multiple-choice test - marked automatically, typically used at the first stage of large fee-paid exercises where there may be thousands of applicants.
-
Online scenario test - free-text answers that are marked name-blind by judges, typically used as the second stage of large fee-paid exercises.
-
Paper sift - candidate applications are assessed alongside independent assessments by a panel with lay and judicial members; name-blind since 2020.
-
Telephone assessment - candidates respond to questions posed by a lay and judicial panel on material provided beforehand, as second stage (limited use).
-
Selection day - a panel, of typically two lay members and a judge, conduct a competency-based interview alongside other elements including role play in the case of fee-paid entry-level roles. In almost all cases this will have been preceded by one or more of the other tools.
Much of the diversity data included in this publication depends on voluntary self-declaration by candidates. All percentages are calculated using the proportion of individuals where the characteristic is known. A characteristic is considered to be ‘unknown’ if an individual has asked for their data to not be shared further, has chosen ‘prefer not to say’, or has left the answer blank.
For this publication, as with the annual Diversity of the Judiciary publication, the JAC ‘BAME’ category contains all ethnic groups other than the ‘white’ groups, ‘prefer not to say’ and ‘unknown’. The same approach is taken by the Judicial Office and all other partners in the Judicial Diversity Forum. So, we have aggregated the Asian, Black, Mixed and Other groups and refer to this group using the term “Black, Asian and minority ethnic (BAME)”, for comparison with the White group. We avoid (after this point) usage of the “BAME” acronym in the text of this report, opting to write the term in full. However, “BAME” will occasionally be seen in the charts and accompanying statistical tables, though only where limited space prevents using the whole term.
Candidate pools
Data on the legal professions included in this publication are defined as follows:
-
Solicitors: all practising solicitors i.e. those who hold a practising certificate (PC).
-
Barristers: all practising barristers (those who hold a PC).
As described in the annual Diversity of the Judiciary publication, solicitors and barristers comprise very different populations and professions. Their population sizes are highly varied, as are their members’ qualification, progression and employment processes, eligibility and potential interest in applying for, and consequent representation in, the judiciary. As a result, caution is advised in making comparisons between different professions.
Eligibility for legal selection varies from one exercise to another, where for some salaried posts, candidates are expected to have previous judicial experience, with a minimum of 30 completed sitting days, not including training or sick days. Non-legal posts on tribunals cover a diverse range of areas, such as agriculture, education, physical and mental health, disability, transport, and property, and these typically will have eligibility criteria (for example, membership of an appropriate professional body).
Relative Rate Index (RRI)
The Relative Rate Index (RRI) gives a standardised measure of difference between groups. These statistics use this metric to give a standardised view of any disparity of outcomes on recruitment by diversity characteristic.
The RRI is calculated by dividing the rate of success (i.e. the percentage of those who applied that accepted a formal offer) for one group by the rate of success for the other group with a diversity characteristic, thus creating a single standardised ratio measure of relative difference in outcomes between those two groups. If the rates were the same, the result would be a value of 1, which would indicate identical rates for both groups (that is a parity of outcomes). Deviation from 1 in either direction suggests a difference in the rates of outcomes.
A methodological review of the statistical reporting in the annual JAC publication was recently conducted, with the final report published in February 2020[footnote 1] , with particular focus on the use and interpretation of the RRI values used. It should be noted that the RRIs calculated in this ad hoc publication relate to the pool of candidates who applied, rather than the eligible pool as used in the annual combined reports.
The Baseline RRI figures in this publication relate to comparisons between groups before controlling for any factors, and the Adjusted RRI figures are the re-calculated figures once those control factors have been incorporated. For example, in table 1 the baseline RRI value comparing BAME and white candidates for the paper sift stage was 0.59, but when controlling for current legal role and Oxbridge attendance, the adjusted RRI value was 0.67.
When comparing rates and the RRI, it is important to consider uncertainty, to avoid the over-interpretation of fluctuations in outcomes that may be the result of chance alone. Tests of statistical significance have been conducted on the RRI estimates in this publication to ensure their interpretation takes full account of the probability that the observed outcome may be the result of chance alone. Where a RRI is significant at the 95% confidence level, this has been denoted against the RRIs in Table 1 with a ‘*’.
In this publication we refer to two types of significance: practical significance and statistical significance. Practical significance refers to when an RRI for a particular comparison between two groups falls outside the 0.8 to 1.25 ‘zone of tolerance’; if it falls outside these bounds the result can be considered to be of practical importance. Statistical significance refers to when there is a less than 5% chance that a result is due to random variation, and means we are confident that there is a real difference between two groups of candidates.
3.2 Methodology
An approach was developed by MoJ statisticians with external expert validation and endorsed by the Judicial Diversity Forum (JDF). This involved fitting statistical (logistic regression) models to the data to identify variables which are statistically significant in explaining variations in success rates for a particular selection tool. These variables were then controlled for in an approach which involved calculating Relative Rate Indices (RRIs) for each tool and characteristic of interest.
The controlling process aims to isolate the impact of a particular factor – for example, ethnicity – by averaging out the impact of other significant factors. This allows an assessment to be made as to whether, for example, variations in success rates for Black, Asian and minority ethnic and white candidates might be explained by other factors – for example, legal profession or having attended an Oxbridge university.
3.3 Factors selected, and those found to be significant
The following controlling factors were considered: ethnicity, current legal role and whether attended Oxbridge (which are characteristics consistently associated with variations in candidate performance), in addition to gender, socio-economic background (defined as parents’ university attendance, type of school attended, or both) and length of post-qualification experience (above or below 15 years). Disability was not considered in these analyses due to the low number of disabled candidates at each exercise stage. The results for non-legal roles were different to those for legal roles.
For Legal exercises:
-
Gender was not found to be a significant factor except at the paper sift stage.
-
Ethnicity, profession and Oxbridge attendance were identified as significant factors through the process as a whole.
-
The impact of ethnicity and profession was considered for all selection tools.
-
Social mobility was found to be a significant factor in some stages of the process.
-
There were no differences seen in the results for court and tribunal exercises when analysed separately, and so are not included in this report.
For Non-Legal exercises:
-
Unlike for the legal exercises, there is no variable for ‘current legal role’.
-
Gender and Oxbridge attendance are used as explanatory variables for all selection tools (though these are not always significant, both are used for consistency).
-
As social mobility was not found to be a significant factor, it was not included in the analysis for non-legal exercises.
4. Results
4.1 Legal exercises – Gender
Gender was not found to be a significant factor except at the paper sift stage, where being a woman was associated with an increased chance of success. In terms of the JAC target groups, gender was therefore not included in the analysis of the legal exercises.
4.2 Legal exercises - Ethnicity (Table 1)
Overall, for all candidates in the legal exercises covered in this report, the success rate for Black, Asian and minority ethnic candidates (6%) was lower than for White candidates (14%). This difference (RRI = 0.44) was both statistically and practically significant.
Split by stage of application
Across all selection tools, the success rate for Black, Asian and minority ethnic candidates were lower than for White candidates. These differences were all statistically significant, and apart from selection day, were also practically significant. The greatest differential between Black, Asian and minority ethnic and White candidates was seen for the paper sift (RRI = 0.59) and qualifying test (RRI = 0.58) stages, the JAC’s two first-stage shortlisting tools.
Figure 1: RRI for Black, Asian and minority ethnic compared to White candidates, by selection tool, for all legal exercises 2015/16 to 2020/21
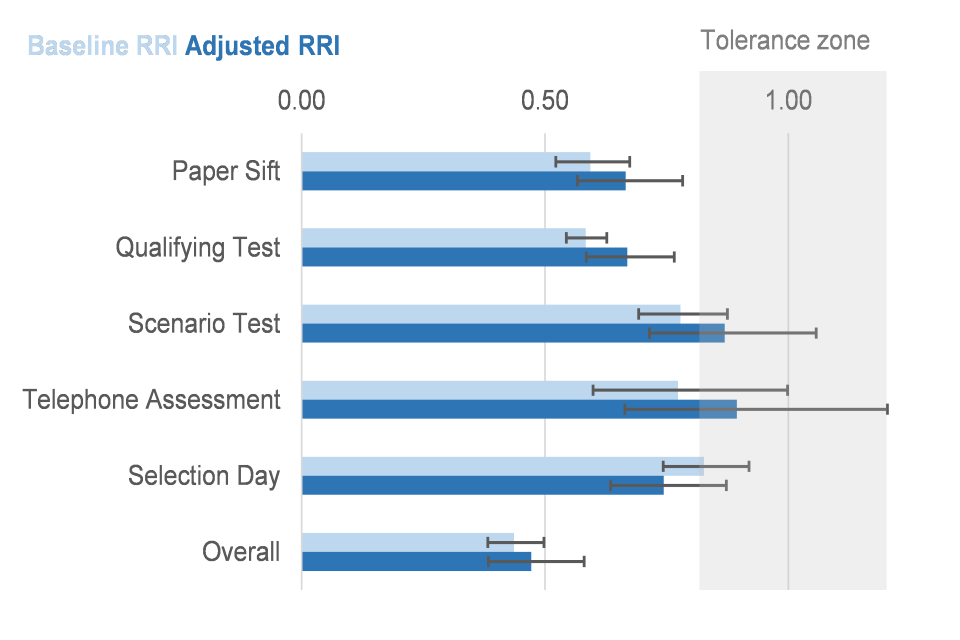
The black error bars indicate the upper and lower range of the 95% confidence interval.
4.3 Legal exercises – Ethnicity after employing controlling factors
After controlling for legal profession and Oxbridge attendance, the overall success rate for Black, Asian and minority ethnic candidates remained lower than for White candidates, both statistically and practically (Adjusted RRI = 0.47). In other words, difference in success rate between Black, Asian and minority ethnic and white candidates cannot be explained by differences in profession or Oxbridge attendance.
The limitations of this analysis should be borne in mind; for legal exercises, although starting with 22,000 applicants, each time the group is split up into the necessary permutations of characteristics, and then further to look at individual selection tools, the groups can quickly become small in number. For example, for the scenario test and telephone assessment where in both cases there is a greater risk of volatility due to small numbers, conclusions should be treated with caution.
Split by stage of application
After controlling for the relevant variables, success rates for Black, Asian and minority ethnic candidates remained lower than for White candidates for most of the selection tools, most notably for the paper sift and qualifying test. No practical difference is seen in the case of scenario test and telephone assessment where for both there is a greater risk of volatility due to small numbers.
4.4 Legal exercises - Legal Profession (Table 2)
Overall, the success rate for solicitors was lower than for barristers (RRI = 0.51), and this difference was both statistically and practically significant.
Split by stage
The success rates for solicitors was also lower than for barristers for all stages of the selection process. The greatest differential between barrister and solicitor candidates was found for the paper sift (RRI = 0.57) and telephone assessment stages (RRI = 0.57), which again were both statistically and practically significant.
Figure 2: RRI for Solicitors compared to Barristers, by selection tool, for all legal exercises 2015/16 to 2020/21
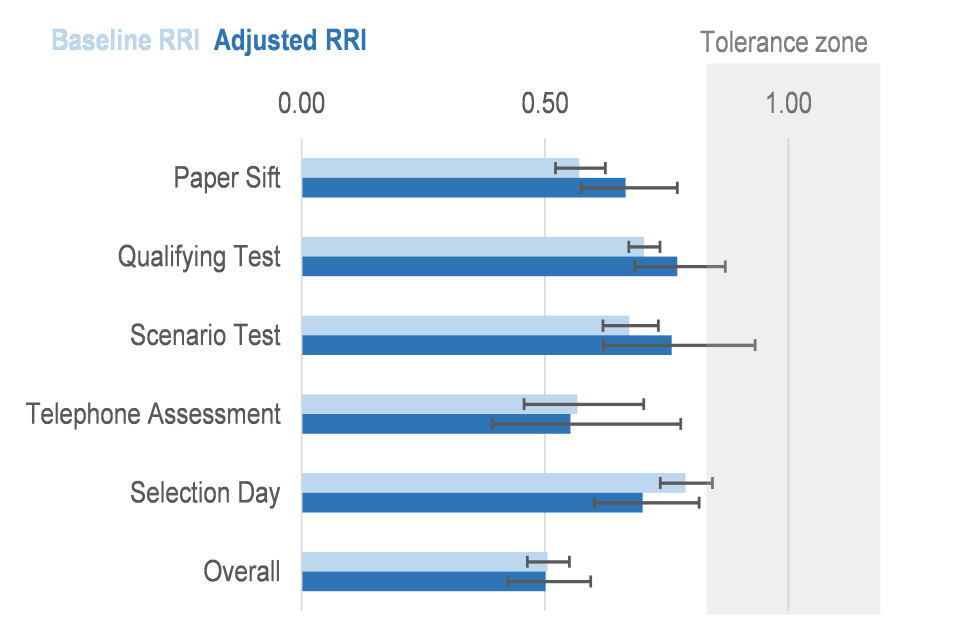
The black error bars indicate the upper and lower range of the 95% confidence interval.
4.5 Legal exercises - Legal Profession after employing controlling factors
After controlling for ethnicity and Oxbridge attendance, the overall success rate for solicitors remained lower than for barristers, both statistically and practically significant (Adjusted RRI = 0.51). In other words, the different success rate between solicitors and barristers cannot be explained by differences in ethnicity or Oxbridge attendance.
Split by stage of application
After controlling for the relevant variables, success rates for solicitors were still lower than for barristers across all the selection tools, and significant both statistically and practically.
4.6 Non-legal exercises (Table 3)
Overall, for the non-legal exercises included in this report, there was no evidence of differences in the outcomes for Black, Asian and minority ethnic candidates compared to White candidates, with an RRI value of 1.11, which is within the range considered to be not practically significant. It was also not statistically significant.
Split by stage of application
For the recruitment stages used (sift, qualifying test and selection day), there was also no evidence of lower success rates for Black, Asian and minority ethnic candidates compared to white candidates.
Controlling for the additional variables of gender and Oxbridge attendance made very little difference to the RRIs.
Figure 3: RRI for Black, Asian and minority ethnic compared to White candidates, by selection tool, for all Non-legal exercises 2015/16 to 2020/21
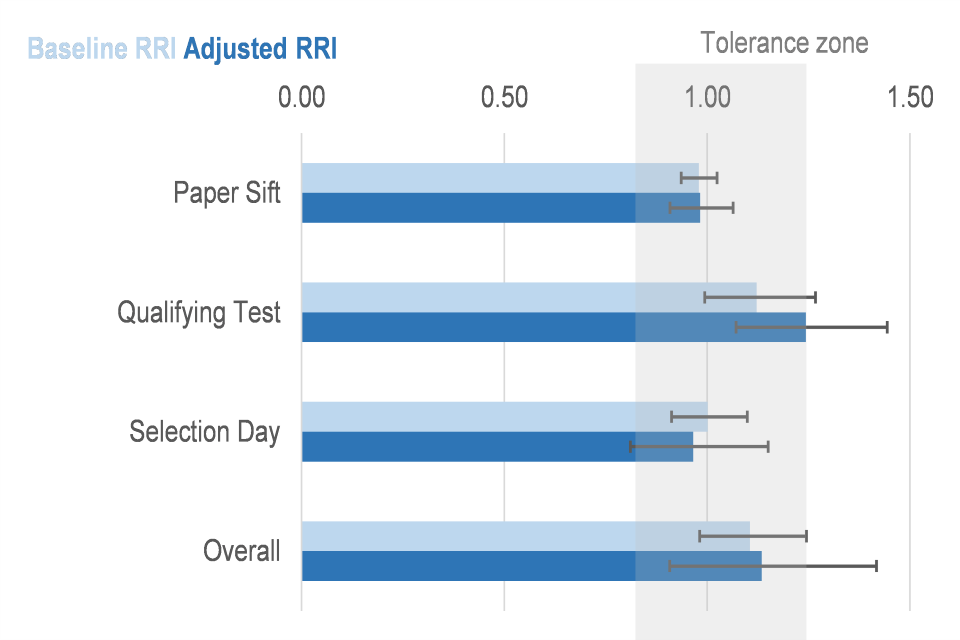
The black error bars indicate the upper and lower range of the 95% confidence interval.
The same selection tools are used for both legal and non-legal exercises. However, some caution is required when making comparisons between legal and non-legal exercises, due to the higher success rates and the relatively small numbers of candidates for non-legal exercises, the latter of which is likely to limit comparability, especially for the sift stage.
5. Further information
5.1 Accompanying Files
As part of this release, as well as this publication, there is a set of data tables which provides more detailed statistics for the above analyses.
5.2 Experimental Statistics status
The statistics in this report are classified as experimental official statistics. Experimental statistics are statistics that are in the testing phase and not yet fully developed. This report has been designated experimental as it is the first time the methodology has been used and the results published. More information about the different types of Official Statistics can be found here:
Types of official statistics – UK Statistics Authority
More information about Experimental Statistics specifically can be found here:
Feedback relating to the content of this release should be sent to:
judicial.statistics@Justice.gov.uk.
In addition, this is an ad hoc release with no further iterations of this report planned.
5.3 Contact
Enquiries and feedback on these statistics should be directed to the Data and Evidence as a Service division of the Ministry of Justice:
Wincen Lowe - email judicial.statistics@justice.gov.uk
Media or other queries on the wider policy implications of these statistics should be directed to the relevant contact:
Judicial appointments: Jessica Prandle - email diversity@judicialappointments.gov.uk