Young people and work: interim report analytical annex
Updated 10 August 2026

© Crown copyright 2026
This publication is licensed under the terms of the Open Government Licence v3.0 except where otherwise stated. To view this licence, visit nationalarchives.gov.uk/doc/open-government-licence/version/3 or write to the Information Policy Team, The National Archives, Kew, London TW9 4DU, or email: psi@nationalarchives.gov.uk.
Where we have identified any third party copyright information you will need to obtain permission from the copyright holders concerned.
This publication is available at https://www.gov.uk/government/publications/young-people-and-work-interim-report/young-people-and-work-interim-report-analytical-annex
Correction to Table 23 in the ‘Young People and Work: Interim Report Analytical Annex’ Accompanying Data Tables
During further work with the data in table 23 of the ‘Young people and work: interim report analytical annex’ accompanying data tables, DWP analysts identified an error with the Excel formula used to calculate the figures. This has been corrected and there has been an update to the data table 23, made on 10 August 2026, to reflect this. There have been no changes made to the main report or analytical annex.
Purpose of the statistics
This annex accompanies the Young People and Work Interim Report. It provides details of unpublished analysis referenced in the report and additional analysis that contextualises the themes of the report.
Section 1 provides information and methodology for the Survey with Education Professionals.
Section 2 provides information and methodology for the Employer Survey.
Section 3 provides information methodology for the Survey of young people not in employment, education or training (NEET).
Section 4 provides information and methodology for the qualitative research with NEET 16 to 24 year olds not currently claiming health or disability benefits.
Section 5 provides information on young people not in employment, education or training who have never worked.
Section 6 provides information and methodology on young people not in employment, education or training by highest qualification obtained.
Section 7 provides information and methodology on the participation of young people by ethnicity.
Section 8 provides information and methodology on NEETs by duration out of full-time education and employment.
Section 9 provides information and methodology on the flows of NEETs by duration of time out of full-time education and employment.
Section 10 provides information and methodology on the analysis of mental health workforce supporting children and young people.
Section 11 provides information and methodology on the share of all NHS spending on mental health services for children and young people, compared with the share of people in contact with mental health services who are aged 0 to 18.
Section 12 provides information and methodology on UK Shared Prosperity Fund (UKSPF) monitoring returns.
Section 13 provides information and methodology on the Department for Work and Pensions (DWP) spend on employment support compared to welfare spend.
Section 14 provides information and methodology on the main wage earner in household at age 14 by NEET status.
Section 15 provides information and methodology on the economic, fiscal and social costs of NEET young people.
Section 16 provides information and methodology on the regional deep dives study conducted for the Young People and Work Interim Report.
Section 17 provides information and methodology on the hidden NEETs in England analysis.
Section 18 provides information and methodology on the analysis of overall outcomes for young people claiming health and disability benefits.
Section 19 provides information and methodology for the Work Aspirations and Support Needs of Health and Disability Customers survey - a focus on young people.
Section 20 provides information and methodology on the number of young people claiming health related benefits citing mental health reasons or a neurodevelopmental condition.
Section 21 provides information and methodology on the analysis of participation outcomes for young people claiming health and disability benefits.
Section 22 provides information and methodology on the analysis of benefits outcomes for young people claiming health and disability benefits.
Section 23 provides information and methodology on the analysis of wellbeing for young people claiming health and disability benefits.
Section 24 provides information and methodology on the analysis of child claims to Disability Living Allowance.
Section 25 provides information and methodology on the analysis of disability benefit receipt by age and main condition.
Section 26 provides information and methodology on the analysis for the Universal Credit Survey
Section 27 provides information and methodology on the outstanding Universal Credit Work Capability Assessment reassessments
Section 28 provides more information on data sources used frequently throughout the Young People and Work Interim Report.
Section 29 provides the frequently used definition of those not in education, employment or training.
1. Survey with education professionals
1.1 Methodology
This analysis uses findings from the YouGov survey with educational professionals.
Findings are from an online survey of 1,004 primary and secondary school teachers who are YouGov Plc UK panel members. Fieldwork was carried out between 10 March and 23 March 2026. Figures have been weighted and are representative of UK teachers.
1.2 Findings
Findings from the Survey with Education Professionals can be found in Chapter 4 of the Young People and Work Interim Report.
Our survey of teachers found that three-quarters (74%) agreed that the curriculum put too much emphasis on passing exams and not enough focus on preparing young people for employment (73% in agreement) or teaching soft skills for employment (73% in agreement).
Nearly three-quarters (73%) of teachers also believed it possible for the curriculum to be adapted to provide a broader set of skills for work and employment while still maintaining high academic standards.
This research was completed using an existing panel of education professionals. Panel members therefore were not picked at random and may not be representative of the population.
2. Employer survey
2.1 Definitions
SME – small and medium sized enterprise
2.2 Methodology
This analysis uses findings from the Survey with Employers carried out by IFF Research.
Fieldwork was carried out between 4 March and 18 March 2026, resulting in 500 completed telephone interviews.
The sample was sourced from Market Research Location, which provided contact details for employers across a range of sectors and organisation sizes throughout the United Kingdom. The sample comprised employers from a broad range of organisation sizes, sectors and regions, with sole traders excluded to ensure insights were drawn from businesses with experience of recruiting young people.
Quotas were put in place for size and sector of employers to ensure the research achieved a range of employers. Weighting was also applied once fieldwork was complete to ensure the sample was representative of the wider population of employers.
2.3 Findings
Findings from the Employer Survey can be found in Chapter 3 of the Young People and Work Interim Report. The findings here refer to Figures 17 and 18 in the Young People and Work Report. Underlying data can be found in Tables 4 and 5 in the accompanying data tables.
Employers’ perceived main barriers to young people’s employment opportunities were their level of motivation (27%) and their previous work experience (27%).
The main challenge employers experience when hiring young people is their lack of soft skills or work readiness (42%).
3. Survey of young people NEET
3.1 Definitions
NEET – not in employment, education or training
Base sample – the base sample is the total sample from which the survey population is drawn. In the case of the survey of NEET young people, the Base sample refers to all individuals from the YouGov Plc panel.
3.2 Methodology
This analysis uses findings from the survey of young people NEET conducted by YouGov.
This survey was conducted using an online interview administered to members of the YouGov Plc UK panel of over 2.5 million individuals who have agreed to take part in surveys. Emails are sent to panellists selected at random from the base sample (due to the sampling system, we cannot determine how many people were invited to take part in the survey, however the total sample size was 417 individuals). The email invites them to take part in a survey and provides a generic survey link. Once a panel member clicks on the link they are sent to the survey that they are most required for, according to the sample definition and quotas. (The sample definition could be “GB adult population” or a subset such as “GB adult females”). Invitations to surveys don’t expire and respondents can be sent to any available survey. The responding sample is weighted to the profile of the sample definition to provide a representative reporting sample. The profile is normally derived from census data or, if not available from the census, from industry accepted data.
To analyse the findings, YouGov’s data processing team weighted all relevant completes by age and gender to ensure representative of the wider population.
They then calculated the weighted percentages for the quantitative data. In some cases, nets were generated to group similar responses (for example, strong/slightly agree) where relevant.
3.3 Findings
Findings from the Survey of NEET young people can be found in various chapters of the Young People and Work Interim Report.
Chapter 2:
- shows that most young people want to participate: 84% of NEET young people in our survey said they want to find a job, education or training
- 41% in our survey with NEET young people put interesting or fulfilling work as their main priority – the top choice
- despite all these challenges, the vast majority of NEETs think they will move into work, but a small proportion (11% from our survey of young people who are NEET) fear they won’t
- from our survey with young people who are NEET, 81% thought that the current curriculum is too focused on children and young people passing exams
- in addition, more than half of the young people (55%) felt that the current education system did not suit people like them
- our survey of young people who are NEET showed that the majority (67%) believed the current curriculum failed to prepare young people for work
- more than that, they were clear that the so-called ‘soft skills’ - like speaking skills - would have a very positive effect when applying for jobs (64% agreed), closely followed by technical skills or qualifications (60% agreed)
- one in ten respondents from our survey with young NEETs said they thought they would never move into work, education or training
- in addition to the 30% who wanted to move into education or training, our survey showed that 54% of young people wanted to work (both part-time and full-time) - only 11% said they don’t think they will ever move into work, education or training
- 69% of NEETs in our NEET survey agree that it is worth getting a job
Chapter 4:
- most respondents to our NEET survey believe the current curriculum does not prepare people for work (67%), in addition to over half feeling that the current education system does not suit people like them (55%)
Chapter 6:
- evidence from our surveys of young people who are NEET found that 64% of those surveyed wanted to work or do an apprenticeship and a further 19% wanted to enter education or training.
4. Qualitative research with 16 to 24 year old NEETs not currently claiming health or disability benefits
4.1 Definitions
NEET – not in education, employment or training
4.2 Methodology
Verian conducted 30 in-depth, semi-structured interviews with young people who were not in work, training or education and were not claiming health or disability benefits at the point of interview. Fieldwork took place between 16 March 2026 and 27 March 2026. Interviews lasted up to an hour and took place either online or by telephone. Verian used an independent recruitment company to free-find the participants for the sample. Participants were offered a £60 shopping voucher to thank them for their time.
Young people were purposively sampled to achieve a mix of ages, gender, benefits status, length of time NEET, qualification level, caring responsibilities, health conditions, region, and additional characteristics (including identified special educational needs (SEN) at school, experience of care, young carers, and experience of the criminal justice system).
The topic guide was adapted from materials used in the ‘Work Aspirations’ qualitative research with NEETs claiming a health or disability benefit, conducted by NatCen for DWP, to ensure consistency and enable rapid set up.
Since some of the interview topics could lead to sensitive conversations, Verian provided all young people with information about support services that they might find useful (such as mental health support or debt advice) and encouraged participants to pause or take the interview at their own pace.
Findings in the report reflect the range of experiences of those who participated in the research. It is important to note that the findings cannot be generalised to all young people in the UK, due to the small sample size and the qualitative nature of the research.
4.3 Findings
To note: all participant names were changed to protect their anonymity.
Findings from the qualitative research with 16 to 24 year olds NEETs not currently claiming health or disability benefits can be found in Chapter 2 of the Young People and Work Interim Report.
I thought that the education system would have held my hand a bit more and guided me to where I wanted to be. They would just be like, make sure you go to university. Apprenticeships are an option, but they wouldn’t tell you how to look for apprenticeships or anything like that.
(Woman, age 20)
I think they should explore a lot more opportunities and make students aware that it’s not always this linear path of you have to do school and then college and university and then you get to a dream career.
(Woman, age 24)
One of the young people in our qualitative research, described past experiences of racism in his area that made him reluctant to take on early or late shifts: “I wouldn’t take a job where I have to walk in the dark.”
In our qualitative research, mental health conditions, including anxiety, depression, neurodevelopmental conditions and PTSD, were widely reported and affected motivation, confidence and capacity to engage in training or job searching.
With my mental health right now that I just got put on medication, because my mind’s not situated, I can’t focus on other things, if that makes sense. I physically can’t.
I got an internship and that was fine. But I really, really struggled with my neurodivergence there because it was not an environment that was made for people who are neurodivergent. It wasn’t a diverse company.
It’s like, how do you want me to have experience if I’m only 18 and you’re not even letting me have the chance to get the experience?
(Woman, age 18)
I just remember thinking, how can I not get that job? That is a very entry level role. Do you really need experience in that job? It’s not really difficult, is it?
(Man, age 20)
For grad roles, a lot of them, even though they’re meant to be graduate roles, some of them ask for experience. But how am I meant to obtain it? Unless I choose to do a year in industry, I feel like it’s very unfair.
(Woman, age 21)
Like a lot of these places don’t even give you a reply and it’s really disheartening. And then you would get a reply, an automated reply, five months down the line for a role that you’ve forgotten you applied for to say that you’ve been rejected. Or you just don’t hear at all.
(Woman, age 21)
They send you everything that you told them not to send.
(Woman, age 22)
I didn’t really find them much help. They were showing me how to do a CV and all this stuff, but I already had my CV and everything. And I told them my interests and everything they were doing was the same that I could do, just Google it.
(Woman, age 23)
I feel they’re not as supportive. They do have jobs, like if you want to be a security guard, that was the kind of stuff put towards me. But anything related to my career field? They never really had anything like that.
(Woman, age 24)
Even just going there for one appointment, I felt, I don’t want to say embarrassing, but it feels like you know what the stigma is if you’re getting benefits, you’re just lazy and you don’t want to work or something like this.
(Woman, age 23)
I had never thought about going to a Jobcentre because I didn’t think they’d be able to help me out in my situation. As in like, I’ve already gotten a degree and stuff. I thought it was more for like hospitality and stuff, maybe working in shops.
(Woman, age 21)
Some young people had been promised opportunities that did not materialise:
I actually only did that course because they said I would get a guaranteed interview for a job at the end, which didn’t happen.
(Female, age 20)
There’s a lot of things that they don’t tell you within Universal Credit that you could be getting.
(Female, age 22)
Transport emerged as a significant practical barrier across our research, particularly for those without a driving licence or access to a car.
I’d say the fact I can’t drive probably doesn’t help me with searching for jobs because I’ve found a lot of jobs even then that you don’t really need to be able to drive for, require you to have a driving licence. I can’t afford the driving lessons because I’m not in work.
(Female, age 22)
Once I get a car, it’ll open up a lot more opportunities.
(Man, age 18)
They did have opportunities and work experience at uni, but they were all unpaid and because I was working while at university, I felt it wasn’t really something I could do. There’s a lot of barriers for people who are from lower socio-economic backgrounds.
(Woman, age 22)
If I had a bit more money, then I could have gone to a volunteer programme already and been able to sustain that.
(Woman, age 23)
Fear of losing support, even where that fear is based on misunderstanding, can stop young people taking up valuable opportunities. A smaller group in our qualitative research, with strong family financial support, appeared to feel less urgency to enter work.
Our qualitative research confirms this. Young people keep spreadsheets of applications. They spend hours each day on job sites. They lower their expectations, broaden their search, remove degrees from CVs. Even those furthest from the labour market, those with severe mental health conditions, care experience and repeated rejection, described wanting a career, not just a job.
The qualitative research reveals young people who are trying, persistently and creatively, in the face of repeated failure. They submit hundreds of applications. They lower their expectations. They take unpaid work. They travel hours for short Jobcentre appointments that “don’t really help you as an individual.”
One young graduate was rejected from Costa, Mountain Warehouse and Sainsbury’s despite having a degree and university work experience: “You’re telling me I’m not skilled enough?”. Another described the desperation: “Now things have become so desperate for me that I’m applying to anything and everything”. A third reflected: “I feel like that’s what rich people want us to do. They want us to just settle for anything you can get”.
I want to end this chapter where it began: with the voices of the young people who gave their time to this review. ‘Katie’, who has a degree and a clear career goal, spends her days in rural Scotland applying for jobs she cannot get without experience she cannot afford to gain: “You need two years of experience to get an entry level job, but you have to be able to fund yourself to do that”. ‘Anna’, who completed a BTEC, volunteered and gained a vocational qualification, still cannot get hired: “If you don’t have any experience, qualifications aren’t very helpful. It’s like a roadblock”. ‘Rebecca’, who attended 8 secondary schools and is adjusting to new medication, wants a career, not just a job: “If my mind’s not situated, I can’t focus on other things”.
5. Young people not in employment, education or training who have never worked
5.1 Data source
This analysis uses the Labour Force Survey (LFS). See ‘Data Sources’ for more detail.
5.2 Definitions
This analysis follows the ONS definition of young people (aged 16 to 24) who are NEET. See ‘Defining those not in employment, education or training’ for more detail.
Someone is classified as having never worked if they report that they have never had a paid job.
5.3 Methodology
In this analysis, NEET estimates are derived in the same manner as ONS published statistics. For those identified as NEET, the information on previous employment history is used to estimate the proportion of young people who have never worked. This is averaged over 4 quarters to remove seasonality effects.
The percentage of NEET young people who have never worked statistic is the proportion of NEETs aged 16 to 24 who report they have never had a paid job.
This is calculated over time, again using 4 quarter averages to remove seasonality effects.
5.4 Key assumptions and caveats
The LFS has a discontinuity in population weights before and after January to March 2019. Comparisons before and after this date should be made with caution.
The analysis focuses on whether an individual has ever had paid employment and does not capture unpaid work, informal work or volunteering activity.
5.5 Findings
5.5.1 Increasing share of NEET young people have never worked
On average across 4 calendar quarters in 2025, 62% of young people aged 16 to 24 who were NEET reported that they had never worked. This represents an increase compared with earlier years in the series. For example, in 2019 around 56% of young people who are NEET reported never having had a paid job.
The proportion has generally increased gradually over time, with some year-to-year fluctuations. A sharper increase was observed from around 2021 onwards, with the proportion reaching around 60% in recent years. The data for all years can be found in supplementary data Table 3.
6. Young people not in employment, education or training by highest qualification obtained
6.1 Data source
This analysis uses the LFS. See ‘Data Sources’ for more detail.
6.2 Definitions
This analysis follows the ONS definition of young people (aged 16 to 24) who are NEET. See ‘Defining those not in employment, education or training’ for more detail.
A graduate in this analysis is someone with at least an undergraduate degree as their highest educational qualification.
6.3 Methodology
In this analysis, NEET estimates are derived in the same manner as ONS published statistics. For those who are NEET, the highest obtained educational qualification is then tabulated to produce estimates of the composition of the NEET young person population by highest qualification. This is averaged over 4 quarters to remove seasonal effects.
The percentage of graduates who are NEET calculates the proportion of all graduates aged 21 to 24 who are not in employment, education or training. This is calculated over time, again using 4 quarter averages to remove seasonality effects.
6.4 Key assumptions and caveats
The LFS has a discontinuity in population weights before and after January to March 2019. Comparisons before and after this date should be made with caution.
6.5 Findings
6.5.1 Highest qualifications among young people who are NEET
The most common educational qualification for the overall NEET group aged 16 to 24 to hold are GCSEs (29% of the NEET group). Around 15% reported a degree as their highest qualification while 18% reported they had no qualifications. As this analysis covers the whole 16 to 24 age group, individual members of the group will not have had the same opportunities to obtain qualifications. For example, 16 year olds are not likely to have obtained a degree. As a result, this analysis is best interpreted as understanding the qualifications held by the current cohort of NEET young people as a whole, rather than judging their accumulation of qualifications against age-specific benchmarks. The related data can be found in supplementary data Table 24.
6.5.2 Percentage of graduates aged 21 to 24 who are NEET
On average across 4 calendar quarters in 2025, 12.8% of 21 to 24 year olds who had a degree or higher as their highest qualification were not in employment, education or training. This has increased from the recent low point in 2022, when 10.1% of graduates in this age group were NEET. The related data table can be found in supplementary data Table 23.
7. Participation of young people by ethnicity
7.1 Data source
This analysis uses the Annual Population Survey (APS). See ‘Data Sources’ for more detail.
7.2 Definitions
This analysis follows the ONS definition of young people (aged 16 to 24) who are NEET. See the ‘Defining those not in employment, education or training’ section for more detail.
7.3 Methodology
Estimates of young people who are in education or training is derived from the APS data for those who are enrolled on a course and still attending, in a government training work scheme or completing an apprenticeship. It also includes those who have been in job related training or education in the past 4 weeks. In this method, those ‘in education or training’ may also be in employment. Those in the ‘in employment’ category are in employment (as defined by the ILO framework) and are not already identified as being in education or training.
Those unemployed or inactive are NEET according to the ONS definition and are derived by cross tabulating by labour market status defined by the ILO framework.
Data coverage is for people aged 16 to 24 in the UK.
7.4 Key assumptions and caveats
Due to small sample sizes for some categories, the data has been pooled from 2018 to 2025 using January to December annual data.
Pooled data provides an average from 2018 to 2025. Proportions may differ across years, including during the covid-19 pandemic. Therefore, these estimates must be used with caution and it is not possible to show trends over time.
Ethnic group is defined using the UK level ethnicity variable from the APS.
- White includes respondents in England, Wales and Scotland identifying themselves as ‘White - Gypsy or Irish Traveller’ and respondents in Scotland identifying themselves as ‘White - Polish’
- Other includes respondents in Northern Ireland identifying themselves as ‘Irish Traveller’ and respondents in all UK countries identifying themselves as ‘Arab’.
Proportions do not total 100% to account for missing values.
7.5 Findings
This analysis shows that 16 to 24 year olds who are in the Chinese ethnic group are most likely to be in education or training (77.9%) compared with other ethnic groups. Generally, around 70% of most ethnic groups are in education or training. Young people who are in the White ethnic group are least likely to be in education or training (56.3%).
Overall, those who are not in education or training, but are in employment, make up nearly a third (31.5%) of the White ethnic group. This is substantially higher with the next largest proportion for those in the Mixed/Multiple ethnic groups category (22.3%). This analysis refers to Figure 5 in the Young People and Work Report. Related data can be found in Table 1 in the accompanying data tables.
8. Duration since last job or full-time education for those not in education, employment or training
8.1 Data source
This analysis uses the APS. See ‘Data Sources’ for more detail.
8.2 Definitions
This analysis follows the ONS definition of young people (aged 16 to 24) who are NEET. See the ‘Defining those not in employment, education or training’ section for more detail.
8.3 Methodology
Duration has been calculated based on when someone left full-time education and when they left their last job. It also considers if someone has been in job-related training or education in the last 3 months.
The time since leaving full-time education is calculated by subtracting the age someone left education from their current age. Both variables are only available as a whole number and recorded as age at last birthday.
8.4 Key assumptions and caveats
This measure gives an approximation of the time someone has been out of full-time education or full-time or part-time employment. It does not measure the time someone has been NEET, as it does not fully consider the length of time since someone was in training unless they were in recent training in the past 3 months. It also does not consider part-time education.
For findings in section 8.5.1, due to the available data, someone who left education aged 18 and is now 19, would appear to have left full-time education one year ago. However, this could be any time between 0 and 2 years. These are defined in the data as being unknown. Therefore, proportions presented in chapter 1 should be treated as a lower bound.
Table 1: definition category by calculated time since leaving full-time education
| Age someone left full-time education subtracted from current age | Allocated category |
|---|---|
| 0 | Less than 1 year |
| 1 | Unknown, between 0 and 2 years |
| 2 plus | 1 year or more |
Note: a more recent instance of employment would supersede time since leaving full-time education. For example, if an individual left full-time education 3 years ago, based on the above calculations, and had left their last job 6 months ago then they would be included in the ‘Less than 1 year’ category.
8.5 Findings
8.5.1 Length of time out of full-time education or employment by highest qualification
NEETs with a degree or higher education qualifications are more likely to have been out of full-time work or employment for less than one year (57%) compared to those NEET with no qualifications (16%). There are high proportions of people who can’t be defined as being in either group, due to the nature of calculating when someone left full-time education. Due to this, the figure is the lower bound of people who have been out of education or employment for less than a year. Despite this, even if all unknowns were assigned to the ‘less than 1 year’ group for those with no qualifications, this proportion would still be lower compared to those with a degree or higher education qualifications. See supplementary Table 21.
8.5.2 Long-term out of full-time education or employment for 24 year olds
Around 28% of 24 year old NEETs have been out of full-time education since the age of 18, and either left a job over 5 years ago or never had a paid job. Related data can be found in supplementary Table 22.
9. Flows from one year to the next for NEETs by duration
9.1 Data source
This analysis uses the 2 year longitudinal APS. See ‘Data Sources’ for more detail.
9.2 Definitions
This analysis follows the ONS definition of young people (aged 16 to 24) who are NEET. See the ‘Defining those not in employment, education or training’ section for more detail.
9.3 Methodology
Duration has been calculated based on the age someone left full-time education and when someone last left their job. The time since leaving full-time education is calculated by subtracting the age someone left education from their current age. Both variables are only available as a whole number.
The length of time that someone has been out of employment or full-time education only applies to the first interview in the APS. If the respondent is recorded as being NEET in their second interview, one year later, then they will likely have been NEET for longer than the category they were assigned in their first interview. For those who have moved into employment, education or training, based on this analysis, we are unable to estimate whether they were still in the same category that they were recorded as in their first interview at the point they moved into employment, education or training. For example, someone who was out of employment or full-time education for less than a year at their interview may then have been out of employment or full-time education for more than a year when they moved into education, employment or training.
9.4 Key assumptions and caveats
This measure gives an approximation of the time someone has been out of full-time education or employment. It does not measure the time someone has been NEET as it does not fully consider the length of time since someone was in training unless they were in recent training in the past 3 months. It also does not consider part-time education. See Table 1 in Section 8 for more details.
Due to the available data, someone who left education age 18 and is age 19 would appear to have left full-time education 1 year ago. However, this could be any time between 0 and 2 years. These are defined in the data as being unknown. Around 12% of people have a status that is unknown. However, if this group was assigned to either category, those who have been out of education or employment for less than a year are more likely to move into employment, education or training compared with those who had been out of full-time education or employment for more than a year.
Due to small sample sizes, proportions have been calculated over a 10 year period (2014 to 2024). The longitudinal data only record 2 points in time, one year apart. Any movement into or out of the labour market or education is not recorded between interviews.
9.5 Findings
On average in the past decade, around 65% of those NEET who had been out of full-time education and employment for less than a year in Year 1, move back into participation the following year. Only 25% of those NEET who had been out of full-time education or employment for more than a year manage to do the same.
10. Analysis of mental health workforce supporting children and young people
10.1 Data source
This analysis is based on extracts from the NHS Electronic Staff Record system and the NHS-wide HR and payroll database.
10.2 Definitions
FTE – full-time equivalent.
10.3 Methodology
The workforce providing services to children and young people (CYP) was identified using a combination of occupation code, area of work (the functional area or specialty where the work takes place), and job role (a generic description of role). Used together, these fields enable more granular and accurate identification of specific workforce subgroups. For more information, see guide to classifications used.
Trend data were produced for each month from March 2016 to September 2025. Data are presented as full-time equivalents (FTE), meaning the figures are adjusted to account for part-time working.
10.4 Key assumptions and caveats
The figures presented here differ from other published sources on the mental health workforce and are not directly comparable.
The Children and Young People’s National Mental Health Workforce Census reports data submitted by NHS trusts and other non-NHS organisations, including local authorities and youth offending teams. These data are only available for selected years since 2016; at the time of writing, the most recent figures relate to March 2024. For more information, see the mental health national workforce census.
Official statistics on the NHS workforce are based on a different definition of the mental health workforce. The definition of the mental health workforce uses occupation code and area of work but does not include job role. Although some information is available on whether staff are involved in caring for CYP, the published figures relate to the mental health workforce as a whole.
10.5 Findings
The number of NHS staff involved in providing mental health services to children and young people more than doubled between 2016 and 2025, growing from 7,965 FTE to 18,156 FTE.
The percentage of the workforce in mental health nursing roles fell 8 percentage points over the period; the percentage in child and adolescent psychiatry roles declined by 5 percentage points.
The share of roles supporting Mental Health Support Teams has increased, from 4% in 2016 to almost 18% in 2025.
11. Share of all NHS spending on mental health services for children and young people, compared with the share of people in contact with mental health services who are aged 0 to 18
11.1 Data source
This analysis uses 2 data sources, one to quantify the share of all mental health spending that CYP mental health services receive and the other to quantify the share of people in contact with mental health services who are 0 to 18.
The share of contacts to mental health services made by under-18s, is based on NHS England’s publicly available Mental Health Services Monthly Statistics.
This data series provides the most up to date information on people using NHS-funded mental health, learning disabilities and autism services in England.
The share of all mental health spending on CYP mental health services is based on internal finance data from NHS England. This data covers spending categorised in 3 areas of spending: Mental Health Investment Standard (MHIS), Service Development Funding (SDF), and Specialised Commissioning.
11.2 Definitions
Mental Health Investment Standard (MHIS) – each integrated care board (ICB) is required by NHS England to spend a proportion of its overall allocation on mental health services to meet the Mental Health Investment Standard (MHIS). The required level of spend to meet the MHIS is set by NHS England for each ICB.
MH01a – people in contact with mental health services aged 0 to 18 at the end of the reporting period.
MH01b – people in contact with mental health services aged 19 to 64 at the end of the reporting period.
MH01c – people in contact with mental health services aged 65 and over at the end of the reporting period.
Service Development Funding – SDF is additional programme funding provided to ICBs to support specific initiatives and programmes. For mental health, this includes programmes such as mental health support teams (MHST) in schools.
CYP – children and young people
Specialised Commissioning – specialised services support people with a range of rare and complex conditions. They often involve treatments provided to patients with rare cancers, genetic disorders or complex medical or surgical conditions. They deliver cutting-edge care and are a catalyst for innovation, supporting pioneering clinical practice in the NHS.
11.3 Methodology
For 0 to 18 years’ share of contact, the 3 measures MH01a, MH01b, and MH01c were extracted from the Mental Health Services Monthly Statistics and aggregated at national level for financial year ending 2019 and financial year ending 2025.
To calculate the under-18 share of contacts, the monthly total for MH01a was summed across each financial year to give the total number of people in contact with mental health services aged 0 to 18 years. The monthly totals for MH01a, MH01b, and MH01c were summed across each financial year to give the total number of people in contact with mental health services across all age groups. The sum of MH01a divided by the sum of MH01a, MH01b, MH01c gives the share.
For share of all mental health spending on CYP services, specific CYP lines of spending were summed and taken as a proportion of all spending. For MHIS, this was ‘Children and Young People’s Mental Health (excluding LD)’, ‘Children and Young People’s Eating Disorders, and Mental Health Support Teams in Schools’. For SDF, this was ‘CYP’ and ‘MHSTs’. For Specialised Commissioning, the data was provided split by CYP and adult, so the CYP totals were used.
11.4 Key assumptions and caveats
It is important to note that the number of people in contact with services has been used as a proxy for some measure of true caseload or demand. Number of contacts does not account for important dimensions you would consider when assessing caseload or demand, such as acuity and complexity.
11.5 Findings
In the financial year ending 2025, CYP mental health services received 11.3% of all mental health spending. In that same financial year, 0 to 18 year olds accounted for 33.3% of all contacts with mental health services.
From financial year ending 2019 to financial year ending 2025, CYP mental health services increased from receiving 9.7% of overall mental health spending to 11.3%. In that same period, 0 to 18 year olds share of all contacts with mental health services increased from 24.8% to 33.3%. Find underlying data table in supplementary Table 26.
12. UK Shared Prosperity Fund monitoring returns
12.1 Data source
UKSPF monitoring returns – data collected from lead local authorities delivering the UKSPF across 2022 to 2025.
12.2 Definitions
The UKSPF was the domestic successor to the European Regional Development Fund and European Social Fund. The Fund was designed to empower local leaders and communities to deliver locally identified priorities, allowing decisions to be made by those who know their areas best. Delivery of the UKSPF was delegated to lead local authorities who are responsible for managing the funding allocation for their area, including assessing and approving project applications, processing payments and day-to-day monitoring. UKSPF funding was delivered through 3 investment priorities: Communities and Place, Supporting Local Business and People and Skill. Further information can be found in the shared prosperity fund technical note.
People and skills refers to the UKSPF investment priority as described in the UKSPF prospectus that can be found in the shared prosperity fund prospectus. Through the people and skills investment priority, places used their UKSPF funding to help reduce the barriers some people face to employment and support them to move towards employment and education. Places could also target funding into skills for local areas to support employment and local growth.
Multiply refers to the £559 million adult numeracy programme delivered between 2022 and 2025 as part of the UKSPF, which offered local support for people to gain or improve their numeracy skills - equipping adults across the UK with the skills they need to progress in life. It was led by the Department for Education (DfE) in England and local partners in Scotland, Wales and Northern Ireland.
12.3 Methodology
Total UKSPF spend through the people and skills investment priority across the UK across all ages (including Multiply):
- financial year ending 2023 = £10,201,733
- financial year ending 2024 = £139,034,765
- financial year ending 2025 = £453,121,396
- Total for 2022 to 2025 = £602,357,894
The yearly average (mean) would be £200,785,965.
12.4 Key assumptions and caveats
Please note that Multiply figures which are included in the above figures only account for Scotland, Wales and Northern Ireland. Multiply for England is managed by DfE and Ministry of Housing Communities and Local Government do not have access to England Multiply figures.
12.5 Findings
Yearly average spend of UKSPF so far (excludes 2025 to 2026 year of spend) is around £200 million. Total spend for 2022 to 2025 was £602 million.
13. Employment support and welfare spend
13.1 Data source
This analysis draws on:
- internal DWP estimates of the spend on Jobcentre Plus in financial year ending 2025 (excluding estates, digital and other corporate costs)
- internal estimates of DWP employment programme spend in financial year ending 2025 and financial year ending 2029
- benefit caseload figures by age
- benefit expenditure forecasts
- population estimates for mid-2024
- forecasts of young people NEET (calculated for the Young People and Work Review)
- forecasts of PIP and DLA for 16 to 24 year olds for financial year ending 2031 (calculated for the Young People and Work Review)
13.2 Methodology
For financial year ending 2025 estimates
The spend on DWP employment support adds together:
-
Spend on the core programmes funded by DWP in financial year ending 2025. Where programmes covered all age groups, the spend on 16 to 24 year olds was based on the proportion of all participants in that age group. For some programmes age of participant was recorded, for others it was approximated based on the age distribution of benefit claimants in the eligible cohort.
-
Jobcentre Plus spend on young people, calculated by taking 10% of the nominal £1.4 billion spend on Jobcentre Plus in financial year ending 2025 (excluding estates, digital and other corporate costs).
-
The welfare spend covers out-turn expenditure for 16 to 24 year olds in financial year ending 2025 on all elements of Universal Credit (UC), plus Employment Support Allowance (ESA), Jobseeker’s Allowance, Personal Independence Payments (PIP) and Disability Living Allowance (DLA).
For financial year ending 2031 estimates
The spend on DWP employment support adds together:
-
Estimated spend on the core programmes funded by DWP in financial year ending 2029, to cover all the programmes captured as DWP-funded for the 2024 to 2025 figure, plus new programmes introduced since, such as the Youth Guarantee. Where programmes covered all age groups, the spend on 16 to 24 year olds was based on the estimated proportion of all participants in that age group. The spend in financial year ending 2029 is assumed to remain constant in nominal terms to financial year ending 2031.
-
Jobcentre Plus spend on young people, calculated by taking the financial year ending 2025 figure and increasing in line with population growth to financial year ending 2031
The welfare spend for 16 to 24 year olds adds together:
-
Forecasts of Personal Independence Payments and Disability Living Allowance produced for the Young People and Work Review.
-
The 2024 to 2025 expenditure on young people for UC, ESA and Jobseeker’s Allowance, increased at the same rate as combined expenditure on UC and ESA to financial year ending 2031.
For both financial year ending 2025 and financial year ending 2031, the spend on employment support was divided by the spend on welfare to provide a percentage, which was then converted into a ratio.
13.3 Key assumptions and caveats
These calculations assume that the share of spend on young people reflects the share of the caseload who are young people. This may not reflect the reality of how spend is allocated for both Jobcentre Plus and wider employment programmes, as take-up and intensity of support may not be proportionate to caseload size.
Funding allocations are unknown for financial year ending 2031 as this will be part of future Spending Review allocations. Actual spend on employment support could be higher or lower than the levels assumed here.
Employment programme spend in the financial year ending 2031 excludes spending on the Adult Skills Fund or apprenticeship levy, which are not treated as DWP spend for these purposes, to ensure consistency in comparing the financial years ending 2025 and 2031 expenditure. The overall government spend on employment-related support for young people, including that funding to employers, is therefore higher than presented in these figures for DWP alone.
13.4 Findings
This analysis is represented in the Young People and Work interim report as an estimate that:
- in financial year ending 2025, for every £1 that DWP spent on employment support for young people, around £25 was spent on benefits for young people
- if spend on DWP employment support remains at the levels currently being funded through the Youth Guarantee, we estimate that by financial year ending 2031, for every £1 that DWP spend on employment support for young people, around £10 will be spent on welfare support for young people
These broad ratios are drawn from the detailed figures as follows:
- for financial year ending 2025, spend on DWP employment support for young people is 3.7% of the welfare spend on this group, which translates to £1 for every £27. This rounded to £1 for every £25, given the approximations in the calculation
- for financial year ending 2031, spend on DWP employment support for young people is 9.5% of the welfare spend on this group, which translates to £1 for every £11. This is rounded to £1 for every £10, given the approximations in the calculation
14. Main earner in household at age 14 by NEET status
14.1 Data source
This analysis uses the LFS. See ‘Data Sources’ for more detail.
14.2 Definitions
This analysis follows the ONS definition of young people (aged 16 to 24) who are NEET. See the ‘Defining those not in employment, education or training’ section for more detail.
14.3 Methodology
This analysis uses a variable which captures who the main earner was in the young person’s household when they were 14 years old. This only applies to those who were living with their parents or other family members when they were 14. The categories are mother, father, other family member, joint earners and no one was earning.
14.4 Key assumptions and caveats
Data is only available for quarter 3 (June to September). Due to seasonality, this may result in a larger or smaller proportion NEET compared to other quarters.
Due to small sample sizes for some categories, the data has been pooled from 2021 to 2025.
14.5 Findings
Around 28.7% of young people who lived in a household where nobody was earning when they were 14 years old are now NEET.
15. The economic, fiscal and social costs of young people being NEET
The purpose of this analysis is to provide an indicative view of the cost of young people being NEET. The components of the analysis are:
- economic cost (output lost – both direct and scarring)
- fiscal cost (foregone tax revenue and increased benefit spend – both direct and scarring; increased health spending)
- social/individual cost (wellbeing estimates)
The report also presents the working lifetime cost of one spell NEET, either as one year or as a “ceiling estimate” for someone who is continuously NEET age 18 to 24. The lifetime figure includes the direct and scarring impacts for one individual.
15.1 Data sources
LFS - see ‘Data Sources’ for more detail.
ONS Annual Survey of Hours and Earnings (ASHE) 2025 – median earnings by age band.
ONS Unit Labour Cost and Unit Wage Cost Time Series, Q3 2025.
15.2 Definitions
Costs considered include:
- the “direct” costs, which are incurred at the time when someone is NEET and are aggregated across the entire relevant NEET population (for example, all young people NEET, except if the estimates are age- or health-specific)
- the “scarring” costs, which are incurred long-term over a working life and are aggregated across the NEET population most likely to experience these impacts, such as those where time since last employment is 6 months or more, or those who have been out of education for a year or more
- the “direct economic potential lost” estimate reflects the level of output that could have been achieved if all 18 to 24 year old NEETs in the last year had been in full-time employment (this is not a forecast of what would occur if all NEET young people entered the labour market, but a stylised estimate)
15.1.1 Methodology
Median ASHE annual earnings by age are used as a direct proxy for foregone earnings. For individuals 21 and over, an additional allowance of 3% for pension contributions and a further 10% for benefits or overheads as a proxy for total compensation. This does not include additional factors such as recruitment, onboarding or training costs. These are summed across the population of NEET young people. Those aged 16 to 17 are excluded from this estimate, as employment is not an appropriate counterfactual for this group.
Different data sources and methods are used to check for robustness and variation including from the ASHE, the LFS gross earnings for full and part-time workers, and the minimum wage. These are then converted to lost economic output using the labour share of income at 59.7% (ONS, Q3 2025).
Tax revenue foregone, is estimated by the amount of income tax and employee national insurances individuals would pay on their earnings.
15.1.2 Limitations and caveats
This headline figure presented assumes:
- full-time employment for every person, and that this doesn’t displace an existing worker or change any other labour market or productivity dynamics
- that they achieve the average productivity and compensation for their age
- that NEET young people aren’t doing anything “productive” in the counterfactual – where in practice they may be performing roles such as parents, carers or volunteering that could directly or indirectly increase output
- that earnings don’t translate into multiplier impacts
- tax revenue foregone estimate excludes additional potential taxes such as employer national insurance contributions to avoid overestimating benefits of new jobs created
As the estimates are static, no additional implications for public debt dynamics or wider consumption-linked taxes (such as VAT) are included.
15.1.3 Findings
This direct economic value lost is presented as £38 billion, net of tax. The direct tax revenue foregone is presented as £3.2 billion.
15.2 Additional NHS expenditure due to health-related economic inactivity
This estimate draws on evidence linking economic inactivity to higher healthcare costs and applies this to the current NEET population to produce an estimate of the incremental health system cost attributable to economic inactivity.
15.2.1 Assumptions and data
The LFS is used to estimate of the number of young people economically inactive due to health or disability.
The cost of working-age ill-health and disability that prevents work is available at the DWP publication.
15.2.2 Methodology
The DWP publication used identifies an additional NHS cost of £910 per person per year (2023 prices) associated with an individual with health problems moving from economic activity to inactivity. For this analysis, this figure is inflated to 2025 prices.
This is applied to the NEET population that is inactive due to long-term sickness or disability.
15.2.3 Limitations and caveats
This is an average cost for the population, which may be different for young people.
This is conservative as it does not include people who are inactive for other reasons and have a health condition.
15.2.4 Results
The total increased health spending is presented as £0.2 billion.
15.3 Supplementary estimate – costs of mental health across all NEET young people
This estimates the cost of mental health issues across the NEET population.
15.3.1 Data sources
Centre for Mental Health, The economic and social costs of mental ill health, March 2024.
NHS England, Adult and older adult mental health estimates.
Health Equals, A vicious cycle: young people out of education, employment or training, March 2026.
ONS Population estimates for the UK, England, Wales, Scotland and Northern Ireland: mid-2024.
15.3.2 Methodology
The Centre for Mental Health’s £25 billion cost is divided across the estimated proportion of people with mental health conditions in England (one quarter of 58 million) to reach an average per-person cost of £1,700.
This is applied to the estimated proportion of young NEET people with mental health conditions in England, 60% of approximately 840,000.
15.3.3 Key assumptions and caveats
This approach is a broad estimate intended to give a sense of scale:
- dividing the Centre for Mental Health’s estimate by overall estimated prevalence across the entire population assumes costs are similar across different groups
- the assumption around proportion of people with mental health issues used is for the adult population, which is lower than for younger groups
- this does not represent an additional marginal cost of NEET, as many young people will have pre-existing personal or contextual factors impacting both their NEET status and mental health
- the estimate of number of NEETs with a likely mental health condition may be an over or underestimate of the scale and severity of these conditions
15.3.4 Findings
The results are presented as a stand-alone estimate “in excess of £850 billion” across the population of NEET young people, to reflect uncertainty around the range. These are not included in total cost estimates due to the risks of double counting with other estimates, and because they do not represent marginal impact of NEET status.
15.4 Wellbeing estimates
This analysis estimates the annual subjective wellbeing cost associated with the NEET population using the WELLBY monetisation framework. The WELLBY approach converts changes in life satisfaction scores – measured on a 0 to 10 scale – into monetary equivalents, providing a measure of welfare loss that complements the earnings-based estimates elsewhere in this analysis.
15.4.1 Data Sources
HMT Treasury Wellbeing Guidance for Appraisal: Supplementary Green Book Guidance.
APS – subjective wellbeing responses.
15.4.2 Methodology
The ONS/HM Treasury WELLBY guidance publishes a central monetary value of £13,000 per one-point change in life satisfaction on a 0 to 10 scale, which is adjusted to a 2025 value base.
The central estimate is used throughout as the primary figure. All results are presented as single-year annual estimates.
The wellbeing estimate is calculated using responses to subjective wellbeing questions for the APS, where data is available for individuals both when they are NEET and non-NEET. The average change in subjective wellbeing is 0.43 points. This method accounts for some fixed individual-level effects but not temporal or other circumstantial changes (like in health), or how these impact the individual. There may be a bias towards individuals that have been NEET for longer. The value is therefore adjusted so we are taking a third to a half of initial value.
15.4.3 Limitations and caveats
The estimates are based on relatively small samples.
The appropriate adjustment for NEET-attributable wellbeing impact adds uncertainty but avoids over-estimating impacts
15.4.4 Results
The individual wellbeing loss is £2,900.
The total wellbeing impact is presented as £2.7 billion.
15.5 Public sector spending – direct
This estimate looks at how much is spent on benefits for all 16 to 24 year olds, NEET young people, and the amount attributable to young people being NEET.
15.5.1 Data sources
This analysis draws on:
- estimates of spending on PIP for young people calculated for the Young People and Work Review
- estimates of spending on DLA, ESA and Jobseeker’s Allowance calculated for the Young People and Work Review
- internal DWP estimates of the spend on Universal Credit for young people.
- benefit caseload figures by age
- Universal Credit claimants by employment status
- The Work Aspirations and Support Needs of Health and Disability Customers- a focus on young people. See Section 19.
- ONS sociodemographic, health, and employment characteristics of young people who are NEET, England
The spend on total key benefits for young people adds together spend on PIP, DLA, all components of Universal Credit (UC), ESA and Jobseeker’s Allowance. It excludes payments related to having children.
DLA, ESA, and Jobseeker’s Allowance estimates are based on calculating the proportion of young people claiming these benefits and applying this proportion to total spending values from DWP outturn and forecast tables.
The spend on total key benefits on NEET young people makes assumptions on:
- the proportion of UC Standard Allowance and Housing spending on those out of work, based on approximate proportion of UC claimants not in employment (74%)
- the proportion of UC Health (UC-H) claimants who are in work, based on survey responses of the proportion of claimants in work (7%)
- the proportion of PIP going to NEET young people, based on estimates produced for the Young People and Work Report (37%)
- the proportion of DLA going to NEET young people, based on the proportion of 16 to 17 year olds NEET with SEN/education health care plans (10%)
The proportion assumed to have been avoidable if all people were in work, and earning above the UC thresholds is comprised of:
- the UC components
- the ESA and Jobseeker’s allowance components
15.5.2 Limitations and caveats
UC is delivered as a single payment. To estimate expenditure at the element level, the approach used in the Benefit expenditure and caseload tables was adopted. For further information, please refer to the ‘Notes’ tab available in the benefit expenditure and caseload tables.
For households with multiple claimants, total UC expenditure is split in half and divided equally between members. This allocation does not account for whether specific element entitlements apply to only one individual within the household. For example, if only one member qualifies for the Limited Capability for Work (LCW) and Work-Related Activity (LCWRA) element, the associated Health Element expenditure is still apportioned across both members.
This approach excludes some benefits, such as Housing Benefit, to focus on the key relevant benefit groups.
This approach assumes that payments going to different age groups is equal. This may not be the case for all benefits.
Proportions going to young people NEET are based on high-level assumptions.
Using the proportion of the UC caseload out of work as a proxy for spending on NEETs, may capture some young people in education. However, overall, applying the proportion of the caseload in this way is likely to be an underestimate of the proportion of the expenditure, as payments going to those in-work will generally be smaller than those out of work.
For the value attributable to young people being NEET, we have assumed that all young people claiming these benefits could be in work, in line with our economic potential assumptions. There will be practical barriers that mean this is not achievable, even with accommodations (for example, due to health or disability).
The value attributable to young people being NEET implicitly assumes that earnings would be sufficiently high that the individual would no longer be eligible for UC.
15.5.3 Results
The results are presented as:
- £8.1 billion for the total spend on young people across key benefits
- £4.4 billion for the total spend on NEET young people
- £3.2 billion for the total spend on NEET young people, that could have been avoided if they were in work
15.6 Scarring estimates
The scarring estimate represents the working lifetime (up to age 68) cost of being NEET in youth and then returning to the labour market in later years.
This is calculated by estimating the difference between lifetime annual earnings for the never-NEET population and a lower earnings profile attributable to being NEET.
15.6.1 Methodology
A lifetime annual earnings profile across individual ages is created based on the ASHE. This yields a continuous predicted earnings value for each individual age from 18 to 68. A real earnings growth of 0.86% per annum is applied based on average earnings growth levels since 2005.
Total annual compensation is defined as post-tax earnings plus the combined employer and employee pension contribution in each year. Cumulative pension wealth at retirement is excluded in the lifetime total. Earnings at each age are adjusted for employment rate within that age band, such as high levels of employment between an individual’s thirties and fifties, that taper off as the individual ages.
Scarring penalty
The scarring analysis applies a permanent proportional reduction to the earnings profile to reflect the long-run employment/wage penalty associated with a period of unemployment or inactivity at age 18 to 24.
De Fraja et al. (2021) estimate that each month of unemployment between ages 18 and 20 is associated with a permanent long-run earnings penalty of 1.2%, and 0.35% for unemployment between the ages of 21 to 23. Their research only extends to age 41 due to data availability, but the authors find that the impact is still strongly evident at this age, although there are declines over time. There are reasons to believe that scarring continues to older ages, including new evidence from UCL.
For the annual cost estimate, it is assumed that the average NEET young person is not participating for a full year. Analysis of LFS data suggests that close to 60% were out of work or education for more than a year, so this is likely a representative assumption. The cumulative number of months (12) is then multiplied by the monthly scarring penalty for the relevant age group.
The scarring impact is assumed to manifest in lower employment levels in each year, which are subtracted from the baseline employment rate for the age group. Figures are discounted using standard HMT Green Book rates.
Aggregating impacts
The aggregate impact is calculated as the sum product of the lifetime earnings penalty across the number of people NEET at each age. The lower earnings are converted into output/GVA figures in line with the methodology used for the direct impacts.
These are then adjusted to only apply to the overall proportion of young people who have either been out of work for 6 months or more if they have previously had a paid job, or left education a year or more ago if they have not. This is likely a conservative approach, intended to exclude “transitional”, short-term young people NEET who are less likely to experience the scarring impact.
Tax revenue and increased benefit spend due to scarring
Reductions in tax revenue use the same methodology outlined for direct costs, applied to the baseline and scarring earnings profile. This is summed across the population most likely to experience the scarring impact, as described in the output scarring section. Increased benefit spend is calculated by assuming that individuals who are not in employment due to the scarring impact, receive standard UC (at current rates, assumed to stay constant in real terms) during periods out of work.
15.6.2 Limitations and caveats
The model cannot capture the complexity of many individuals’ lives. This is a stylised persona intended to give an average and indicative view. Individual characteristics and labour market experiences will influence impact on both earnings and public sector spending.
By necessity of long lead-in times for capturing outcomes after 20 years, estimates are based on much earlier cohorts of people who were NEET.
The evidence on scarring impacts primarily focuses on impacts for men; these have been applied across both genders under the assumption that the labour market experience of today is more closely aligned.
15.6.3 Findings
Results are presented as:
- the aggregate scarring impact on output is £63 billion
- the aggregate public sector spending impact (tax revenue foregone and benefit spend) is £15 billion
15.7 Individual lifetime impacts
The individual lifetime impacts closely follow the scarring methodology set out above, but presents figures in terms of lost earnings to the individual (instead of output to the economy) alongside the fiscal impacts.
The lifetime impact considers both the direct loss of income during the period of being NEET, and the long-term scarring impact.
Two different figures are produced:
- an estimate of the impact of one year being NEET
- an estimate of the “ceiling impact” of being NEET, for example, continuously between the ages of 18 and 24
15.7.1 Data and assumptions used
See “Scarring Estimates” data sources.
15.7.2 Methodology
The yearly impact methodology is near-identical to that described in aggregate impacts. For the direct benefit spend, the average AME spend across all NEETs is considered (for example, lower to account for not all young NEET people claiming). The final presented value is the average earnings impact across all ages, net of offsetting lower taxes and increased benefit payments.
15.7.3 Limitations and caveats
In addition to the limitations of the aggregate scarring impact, the ceiling estimate produced carries additional uncertainty as outcomes for this group have been less well-studied.
15.7.4 Results
The Net Present Value earnings loss per year NEET is £52,000. The present foregone revenue and benefit spend is £3,800.
The Net Present Value for the ceiling estimate (being NEET continuously between ages 18 and 24) is £293,000. The foregone revenue and benefit spend is £15,000.
15.8 NEET population, scenario and forecast estimates
The purpose of this analysis is to estimate how the number and percentage of NEET young people will change under different scenarios and forecasts.
15.8.1 Data sources
ONS Population estimates for the UK, England, Wales, Scotland and Northern Ireland: mid-2024.
ONS National Population Projections; 16 to 24 population projections from 2026 onwards.
NatCen/YFF - Risk factors for being NEET among young people.
Internal analysis of the change in the prevalence of risk factors. Youth Futures Foundation - Youth Futures Foundation – SARIMAX. NEET Forecast – Five-year forecasts produced by the Economics and Analysis Team at YFF.
15.8.2 Methodology
The estimate for the current population is derived from the LFS using a 4 quarter average (Q4 2024 to Q3 2025) disaggregated by age, gender, reason for being NEET. These are used throughout the analysis.
In addition, the following scenarios are presented for 2030 to 2031:
- the central forecast is based on the Youth Futures Foundation baseline forecast and builds in an additional assumption that the young people entering the labour market as part of the “demographic bulge” have a higher baseline NEET rate
- the “observed risk” (medium) and “increasing risk” (high) scenarios are calculated using research on risk factors and published statistics of risk factor prevalence. The rate of change from 2024 to 2025 figures to the 2030 to 2031 scenario is assumed to be linear. The methodology for this is described below in further detail.
These scenarios do not attempt to capture every factor that could impact NEET rates but are intended to show the impact of different moving parts.
For the “observed risk” and “increasing risk” scenarios, the NatCen/YFF risk factor paper is used to identify the most significant risk factors. Publicly available information on these risk factors, or relevant proxies, is then used to understand how prevalence has changed for children and teenagers from 2017 to 2018 (or the 2018 calendar year or 2018 to 2019 where not available) and the most recent available data. This does not provide information about how changes are distributed across the population, and is not a precise estimate, but gives an understanding of the trajectory and magnitude of trends.
Figures are normalised to be across a consistent population base (such as teenagers instead of all children, or just 16 year olds, England vs UK) using ONS mid-year population estimates.
This exercise finds an increase of approximately 0.6 additional risk factors per person.
The results of both this (“observed risk trends”) and a scenario where that number has been rounded up to 1 is presented (“increasing risk trends”). The rationale for allowing a higher than observed increase is that:
- some risk factors are excluded, either because data or a good proxy is not available (like low parental involvement in education) or not relevant to the age group (like having a child after the age of 21)
- some risk factors may still be increasing or manifesting in later ages (like after the age of 16), so would not be captured by the data collection exercise
- factors that carry greater risk have increased more than those with smaller associated risk
- data is collected as point estimates, and the number of individuals who experience a risk factor over their lifetime/their youth will be greater than the number experiencing them at any one time
- if the current trends continue, younger groups not captured by the exercise will have even higher prevalence of key risks
15.8.3 Limitations and caveats
This analysis assumes all other factors that impact the likelihood of becoming NEET stay constant (such as labour market conditions).
Data availability means that there is some inconsistency in years used. These figures are intended to provide an indication of scale.
It assumes that the relationship between number of risk factors and NEET likelihood remains stable over time.
It assumes that the risks are evenly “distributed” across the population.
The YFF work finds that the average number of risk factors is 4, and that the probability someone will have experienced a period of NEET is 24%. Based on YFF’s reports of how the number of risk factors translates into being NEET, the “true” average is calculated to be 4.5. A quadratic curve is calculated to fit the risk factor NEET status relationship. The increase in NEET rate/population is calculated as the difference in NEET likelihood between 4.5 risk factors (24 to 25%, depending on curve used) and 5.5 (25 to 32%), and applied to the expected population of young people in 2030/31. This is translated into a rate by taking the average increase and applying it to the inactivity and long-term unemployment rates in 2015 when data for the YFF report was collected – NEET rate 12.7% - and, also 10-year average across these – NEET rate 12.1%. Short-term unemployment is assumed to stay constant at the current rate, as this is least likely to be impacted by individual characteristics.
15.8.4 Results
For the “observed risk trends” scenario, this leads to an estimate of 310,000 to 470,000 more young people likely to become NEET. The average NEET rate of 14.3% is presented in the report for this scenario.
For the “observed risk trends” scenario, this leads to an estimate of 520,000 to 820,000 more young people likely to become NEET. This corresponds to 15.9% to 16.6% NEET rate, with economic inactivity at a marginal historic high (9.8% vs previous high of 9.5% in 2009). The average of NEET rate of 16.3% is presented in the report for this scenario.
16. Regional Workshops with Local Stakeholders held in Benwell, Bradford, Islington and Tendring
This purpose of this study was to consider local context on youth economic inactivity, to understand local variations in barriers and opportunities for work, education and training for young people and to hear examples of existing place-based solutions and good practice.
16.1 Method
The team visited 4 selected areas across England. These 4 focus areas were:
- Benwell (Newcastle-upon-Tyne, North-East)
- Bradford (West Yorkshire, Yorkshire and the Humber)
- Islington (Greater London)
- Tendring (Essex, East of England)
This was a rapid study conducted in February and March 2026, using a mixed methods approach. There were 2 main workstreams:
- quantitative analysis: the team analysed official statistics, including administrative and survey data, to develop a brief data profile for each of the focus areas. This includes data on: levels of employment, unemployment and economic [in]activity.
- interviews and roundtables: a team member facilitated a roundtable in each area with representatives of employers, education providers, charities and other organisations that work with young people in the local community. Roundtables were conducted using a semi-structured guide that allowed participants to raise and explore issues particularly relevant to their area, within the broad themes of the research. Between 7 and 12 people participated in each roundtable. Participants reflected an opportunity sample based on current contacts within YFF and its partners; this was the most practical approach to recruitment given the rapid nature of the project. In addition, 4 interviews with representatives of the local and combined authorities were conducted. This data was analysed thematically.
In the discussion below, participants in roundtables and interviews are all referred to as ‘stakeholders’. Throughout this report, stakeholder views are presented as perceptions unless otherwise supported by evidence. Their perspectives are valuable in understanding how systems operate on the ground but should not be interpreted as factual statements about all young people or all families.
To support the thematic analysis, the research team examined a small number of local strategies, plans and other policy-related documents. Our aim was to gain a deeper understanding of current activities in the focus area and provide additional detail about cases that were especially salient for the people we spoke to. This work was guided by the topics raised in the roundtable and interviews, and the examples given by stakeholders. We did not attempt to provide a full account of current interventions and initiatives in the focus areas. Inevitably, some key examples may have been omitted and the prominence given here to specific instances should not be taken as an indication of their relative importance. Findings from a full-scale structured search of literature on youth employment and learning in these areas would probably look very different. Nevertheless, we hope that our examination of these texts provides useful pointers and a richer picture of the considerable work and commitment to improving the lives of local young people that is already in place.
16.2 Headline findings
Across the areas there was some variation in issues raised and localised context, but primarily stakeholders were consistent in flagging key underlying structural issues, summarised below.
Early disengagement
Stakeholders described disengagement in education – of which school absence was considered a symptom – as an early barrier to being at greater risk of becoming NEET. Stakeholders reflected on how disengagement can result in low attainment at level 2 and further disengagement at post-16. Low attainment at level 2 was itself regarded as a huge barrier to young people’s post-16 progression.
Stakeholders spoke of how the SEN support system does not have the capacity to cope with increases in SEN, contributing to high levels of disengagement in school. Social, emotional and mental health was raised across all areas, with stakeholders wanting more early intervention and low-level support.
Inconsistent access to post-16 pathways
A lack of post-16 pathways, including declines in vocational education and apprenticeship opportunities, was a common theme across the areas. Stakeholders in Benwell, Bradford and Tendring noted a general lack of opportunity for local employment and post-16 vocational provision. In Islington there was a reflection that, while there were many opportunities in the area, young people from deprived backgrounds did not see these as accessible.
Stakeholders commented on schools typically focusing more on academic pathways post-16 and being less equipped to support alternative vocational and employment pathways. This was coupled with a frustration of a perceived lack of focus on developing transferable skills, enrichment opportunities and preparation for employment in the curriculum.
Limited work experience and careers provision
Careers provision was raised in every area, perhaps the strongest issue raised in Islington, with stakeholders recognising it as a key part of the disconnection between the opportunities available and young people’s access of them.
The perceived decline in work experience opportunities was seen as a key barrier across all areas. Stakeholders spoke of how employers are keen to help but feel constrained by red tape, limited capacity and a lack of partnership working between schools and employers.
Careers provision and work experience were thought to be particularly important for young people who do not have the personal networks to support them.
Struggles in accessing entry-level roles
The sheer number of roles young people are applying for and receiving no response or feedback was raised in multiple areas, coupled with a reflection that some young people are unsure of how to communicate their skills. It was felt that entry-level jobs requiring prior experience was a major barrier for young people entering the labour market for the first time.
Stakeholders noted that recent employment reforms and the current economic situation is contributing to the narrowing of entry-level roles and employers’ perceived hesitation to take on young people – particularly for small and medium sized enterprises.
Even when a young person secures a job, stakeholders spoke of the importance of ongoing and structured follow‑up support. This included resourcing and training for employers to support young people with SEN and those with lived experiences.
Transport was regularly raised as a significant structural barrier. Unreliable routes and the cumulative cost of bus fares can make regular commuting unsustainable, particularly for young people in precarious financial circumstances.
Identifying and engaging ‘hidden NEETs’ was identified as a challenge in a number of areas.
Disjointed working
Stakeholders viewed joined-up support and accountability across all services – including health, employment and education – as vital. However, stakeholders described how current services often work in silos. Stakeholders also spoke of frustrations with what they perceive to be the DWP’s lack of understanding of what co-design and partnership at a local level is.
Fragmented funding
Criticism of short-term and fragmented funding systems was prominent across all areas. Stakeholders felt the current funding system makes it difficult to focus on long-term, strategic support and collaboration. Stakeholders also aired frustrations at how funding often requires new approaches, rather than continuing to fund what is known to have worked previously.
16.3 Stakeholder recommendations
Examples of good practice from stakeholders and local strategies
Throughout our research, stakeholders gave a number of examples of what they perceive to be good practice happening across the areas. Examples include:
- North-East Ambition – bringing together employers and education providers
- a programme in Islington working with Year 9s, to offer careers guidance earlier
- an FE provider has a ‘right course review’ to reduce the number of early dropouts
- Tendring 100 – encouraging employers to recruit apprentices locally, offering financial support to help cover costs and delivering outreach activities
- supported internships helping young people with SEN to gain work experience
- in Benwell, an example was given of an inclusive toolkit created for employers
- in Bradford, the local health and care partnership has developed a local health, care and wellbeing strategy, bringing together clinical treatment with wider support
- Employment West Yorkshire – a regionally-led, flexible and responsive programme that has enabled targeted support for young people
Potential solutions offered by stakeholders
Stakeholders offered a variety of thoughts on what they perceived the potential solutions to be. These solutions vary in whether they are local, placed-based or national. A summary of the solutions that were suggested included:
- utilising youth and community provision to re-engage young people
- ensuring all young people have access to a trusted adult
- more early intervention on underlying issues driving disengagement in education and incorporating early identification and support of young people at risk of NEET
- better partnership working between employers and schools to create more careers and work experience opportunities and for careers provision to be introduced earlier
- more vocational and employment pathways and for schools to be equipped to support young people onto these pathways
- a greater focus in education on the development of transferable and ‘soft’ skills, and more access to enrichment opportunities
- better enabling employers to deliver inclusive recruitment practices, identify roles that can be offered at genuine entry-level and provide appropriate in-work support
- more joined-up working, shared accountability and shared goals
- a move away from the current ‘deficit-focused’ model and towards an approach that builds on young people’s strengths and aspirations
- longer-term funding strategies that are consistent, with a focus on commitment, consistency and flexibility to respond to local needs
17. Hidden NEETs in England
17.1 Data source
Registration and Population Interaction Database
The Registration and Population Interaction Database (RAPID) data bring together data from multiple sources, including from DWP, HMRC, DfE, and local authorities. RAPID is a dataset produced by the DWP. RAPID contains data for every National Insurance number interaction with the tax and benefits system since 2008, except self-assessment for those who have been living off investments or capital income. Each National Insurance number is assumed to relate to a unique individual. RAPID can be used for longitudinal analysis across years from the earliest available year of 2008 to 2009, to the latest financial year, 2024 to 2025.
Longitudinal Education Outcomes
The Longitudinal Education Outcomes (LEO) data is a database from DfE, which contains information on the labour market outcomes and educational pathways for learners from schools in England, colleges and universities. The LEO standard extract is the version of the LEO data that is available to external researchers, via the Office of National Statistics Secure Research Service.
LEO brings together data from DfE’s LEO partners:
- DWP
- HMRC
- Joint Information Systems Committee
Read more information on the LEO dataset here.
Labour Force Survey
The LFS - conducted by the ONS - is a large, representative household study and provides detailed information related to the UK population’s activity in the labour market. The LFS is the basis of the headline labour market statistics produced by ONS.
Ongoing challenges relating to response rates and weighting mean the LFS is considered “official statistics in development” until further notice. Increased volatility in the estimates means changes over time should be treated with additional caution.
The Annual Population Survey
The APS is a continuous household survey, covering the UK. The APS is produced by ONS. It is not a stand-alone survey; it uses data combined from 2 waves of the main LFS alongside a local sample boost. The APS is a recommended source for employment, unemployment and economic inactivity statistics for smaller groups of the population. APS estimates are also currently being published as “official statistics in development” until further review due to the ongoing issues with the LFS.
Read more information on the LFS and APS datasets here.
17.2 Definitions
Someone is flagged as being in education, employment or training if they are:
- in employment or self-employed at any point during the reference month
- they are identified as being in education based on Key Stage 4, Key Stage 5, Individualised Learning Record (ILR), Higher Education Statistics Agency (HESA) and Schools Census data
Someone is flagged as being NEET if they are not captured in the above 2 groups and if they have been NEET for the entire month.
Hidden NEETs are defined using the above definition of NEET and have not claimed any benefits during the month that they are identified as being NEET.
17.3 Methodology
RAPID and LEO linked data is used to create a definition of a NEET as it contains variables relating to employment, education and allows us to break down by age.
RAPID contains information for employment and self-employment for each National Insurance number. For this analysis we have merged the employment and self-employment indicators to create an overall indicator of employment. It contains people in employment or self-employment at any point during the month.
Analysis uses data at a monthly level which is averaged across the year to mitigate seasonal variation.
The education data captures spells of education for those who went to secondary school in England. People in education is derived from Key Stage 4, Key Stage 5, Individualised Learning Record (ILR), Higher Education Statistics Agency (HESA) and Schools Census data. The data available contains a start and end date for each spell of education. A monthly flag is created based on the length of spell.
The Key Stage 4 and Key Stage 5 data includes individuals taking GCSEs and A-levels in England (or equivalent).
The HESA data includes any UK-based higher education taken by individuals who went to school in England only – for example, if someone who went to school in England then goes to university in Scotland, they will be included; however, someone who went to school in Scotland, but to university in England will be excluded.
The ILR data contains individuals taking any further education courses in England regardless of where they went to school.
The education data used doesn’t contain GSCE, A-level (or equivalent) or higher education data for people who went to school outside of England. It will contain further education data for this group if the course itself was taken in England.
Someone will be captured as NEET only if they have been NEET for the entire month.
RAPID contains a flag which identifies someone as resident in the UK only if they have had any interaction with employment or benefits during the financial year. For this analysis, the NEET flag is derived based on anyone on RAPID regardless of residency. The final outputs then estimate the number of NEETs claiming benefits before being used in combination with Labour Force Survey data. Therefore, anyone claiming benefits must be resident in the population based on the RAPID residency flag.
The final population is defined as those aged 18 or older at the end of the month, but younger than (not inclusive) 25. We exclude 16 and 17 year olds as generally this group cannot claim working-age benefits such as UC. This means we include people who turned 18 at any point in the month but exclude anyone who turned 25 in the month. We filter to those recorded as living in England based on their geographical Output Area.
For those flagged as NEET on the RAPID-LEO dataset, we identify those claiming UC, those not claiming UC but claiming PIP, and claiming any other benefit.
We use the LFS non-seasonally adjusted quarterly estimates for the quarters in financial year ending 2024 filtered for those in England aged 18 to 24.
To then estimate the NEETs that are hidden, we subtract the NEETs on RAPID-LEO who are claiming benefits from the LFS estimate quarterly estimates.
This means for claims in May 2023, we subtract benefit data derived in RAPID-LEO from the April to June 2023 quarter in LFS, for June 2023 we subtract benefit data from the April to June 2023 quarter, for July 23 we subtract the data from the July to September 2023 quarter and so on. The final outputs are then averaged to get an average for the 2023 to 2024 financial year.
The APS is used to estimate the reasons for being NEET for NEETs who are not claiming benefits in England aged 18 to 24. Due to small sample sizes, this data has been pooled over 3 years (2023 to 2025). These proportions are then applied to our derived hidden NEET population to estimate the number of people in 2023 to 2024.
17.4 Key assumptions and caveats
The definition of those NEET may differ from other interpretations.
This analysis is exploratory.
This method assumes that uncertainty around residency is concentrated within the hidden NEET group, and that individuals flagged as NEET and claiming benefits on RAPID-LEO provide a reliable measure of those young people NEET interacting with the welfare system in England.
RAPID contains data for every National Insurance number interaction with the tax and benefits system. Each National Insurance number is assumed to relate to a unique individual.
Those flagged as being NEET are captured if they have been NEET for the entire month.
RAPID only contains information for people with a National Insurance number, some people will be in the UK but not have one. This includes: someone migrated to the UK for education, but didn’t have a part-time job or a placement year – a National Insurance number is not required just for education purposes, only if intending to work; a partner of a migrant. They will not receive a National Insurance number if they are not in employment or claiming any benefits; a child not eligible for child benefit due to being a child of a migrant, or due to having parents who does not register for child benefit.
Those in employment during the month are included as in work, rather than NEET, even if they do not have positive pay.
Someone will be considered in employment even if they have only been employed for one day during the month.
Self-employment may not be gainful. This means people classed as self-employed could be earning as little as £1 per month.
Some people working in secure and/or sensitive employments may not have an employment record in the RAPID data. These are not supplied to DWP or HMRC analysts for security reasons.
Not everyone flagged as resident will be a UK resident and not everyone flagged as non-resident will have left the UK. However, this is the best estimate and in line with UK population estimate methodology.
The education data only captures those who went to secondary school in England. If someone went to secondary school in Wales, Scotland, Northern Ireland or abroad, they are missed out of education data. Although the impact of this has been mitigated by keeping the population as England only, some people may still be in education who are not flagged.
The data is limited to 2023 to 2024 as some rules that are applied throughout the time series cannot be applied in the 2024 to 2025 tax year.
Given we use 2 different data sources (administrative data from RAPID and LFS data) to derive the estimate, we assume there is some consistency between these sources in terms of populations generally and NEET numbers specifically.
Confidence intervals have been calculated based on the assumption that it is a simple random sample. This may provide more conservative estimates compared with other methods.
17.5 Findings
In financial year ending 2024, around 678,000 18 to 24 year olds in England were NEET. It is estimated that of this group, around 314,000 were not claiming any benefits, termed “hidden NEETs”. The phrasing “hidden NEETs” refers to those young people NEET who are not in contact with the welfare system. They may have contact with other services, including those delivered locally or by voluntary and community sector, which cannot be identified through these data sources. It is estimated this figure falls within the range 238,000 to 390,000.
The most common reason for being NEET among these “hidden” young people is that they are looking for work, or a suitable course (39.1%). When applied to the estimated number of hidden NEETs, this accounts for around 123,000 people. Nearly 1 in 5 (18.1%) give the reason “Other reason” for being NEET. Around 15.2% are waiting to start a job they have already obtained or a course they have been accepted on. See Figure 13 in the Young People and Work Interim Report.
Nearly half of 18 to 24 year old NEETs in England are estimated to be “hidden”
Figure 1: hidden NEETs by benefit status and reason for being NEET, 18 to 24, England, 2023/24
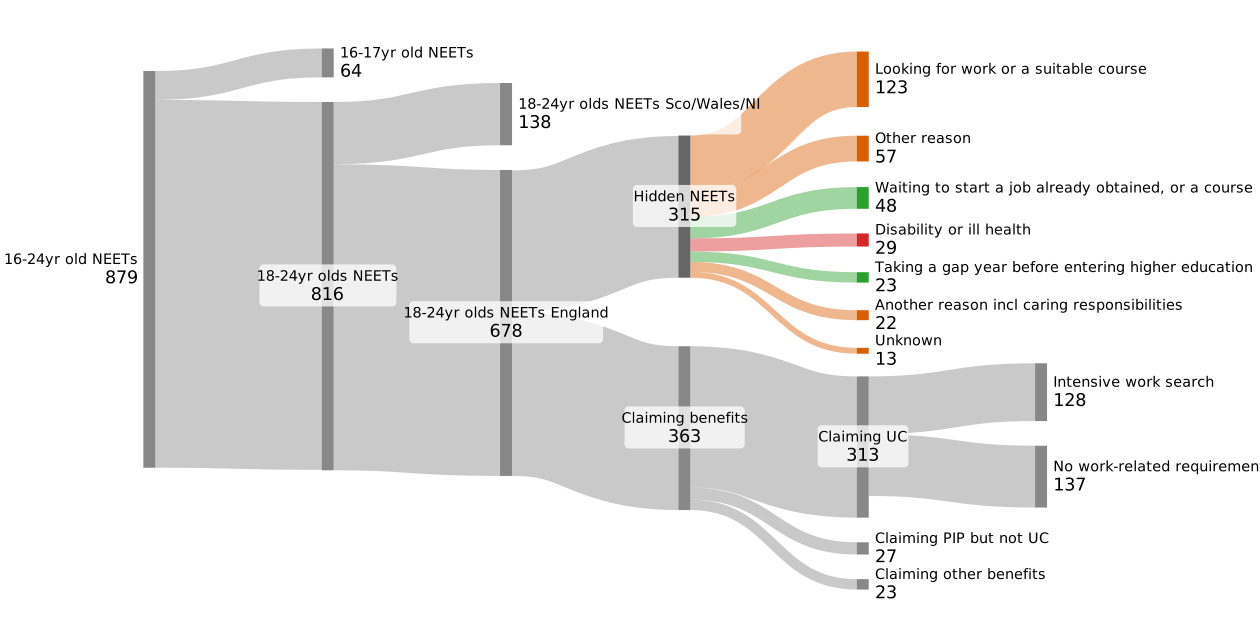
Note: Figures are semi-illustrative and includes data from various sources. Due to rounding, there may be discrepancies between groups.
Data related to hidden NEETs can be found in supplementary Table 25. Around 1 in 5 (128,000) young people who are NEET in England, are claiming UC and on Intensive Work Search. Another 1 in 5 (137,000) are claiming UC but have no work-related requirements. See Figure 37 in the Young People and Work Interim Report or the supplementary Table 13.
For all data related to hidden NEETs, see supplementary Tables 2, 13 and 25.
18. Overall outcomes for young people claiming health and disability benefits
18.1 Data source
Into work rates are calculated using DWP administrative data for the UK.
PIP and UC-H/LCWRA caseload and expenditure forecasts for 16 to 24 year olds are based on data from Stat-Xplore and Autumn Budget 2025 benefit caseload and expenditure tables.
18.2 Definitions
UC Health (UC-H) in this analysis refers to claimants in receipt of the ‘limited capability to work’ element, also known as the ‘health element’, which is offered to claimants receiving a LCWRA WCA outcome.
LCWRA - This is the extra amount of money in addition to the UC standard allowance for people who have limited capability for work and work-related activity.
PIP - Personal Independence Payment can help with extra living costs for those with long-term physical or mental health condition or disability, difficulty doing certain everyday tasks or getting around because of their condition or both.
18.3 Methodology
18.3.1 UC Health into work rates
This analysis uses employment data on Universal Credit claimants held on DWP computer systems with encrypted personal identifiers, which is analysed such that claimants who enter work in a given month and sustain it for the next 2 months are classed as claimants moving into work.
In addition, these rates also cover those claimants who have already satisfied this criteria in a month earlier than the base month and have remained in work alongside staying on UC-H ever since.
The into-work rates are worked out based on individual age years and are based on averages taken across the into-work rates for age years within the group.
For example, the rates for 18 to 24 year olds represent the into-work rates of claimants aged 18 to 24 averaged to derive the into-work rate for the age group.
18.3.2 PIP and UC-H/LCWRA caseload and expenditure forecasts for 16 to 24 year olds
Prevalence projections are derived from caseload/populations using a weighted average and year on year change to project forward a rate, which is then applied to population projections to produce fifteen-year caseload projections by age.
State pension age increases are applied to the prevalence, which then feeds into caseload projections.
Average awards are projected in a similar way to prevalence but capped so that weekly amounts cannot exceed maximum award levels.
18.4 Key assumptions and caveats
Since 2019, the caseload has significantly increased due to the factors outlined in T1.13 on the Pathways to Work Green Paper Evidence Pack, due to the maturity of UC and the health journey replacing ESA (income related) over time as well as Move2UC whereby existing legacy benefit claimants have been moved to UC. The growth in numbers of people in the health journey means that the denominator is growing over time, resulting in lower rates into employment using the current method.
Since the UC-H caseload is subject to retrospection, it implies that the into work rates are subject to retrospection as well.
The calculation of the into work rates involves rounding the percentage rates to one decimal place which brings about small but often noticeable changes to the figures.
The forecast outputs are compared to final Autumn Budget 2025 forecasts for PIP and DLA to 2031 and an average uplift is assumed for the years 2031 to 2042.
Forecast outputs have used a simple methodology and should be treated as an indication only.
Forecast estimates are based on the proportion of young people and therefore may not align with published benefit expenditure and caseload tables.
18.5 Findings
On average, fewer than 1% of young people receiving the UC-H element move into work each month. Since January 2023, this group is less likely to move into work compared to claimants aged over 55. Data for all age groups can be found in supplementary Table 27.
The number of young people claiming PIP is expected to quadruple over just a quarter of a century from 2012 to 2037. Underlying data can be found at Stat-Xplore and supplementary Table 28.
Annual PIP expenditure for 16 to 24 year olds rose from approximately £1.3 billion in the financial year ending 2020 to around £3.3 billion in the financial year ending 2025. In 5 years’ time, we estimate that PIP, on the current trajectory, will have further doubled in cost to £6.5 billion and cover 700,000 young people.
The PIP caseload and expenditure are projected to increase by financial year ending 2041, up to 877,000 and £9.2 billion respectively. The LCWRA caseload is projected to rise to 229,000 in financial year ending 2041. However, the LCWRA caseload is projected to fall to £750 million in financial year ending 2041. See supplementary Table 28 for underlying data.
19. The Work Aspirations and Support Needs of Health and Disability Customers survey - a focus on young people
19.1 Data source
The Work Aspirations and Support Needs of Health and Disability Customers survey was conducted in October and November 2024 online, by telephone, by post and in person with health and disability customers.
A total of 3,401 working-age health and disability customers took part in the survey, and this included 293 customers aged between 18 and 24 years. All participants were in receipt of at least one of the following health and disability benefits:
- UC and UC-H
- ESA
- PIP
Customers had varying levels of conditionality as follows:
- customers with some or full work-related activity requirements
- customers with no work-related activity requirements
- customers awaiting their work capability assessment
19.2 Definitions
Work-related activity requirements – a singular or several defined activities that enable a customer to move into work, remain in work or move closer to the labour market.
Work capability assessment – if a person claims ESA/UC because of a health condition/disability they must have a Work Capability Assessment (WCA). This is a test used by DWP to determine to what extent a person’s illness or disability affects their ability to work. Depending on the outcome of the WCA, people are either deemed to be fit for work, or entitled to ESA/UC-H journey. Those deemed not to be fit for work are then placed in one of 2 groups: the ESA Work-Related Activity Group/UC-Limited Capability for Work, members of which will have regular appointments with an advisor; or the ESA Support Group (ESA SG)/UC-Limited Capability for Work and Work Related Activity, members of which do not.
19.3 Methodology
The survey had a response rate of 21% and as part of the data analysis, responses were weighted to account for oversampling and non-response.
The full survey dataset was filtered by age to analyse the responses of customers in the ‘under 25’ age band. The responses of older customers, aged 25 and above, were also analysed and used as a comparator where meaningful differences were observed. Younger customers’ responses were also divided into subgroups for comparative analysis. Differences between subgroups were tested for statistical significance at the 95% confidence level. All reported differences are statistically significant at this level unless otherwise stated.
19.4 Key assumptions and caveats
In terms of generalisability to the wider population of young health and disability customers overall, caution should be applied when drawing inferences because of the relatively small total base.
The original survey was conducted in 2024 and the responses of young health and disability benefit claimants reflect their circumstances and experiences at that time. The barriers and support needs of this group might differ today given current circumstances.
19.5 Findings
Findings from the ‘Work Aspirations and Support Needs of Health and Disability Customers survey - a focus on young people’ can be found in Chapter 6 of the Young People and Work Interim Report.
Of young people who are claiming disability or health benefits, survey evidence shows that 19% are already in work, 49% believe they could work either now if the right job or support was available, or in the future if their health improves, and only 32% feel they will never be able to work or work again.
Nearly half of health and disability claimants who were not in work and did not rule out work permanently were worried that they would not get their benefits back if they tried paid employment and it failed.
For related data, see supplementary Table 56.
20. The number of young people claiming UC LCWRA or in the means tested ESA SG citing mental health reasons or a neurodevelopmental condition
This publication provides information in relation to the number of young people claiming UC LCWRA, or in the means tested ESA SG citing mental health reasons or a neurodevelopmental condition.
20.1 Background
In the information published during the launch of the ‘Independent Report into Young People and Work’, the Department stated that “the number of young people claiming UC Health and ESA has increased by more than 50% in the last 5 years, with 80% of young people on the UC Health element currently citing mental health reasons or a neurodevelopmental condition among declared health conditions”. For more information, see Independent investigation to be launched to tackle rising youth inactivity.
This ad hoc release sets out further details relating to this statement, including the annual breakdowns of the total number of young people on UC-H and ESA and the number of young people on UC LCWRA and means tested ESA SG who have cited mental health reasons or a neurodevelopment condition as a reason for their restricted ability to work.
A claimant is on UC-H if they have acceptable medical evidence of a restricted ability to work, have been assessed as having LCW, or assessed as having LCWRA.
20.2 Methodology
For young people, aged 18 to 24, on the UC-H and ESA caseloads in Table 57, the information from February 2018 to February 2025 is extracted from published information on Stat-Xplore apart from the UC health numbers for 2018 and 2019. These figures are available for People on Universal Credit with a health condition or disability restricting their ability to work on Stat-Xplore and Employment and Support Allowance on Stat-Xplore.
For the UC-H 2018 and 2019 caseloads in supplementary Table 57, which are currently not published on Stat-Xplore, and for the UC-H conditions in supplementary Table 57, the analysis is based on case-level UC data, extracted from the DWP’s computer systems. This does not include any information that would enable individuals to be identified. For the health conditions, this information is matched to the Medical Services Referral System (MSRS), a portal between the Health Assessment Advisory Service and DWP which is only completed for conditions if a claimant undertakes a Work Capability Assessment (WCA). A claimant’s conditions will not be recorded if there is sufficient evidence in the application process to make a decision without the need for a full WCA.
There will be a very small number of claimants in this age group that are on both UC-H and New Style ESA from 2020 and could therefore be counted twice in Table 57. However, we estimate this to be less than 0.5% of the UC-H caseload.
Primary medical condition is not recorded for UC-H claimants. Claimants often have complex health issues and can thus be recorded with multiple conditions within each classification group, as well as across multiple groups, but are only recorded once within a specific classification group for the purposes of this analysis. Conditions as recorded on MSRS have been mapped to reflect as closely as possible the appropriate International Classification of Diseases version 10 (ICD10) code. For more information, see the International Statistical Classification of Diseases and Related Health Problems. Medical condition is based on evidence recorded at the WCA, this in itself does not confer entitlement to UC. During this period the number of means-tested ESA claimants declined, while UC health numbers increased, through a combination of natural turnover of the caseload, changes of circumstances that moved people from ESA to UC, and with the Department increasing the volume of managed migrations from 2024 onwards.
For ESA, the numbers provided are taken from published ESA official statistics on Stat-Xplore and based on the medical evidence provided at the start of the claim, this in itself does not confer entitlement to ESA and may not represent a claimant’s most recent medical condition. Unlike for UC, where someone has more than one diagnosis or disabling condition, only one is recorded and reported for these statistics, which should be the predominant condition, but may not be in all cases. Like UC, the conditions have been mapped to reflect as closely as possible the appropriate ICD10 code. For more information see the International Statistical Classification of Diseases and Related Health Problems.
20.3 Results
The number of young people claiming UC-H and ESA has increased by more than 50% in the last 5 years.
The table shows that as of the latest data, around 81% of young people on the UC-H element cite mental health reasons or a neurodevelopmental condition among declared health conditions, and 68% of young people on means tested ESA SG reported a mental health or neurodevelopmental condition at the start of their claim.
20.4 About the analysis
The figures presented in this release are based on internal analysis using UC data and the published ESA statistics. As these are outturn figures, using 100% of claimants in receipt of these benefits, the level of statistical uncertainty in the analysis is low. However, the results may not match exactly the totals released as UC Health Official Caseload statistics.
21. Participation outcomes for health and disability benefit claimants aged 16 to 24 years olds
21.1 Data source
DWP administrative data for UK.
HMRC Real Time Information records of employment and self-employment for Great Britain.
DfE administrative data for England.
21.2 Definitions
cDLA – Child Disability Living Allowance may help with the extra costs of looking after a child who is under 16 and has difficulties walking or needs much more looking after than a child of the same age who does not have a disability.
PIP - Personal Independence Payment can help with extra living costs for those with long-term physical or mental health condition or disability, difficulty doing certain everyday tasks or getting around because of their condition or both.
UC-Health - UC-H element is more money on top of the UC standard allowance for those who cannot work because of a health condition or disability. This extra amount of money is for people who have limited capability for work and work-related activity (LCWRA).
NS ESA – New Style Employment and Support Allowance is a contributory benefit that may help those who have a disability or health condition that affects how much they can work . It provides money to help with living costs for those unable to work and support to get back into work for those who are able to.
IR ESA – Income Related Employment and Support Allowance may help those who have a disability or health condition that affects how much they can work. It provides money to help with living costs for those unable to work and support to get back into work for those who are able to. It is currently closed to new claims and is being replaced with UC Health.
SDA – Severe Disablement Allowance is being replaced with ESA and is closed to new claims.
IB - Incapacity Benefit has been replaced with ESA and is closed to new claims.
21.3 Methodology
The participation outcomes tracked individuals in England first claiming a health and disability benefit aged 16 to 24 between April 2018 and March 2024.
The employment outcomes for health and disability benefit claimants cover Great Britain.
The PIP employment rates are employment rates between April 2018 and March 2024 for individuals aged 18 to 24 in the 2018 to 2019 tax year who claimed PIP before March 2019 and continued to claim through to March 2024. These are compared with employment rates for the general population aged 18 to 24 in 2018 to 2019. These are derived from matching PIP administration data to RAPID.
21.4 Key assumptions and caveats
Participation outcomes:
- Claimants were aged 16 to 24 when they were first awarded PIP, cDLA, UC Health, IB or ESA
- For claimants aged 16 to 24, education and employment were measured on the anniversaries of their initial award
- Claimants under 16 were awarded cDLA prior to their 16th birthday and may not still be on cDLA on their 16th birthday
- For claimants aged under 16, education and employment were measured on the anniversaries of their 16th birthday
- Awards were made between April 2008 and March 2024
- Employment is a monthly measure and includes self-employment
- Education is an annual measure based on appearing in education feeds in the tax year
- Claimants lived in England for the entirety of their CIS record
Employment outcomes for 20-year-olds claiming health and disability benefits:
- Individuals were aged 20 at any point during calendar year 2014 (for example, born between 2 January 1993 and 31 December 1994)
- Individuals who were in receipt of PIP, ESA or DLA at any time during calendar year 2014
- For claimants whose award began before 1 January 2014, and who turned 20 prior to this date, reference date is assessed as at 1 January 2014
- For those awarded during 2014, reference date is assessed as the age at the month of first award
- For claimants whose award began before 1 January 2014, and who turned 20 after this date, reference date is assessed as at their 20th birthday
- Employment measure: employment is measured monthly, using HMRC RTI records, and includes both employment and self‑employment
PIP employment rates:
- Individuals were aged 18 to 24 at any point during tax year April 2018 to March 2019
- Individuals who were continuously in receipt of PIP from April 2018 up to April 2024
- Data only includes claimants living in regions under DWP policy ownership (England, Wales and Abroad)
- PIP data includes normal rules and special rules for end of life (SREL) claims
- Components may not sum to totals due to rounding. Percentages have been rounded to the nearest percent
- Employment is a monthly measure and includes self-employment
21.5 Findings
21.5.1
Almost half (48%) of people first claiming a health and disability benefit as a young person, are not in education or employment 15 years later. 5 years after first claiming a health and disability benefit over half (53%) are not participating in employment or education and 10 years after claiming half (51%) are not in employment or education.
Participation in employment or education 15 years after first claiming a H&D benefit is lower when age of first claim is 16 to 19, compared to 20 to 24. 54% of people first claiming aged 16 and 55% claiming aged 17 are not in employment or education 15 years later, compared to 45% aged 23 and 46% aged 24. For underlying data, see Table 29.
21.5.2
71% of young people first claiming a health and disability benefit and who go on to receive incapacity and disability benefits, are not in employment or education 15 years later. People not in employment or education that claim only incapacity benefit falls to 35% after 15 years. Around 30% that claim a disability benefit only are not in employment or education 5 to 15 years after first claiming.
Regardless of young people age group when first claimed, those who go on to receive incapacity and disability benefits have very similar participation in employment and education 5 to 15 years later. Young people that claim only incapacity benefit are more likely to not be in employment and education 3 to 15 years later if they first claim aged 16 to 18 than 19 to 24. Those claiming disability benefit only are more likely to not be in employment or education up to 14 years after claiming if aged 19 to 24 when first claiming compared to 16 to 18.
See supplementary Table 30 for related data.
21.5.3
5-year employment and education outcome rates of young people after first claiming a health and disability benefit are getting worse: non-participation rose from 48.9% in 2008 to 59.9% in 2018. For related data, see Table 31.
21.5.4
Only 25% of all PIP claimants aged 24 are in work. For PIP claimants aged 24 who do not receive UC, this increases to 46%. For all young people on PIP, the NEET rate is 37%. PIP claimants who do not receive UC are less likely to be NEET than overall PIP claimants. Find underlying data in supplementary Table 32.
21.5.5
Around 40% health and disability benefit claimants aged 20 in 2014 did not work in their twenties. See supplementary Table 33 for underlying data.
21.5.6
Around 40% of ESA claimants aged 20 in 2014 did not work in their twenties. See supplementary Table 33.
21.5.7
The employment rate for PIP claimants aged 18 to 24 has fallen between 2018 and 2024, while rising for the general population aged 18 to 24 years old, widening the employment rate gap over time. For related data, see supplementary Table 34.
Former Child DLA claimants face persistent barriers to entering and sustaining employment. Even by their late twenties fewer than half are employed, education rates have almost disappeared, and NEET levels remain substantially higher than in the general population. See data Table 35 for underlying data.
22. Benefit outcomes for health and disability benefit claimants aged 16 to 24 years old
22.1 Definitions
cDLA – Child Disability Living Allowance may help with the extra costs of looking after a child who is under 16 and has difficulties walking or needs much more looking after than a child of the same age who does not have a disability.
PIP - Personal Independence Payment can help with extra living costs for those with long-term physical or mental health condition or disability, difficulty doing certain everyday tasks or getting around because of their condition or both.
UC-Health - Universal Credit Health element is more money on top of the UC standard allowance for those who cannot work because of a health condition or disability. This extra amount of money is for people who have limited capability for work and work-related activity (LCWRA).
NS ESA – New Style Employment and Support Allowance is a contributory benefit that may help those who have a disability or health condition that affects how much they can work . It provides money to help with living costs for those unable to work and support to get back into work for those who are able to.
IR ESA – Income Related Employment and Support Allowance may help those who have a disability or health condition that affects how much they can work. It provides money to help with living costs for those unable to work and support to get back into work for those who are able to. It is currently closed to new claims and is being replaced with UC Health.
SDA – Severe Disablement Allowance is being replaced with ESA and is closed to new claims.
IB - Incapacity Benefit is being replaced with ESA and is closed to new claims.
22.2 Health and disability benefit claims by years since first claim
This analysis uses DWP administrative data and DfE data. This analysis tracked individuals in England first claiming a H&D benefit aged 16-24 between April 2008 and March 2024
Benefits included are:
- Incapacity benefits – UC health (LCWRA and LCW), ESA (WRAG and Support Group), IB and SDA
- Disability benefits – DLA and PIP
22.2.1 Assumptions and caveats
Numbers claiming are snapshots after each year of claiming rather than continuous claims.
Claimants lived in England for the entirety of their CIS record.
Initial awards were made between April 2008 and March 2024.
Benefit receipt is at anniversary month of initial award.
Claimants lived in England for the entirety of their CIS record.
Claimants under 16 were awarded DLA prior to their 16th birthday and may not still be on DLA on their 16th birthday.
For claimants aged under 16, benefit receipt was measured on the anniversaries of their 16th birthday.
According to published data, a small number of R16 DLA to PIP claimants are awarded at the end of month but do not appear in the caseload until the following month.
22.2.2 Findings
5 years after first claiming a health and disability benefit aged 16 to 24 over half (54%) are claiming and 44% are claiming after 10 years. 4 out of 10 people claiming a health and disability benefit aged 16 to 24 are claiming 15 years later.
Amongst people first claiming aged 16-24, broadly, the younger you first claim the more likely to you are to be claiming 15 years later.
For example, those first claiming aged 16 (59%) and 17 (52%) are most likely to be claiming after 15 years with people first claiming age 24 the least likely to be claiming 15 years later (35%).
Related data can be found in supplementary Table 36.
22.3 PIP claimants aged 20 in 2015 and still on PIP by completed years since onflow
This analysis uses DWP administrative data. It analysed a cohort of individuals who began claiming PIP between 2013 and 2015 and were aged 20 in 2015, to estimate the proportion remaining on PIP X years after onflow with continuous claims.
22.3.1 Assumptions and caveats
Cohort includes all PIP claimants who onflowed between 2013 and 2015, who were aged 20 in 2015.
Data includes all claims to PIP made under normal rules only.
Data only includes claimants living in regions under DWP policy ownership (England, Wales and Abroad).
Components may not sum to totals due to rounding. Percentages have been rounded to the nearest percent and volumes have been rounded to the nearest 100.
22.3.2 Findings
Around three-quarters people claiming PIP aged 20 claim throughout their 20s. Underlying data can be found in supplementary data Table 37.
22.4 Young people on PIP by completed years since onflow and age
This analysis uses DWP administrative data. This analysis estimates the proportion remaining on PIP X years after onflow with continuous claims by age of start claiming
22.4.1 Assumptions and caveats
Data includes all claims to PIP only made under normal rules.
Data only includes claimants living in regions under DWP policy ownership (England, Wales and Abroad).
Years represent completed, anniversary‑based years since the onflow date. Percentages show the proportion still on the caseload at each duration, based only on claimants who could feasibly have reached that duration.
Age is as of onflow date.
Components may not sum to totals due to rounding. Percentages have been rounded to the nearest percent and volumes have been rounded to the nearest 100.
22.4.2 Findings
People claiming PIP from age 16 (includes people transitioning from Child DLA) are most likely to remain on PIP after 10 years (77%) compared to those claiming aged 17 to 24.
The age 16 cohort retention line is noticeably higher than the other age groups because it includes young people transitioning from Child DLA to PIP.
Rising 16 cases join PIP with different characteristics and higher initial volumes, resulting in a higher retention line over time compared with other age groups.
Among those who started claiming PIP at age 16, around 90% remained on the caseload after 5 years, and 77% after 10 years.
Claimants aged 17 to 19 tend to leave the caseload slightly faster in the early years, whereas those aged 20 to 24 generally show more persistence and remain on the caseload for longer. By around 10 years after onflow, however, the age groups converge, with approximately 72 to 75% of claimants across the age groups still receiving PIP.
Related data can be found in supplementary data Table 38.
22.5 Young people on PIP by completed years since onflow by cohort
This analysis uses DWP administrative data. It estimates the proportion remaining on PIP X years after onflow with continuous claims by cohort year.
22.5.1 Assumptions and caveats
Cohort year is based on the onflow date. Data shows the proportion of each annual onflow cohort who remain on PIP after x completed years. The latest year only goes up to September 2025 to allow one month of confirmation.
Data includes all claims to PIP made under normal rules.
Data only includes claimants living in regions under DWP policy ownership (England, Wales and Abroad).
Age is as of onflow date.
Components may not sum to totals due to rounding. Percentages have been rounded to the nearest percent and volumes have been rounded to the nearest 100.
22.5.2 Findings
Recent claimant cohorts to PIP aged 16 to 24 remain on the caseload for longer than earlier cohorts.
74% claiming PIP in 2013 remained on the caseload after 5 years, compared with 87% claiming in 2019. Underlying data can be found in the supplementary Table 39.
22.6 ESA claimants aged 20 in 2015 claiming an incapacity benefit 10 years later
This analysis uses DWP administrative data. It defines incapacity benefits as including UC-H and ESA. For this analysis, ESA claimants in 2015 were matched onto ESA or UC-H in 2025.
22.6.1 Assumptions and caveats
Cohort includes all ESA claimants who were claiming in 2015 and were aged 20.
Data includes all claims made to ESA, covering contributory ESA, income-related ESA and claims that are credits only.
Data for cover all phases of ESA, including those awaiting a Work Capability Assessment (WCA) and those who had their WCA outcomes established.
Geographical coverage is at GB level.
Components may not sum to totals due to rounding. Percentages have been rounded to the nearest percent and volumes have been rounded to the nearest 100.
22.6.2 Findings
Around two-thirds people claiming ESA aged 20 in 2015 were also claiming an incapacity benefit 10 years later (see supplementary Table 40).
22.7 Young people claiming incapacity benefits by years since onflow, benefit type and age
This analysis uses DWP administrative data. It defines incapacity benefits as including UC-H and ESA. For this analysis, new ESA claimants in 2015 were matched onto ESA or UC-H in the subsequent years after up to 2025.
22.7.1 Assumptions and caveats
Cohort includes all ESA claimants who were claiming in 2015 and were aged 16 to 24.
Data includes all claims made to ESA, covering contributory ESA, income-related ESA and claims that are credits only.
Supplementary Tables 41a and 41b covers post-WCA outcomes only, where claimants were either assigned into Work-Related Activity Group (WRAG) or Support Group (SG).
Data for Table 41c and 41d cover ESA SG claims only.
Geographical coverage is at GB level.
Components may not sum to totals due to rounding. Percentages have been rounded to the nearest percent and volumes have been rounded to the nearest 100.
22.7.2 Findings
Nearly three-quarters (74%) of 16 year olds claiming ESA are claiming 10 years later compared to 64% claiming at age 24. See supplementary Table 41 for related data.
22.8 Young people on incapacity benefits by year since onflow (post-WCA) and onflow year
This analysis uses DWP administrative data. It defined incapacity benefits as including UC-H and ESA.
New claims made to ESA in 2010, 2012, 2014, 2015, 2016, 2018 and 2020 are matched onto ESA, or UC-H from 2018 onwards, in subsequent years following the year in which the new claim was made.
New claims made to UC-H in 2018 and 2020 are matched onto ESA, or UC-H in subsequent years following the year in which the new claim was made.
22.8.1 Assumptions and caveats
Cohort includes all ESA claimants who were claiming in 2010, 2012, 2014, 2015, 2016, 2018 and 2020, aged 16 to 24.
Data includes all claims made to ESA, covering contributory ESA, income-related ESA and claims that are credits only.
Data covers post-Work Capability Assessment (WCA) outcomes only, where claimants were either assigned into Work-Related Activity Group (WRAG) or Support Group (SG).
Geographical coverage is at GB level.
Components may not sum to totals due to rounding. Percentages have been rounded to the nearest percent and volumes have been rounded to the nearest 100.
Trends have been affected by volume of reassessments which fell during and following the pandemic.
22.8.2 Findings
Recent incapacity benefit cohorts are more likely to be on incapacity benefits 5 years later compared to earlier incapacity benefit cohorts. For example, 68% starting an incapacity benefit claim in 2014 were claiming 5 years later, compared to 84% claiming in 2020. For related data, see supplementary Table 42.
22.9 Child DLA claimants moving onto PIP by years after claim and UC claim
This analysis uses DWP administrative data. DLA claimants moving onto PIP were identified by an Age16 reassessment being submitted in 2019.
22.9.1 Methodology
PIP, UC, UC Health, and ESA onflow data were linked using encrypted IDs.
Identified claim start dates from 2019 onwards.
Claims were ordered (first, second, third, fourth) for each individual.
Calculated time gaps between claims and grouped them into years.
Flagged young people newly entering PIP vs those moving from DLA.
Analysed movement between benefits using cross-tabulations.
22.9.2 Assumptions and caveats
Offlows were not calculated so it is unclear if claimants were still claiming PIP when they started claiming UC-H.
22.9.3 Findings
Around two-thirds of Child DLA claimants that move onto PIP claimed UC within 6 years of making a PIP claim. For further data, see Table 43.
23. Wellbeing measures for health and disability benefit claimants aged 16 to 24 years old
23.1 Data source
This analysis uses Family Resources Survey (FRS) linked to DWP administrative data.
The FRS is a continuous household survey conducted by DWP. It collects detailed information on the incomes and circumstances of private households in the UK. The survey covers a broad range of topics, including income, housing tenure, disability, pension participation, and savings and investments. Read more information on the Family Resources Survey here.
23.2 Definitions
‘Long term health or disability benefits’ has been defined as having been on at least one benefit continuously for 5 or more years at the time of survey.
Health and disability benefits include ESA, UC-H and PIP.
23.3 Methodology
FRS data (2019 to 2024) was linked to benefit records using encrypted identification codes.
Those receiving PIP, UC Health, or ESA in September of their survey year were identified and their duration on benefits was calculated.
Long-term claimants were defined as those with 5 or more years continuous claim and their wellbeing outcomes were compared to a working, non-claiming, control group.
Survey weights were applied to ensure results were representative of the population.
The analysis was repeated, controlling for self-reported mental health status.
23.4 Key assumptions and caveats
Due to surveys being completed at multiple times in the year. September has been used as a mid-point in order to link in admin data. This may result in some claimants being missed from the analysis.
23.5 Findings
53% of long-term health and disability benefit claimants scored themselves as 5 or below in life satisfaction while only 11% of those in work scored similarly.
50% of long-term health and disability benefit claimants scored themselves as 6 or above in feeling anxious yesterday while only 20% of those in work scored similarly.
52% of long-term health and disability benefit claimants scored themselves as 5 or below in happiness while only 15% of those in work scored similarly.
47% of long-term health and disability benefit claimants scored themselves as 5 or below in feeling their life is worthwhile while only 8% of those in work scored similarly.
When those with mental health conditions are removed from the analysis, long-term health and disability claimants still have higher anxiety scores and lower wellbeing scores on average than those in work, not claiming health and disability benefits. For underlying data, see supplementary Table 44 and Table 45.
24. Child claims to Disability Living Allowance
24.1 Data source
DWP administrative data and National Benefit Database (NBD), England and Wales, 2015 to 2024.
StatXplore Child DLA to PIP reassessments data tables.
24.2 Definitions
DLAc is Disability Living Allowance Child, for those aged 0 to 15 years.
PIP is Personal Independence Payment.
On-flows refer to claimants who made a DLA claim which was accepted.
Off-flows refer to DLA claimants whose claim has ended and no longer receive the benefit.
ADHD is Attention Deficit/Hyperactivity Disorder and ADD is Attention Deficit Disorder.
24.3 Methodology
DLAc claimants by age: volumes were calculated using the NBD start date to identify those who were under 16 years of age at the time that they flowed on to DLAc.
Health conditions of DLAc claimants: the most common 5 health conditions were identified as those with the highest frequency of cases. The volume of on-flows were calculated using the claim start date and how many cases had the 5 common health conditions as their primary medical condition.
DLAc claimant off-flows: off-flows refer to DLA claimants whose claim has ended and no longer receive the benefit. The percentages are calculated using the full caseload as a denominator. Off-flows have been classed as due to death, if the date of death was prior to the benefit end date, or in the 30 days following the benefit end date.
DLAc claimants turning 16 and outcome type: DLA claimants who were turning 16 were linked to the PIP caseload using encrypted National Insurance numbers. Award rates were compared between DLA and PIP to see if the award had increased, decreased or stayed the same.
DLAc to PIP reassessments with a PIP outcome: the Child DLA to PIP reassessments table on Stat Xplore by month of first clearance was used to get the first outcome. These were summed together to get totals for each year for whether the award increased, decreased, was unchanged or there was no award.
Proportion of those under 25 on the PIP caseload that have previously had a DLAc claim: linked claimants on the PIP caseload with those who were previously on the DLA caseload by encrypted National Insurance numbers. Those who had a date of birth on both the PIP and DLA caseloads had been on both benefits, otherwise they are categorised as only having claimed PIP.
24.4 Key assumptions and caveats
Only those who joined DLA aged 15 or under included. National Benefit Database has been used to identify DLA claim starts.
Primary health condition has been used. It is possible the child may have multiple health conditions.
The most common 5 health conditions have been separated out. ‘Psychiatric disorders of childhood - other / type not known’ will include children with undiagnosed Autism and ADHD, among other conditions.
For DLAc turning 16: only the outcome related to the first PIP registration within 12 months of turning 16 is used. PIP outcomes account for disputes, however, some claimants may not have received the outcome of the dispute, so figures are subject to revision.
For DLAc to PIP reassessments with a PIP outcome: figures only include Child DLA to PIP reassessments who have a PIP outcome, and their first PIP outcome if they have multiple. The claimant may dispute the award or re-apply for PIP. This is not taken into consideration in these figures. Figures are tabulated by year of PIP outcome.
Proportion of those under 25 on the PIP caseload that have previously had a DLAc claim: the PIP under-25 caseload as at June of the specified year has been used. Those who joined DLA under the age of 16 have been identified as receiving DLA child at any point before turning 16, this means they may not have been claiming DLA when they turned 16. National Benefits Database has been used to identify DLA claims, and PIP data used to identify PIP caseload.
24.5 Findings
The majority of those who get Child DLA are awarded it by the age of 8. ‘Psychiatric disorders of childhood - other / type not known’ has been the most prevalent on-flow condition over time with volumes rising rapidly since 2020.
In 2024 to 2025, less than 1% of the DLAc under 16 caseload flowed off the benefit. An even smaller proportion off-flow due to death.
The proportion moving through the benefits system from Child DLA as a child to PIP as an adult is rising. Around 8 in 10 Child DLA claimants who apply for PIP are successful.
The proportion of the PIP caseload aged under 25 that has claimed DLA child previously, has decreased slightly over the past 5 years. For underlying data, see supplementary Tables 46 to 51.
25. Disability benefits receipt by age and main reported condition
25.1 Data source
Stat Xplore and ONS Population Estimates.
DWP administrative data.
25.2 Definitions
Disability Benefits is defined as the total of PIP and DLA.
Categories included in analysis were created from various levels of ‘Disability’, ‘Disability Sub-Group’ and ‘Disability Category’, after discussions with DWP Clinicians. This bespoke categorisation can all be built up from Stat-Xplore, but this analysis has been done using DWP administrative data.
For a very small proportion of the caseload, the combination of award rates (daily living and mobility) is reported as nil-nil. Investigations suggest that award rates may be temporarily shown as a nil rate in the data used to derive the statistics for a short period, whilst a claim review is in process, after which the new award rate is set. These cases should be treated with caution and may be revised in a subsequent release.
25.3 Methodology
DLA and PIP caseloads at different points in time have been compared to population estimates at the time, to derive an estimate of the prevalence of claiming these disability benefits in the population.
Figures that have been split by the main medical condition categories, as agreed with DWP Clinicians, have also been tracked over time to analyse how they have changed.
PIP caseloads split by age and main reported condition in April 2025 have been split by a claimants’ primary medical condition, and their age at April 2025.
PIP caseloads by age and rate received in April 2025 have been split by a claimants’ PIP award, and their age at April 2025.
25.4 Assumption and caveats
Analysis only up to 2024 is complete.
Data only includes claimants living in regions under DWP policy ownership (England, Wales and abroad).
Components may not sum to totals due to rounding.
25.5 Findings
The prevalence of disability benefit receipt has increased for all ages and genders, but more in the 5 years between 2019 and 2024 than in the preceding 10 years.
Mental health conditions and autism have increased significantly over the period, in contrast to the 2 main musculoskeletal conditions.
PIP claimants aged under 25 have notably different conditions associated with their claim when compared to the over 25s.
At least 94% of claimants at all ages receive the daily living component, whereas only 75% of claimants in their late 30s receive the mobility component.
For underlying data, see supplementary Tables 52 to 55.
26. Universal Credit survey
26.1 Data source
This analysis uses data from the Universal Credit survey 2025, a large-scale quantitative survey commissioned by DWP and delivered by Ipsos, which will be published in due course. The survey collected responses from 9,658 UC customers across Great Britain and is designed to be representative of the UC caseload. The survey explored UC customers’ knowledge of UC, their experience of claiming UC, their attitudes and barriers to work, and their perceptions of support from the Jobcentre Plus.
Findings reported here focus on respondents who were not in work at the time of the survey and had recent contact with a Work Coach.
26.2 Definitions
Work Coach support – assistance provided by Jobcentre Plus Work Coaches, including job search support, CV advice, and guidance on moving into work.
Felt supported – respondents who reported that their Work Coach helped them prepare for work or move into employment.
Intensive Work Search – UC claimants with no earnings or with earnings below the Average Earnings Threshold are placed into the Intensive Work Search regime. They are required to carry out work-related activities usually including regular meetings with Work Coaches to continue receiving UC.
26.3 Methodology
The analysis is based on descriptive statistics from the UC survey. Responses were collected via online and telephone interviews to ensure coverage of different customer groups. Findings are reported for subgroups based on age and employment status. Comparisons are made between under 25s and those aged 25 to 49.
Where percentages are compared, these represent statistically significant differences in the proportion of respondents reporting positive support experiences.
26.4 Assumption and caveats
The analysis is based on self-reported perceptions of support and does not directly measure employment outcomes.
The survey identifies associations only and cannot establish causality between Work Coach support and movement into work.
Findings relate only to those who had recent contact with a Work Coach and may not reflect the experiences of all UC customers.
Differences between groups may be influenced by underlying characteristics (for example, health conditions, labour market attachment), not solely age.
26.5 Findings
69% of under 25 year olds on UC who were not working and had recently been supported by a Work Coach felt supported by their work coach to prepare for work or move into employment (compared to 54% for 25 to 49 year olds).
27. Outstanding UC WCA Reassessments
27.1 Data source
DWP Administrative Data.
27.2 Definitions
An outstanding Universal Credit (UC) Work Capability Assessment (WCA) reassessment is defined as a UC WCA decision that has surpassed the recorded review period for that decision.
27.3 Methodology
A review period, or ‘prognosis period’, is recorded on DWP administrative systems alongside the WCA decision. This indicates the date after which the WCA decision should be reviewed and considered for reassessment. The total number of outstanding UC WCA reassessments is therefore determined by counting the number of live WCA decisions that have passed the end of their prognosis period at the point in time used for the calculation.
27.4 Key assumptions and caveats
Administrative data is based on dates that are manually inputted by Decision Makers.
Claimants with no recorded prognosis period, for example those deemed to have severe lifelong conditions, are excluded.
27.5 Findings
“Today, outstanding WCA reassessments stand at nearly 2 million”. This figure refers to the outstanding UC WCA reassessments as of December 2025.
28. Data sources
The following data sources have been used frequently throughout the Young People and Work Interim Report. The sources used in this report are not limited to the below. These sources are as follows.
The Annual Population Survey
The Annual Population Survey (APS) is a continuous household survey, covering the UK. The APS is produced by Office for National Statistics (ONS). It is not a stand-alone survey; it uses data combined from 2 waves of the main LFS alongside a local sample boost. The APS is a recommended source for employment, unemployment and economic inactivity statistics for smaller groups of the population. APS estimates are also currently being published as official statistics in development until further review due to the ongoing issues with the LFS.
The 2 year longitudinal APS has been used to examine movements between labour market states (employment, unemployment and economic inactivity). Everyone in the data is interviewed at 2 time points, 1 year apart, so does not capture any movements before or after this annual period, or any short-term moves that may have been reversed between the 2 snapshot interviews.
Labour Force Survey
The Labour Force Survey (LFS) is used for this analysis. The LFS - conducted by the ONS - is a large, representative household study and provides detailed information related to the UK population’s activity in the labour market. The LFS is the basis of the headline labour market statistics produced by ONS.
Ongoing challenges relating to response rates and weighting mean the LFS is considered official statistics in development until further notice. Increased volatility in the estimates mean changes over time should be treated with additional caution.
Read more information on the LFS and APS here.
29. Defining those not in education, employment or training
The definition of those not in education, employment or training may differ depending on the source(s) that are used in analysis.
Analysis using the APS and LFS uses the following definition as defined by the ONS.
Not in education, employment or training - young people (aged 16 to 24) who are NEET.
People are considered to be in education or training if they:
- are enrolled on an education course and are still attending or waiting for term to start or restart
- are doing an apprenticeship
- are on a government-supported employment or training programme
- are working or studying towards an educational qualification
- have had job-related training or education in the last 4 weeks
Anybody who is not in any of the forms of education or training previously listed and not in employment is considered to be NEET. As a result, a person identified as NEET will always be either unemployed or economically inactive.
Statement of Compliance with the Code of Practice for Statistics
The Code of Practice for Statistics (the Code) is built around 3 main concepts, or pillars:
- trustworthiness – is about having confidence in the people and organisations that publish statistics
- quality – is about using data and methods that produce statistics
- value – is about publishing statistics that support society’s needs
Contact information
For media enquiries contact the DWP Press Office.