Workless households and educational attainment statutory indicators 2021
Updated 19 April 2021

© Crown copyright 2021
This publication is licensed under the terms of the Open Government Licence v3.0 except where otherwise stated. To view this licence, visit nationalarchives.gov.uk/doc/open-government-licence/version/3 or write to the Information Policy Team, The National Archives, Kew, London TW9 4DU, or email: psi@nationalarchives.gov.uk.
Where we have identified any third party copyright information you will need to obtain permission from the copyright holders concerned.
This publication is available at https://www.gov.uk/government/publications/workless-households-and-educational-attainment-statutory-indicators-2021/workless-households-and-educational-attainment-statutory-indicators-2021
Presented to Parliament pursuant to Section A1A of the Life Chances Act 2010 as amended.
Workless households and educational attainment statutory indicators
The Welfare Reform and Work Act 2016 reformed the Child Poverty Act 2010 and placed a statutory duty on the Secretary of State to publish and lay before Parliament a report containing data on:
- children living in workless households in England
- children living in long-term workless households in England
- the educational attainment of children in England at the end of Key Stage 4
- the educational attainment of disadvantaged children in England at the end of Key Stage 4
The data contained in the report, and the provision about how the terms used in it are to be interpreted, must, so far as practical, be derived from any relevant official statistics.
Find further details in the Child Poverty Act 2010.
Definition of key terms
The Child Poverty Act 2010 amended by the Welfare Reform and Work Act 2016 specified that the statutory report must set out how the Secretary of State has interpreted the following terms:
1. Child
a. for the workless households measures: people aged 0 to 15 years (that is, those who have not yet reached their 16th birthday)[footnote 1]
b. for the educational attainment measures: pupils in state-funded schools at the end of Key Stage 4, typically those starting the academic year aged 15
2. Household – a single person or a group of people living at the same address who have the address as their only or main residence and either share one main meal a day or living accommodation (or both) and at least one person is aged 16 to 64 years[footnote 2]
3. Worklessness – where all adults aged 16 or over are either economically inactive or unemployed[footnote 2]
4. Long-term Worklessness – where all adults aged 16 or over are either unemployed or economically inactive, and these adults left their last job at least 12 months ago or have never worked (in a paid job)[footnote 1]
5. Educational attainment – the average Attainment 8 score per pupil
6. Disadvantage – pupils who meet any of the following criteria[footnote 3]:
a. they have been eligible for free school meals in the previous six years (from year 6 to year 11 for those at the end of KS4)
b. they have been looked after for at least one day during the year
c. they have ceased to be looked after by a local authority in England or Wales because of:
● adoption
● a special guardianship order
● a child arrangements order
● a residence order
Parental Worklessness
Statutory measure 1: children living in workless households in England
The proportion of children living in workless households in England, 2006 to 2020
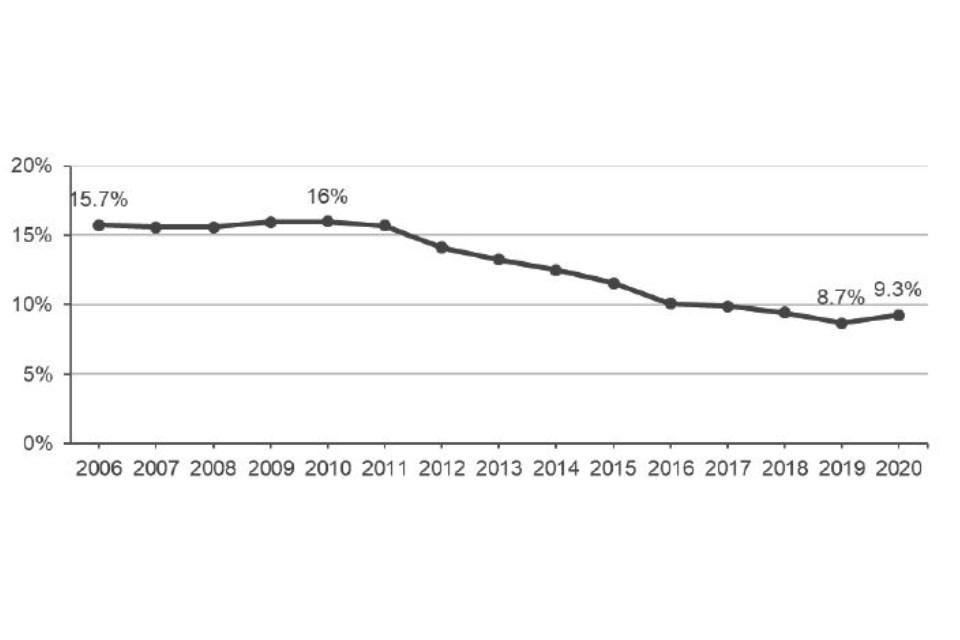
Source: Working and workless households in the UK: October to December 2020
9.3% of all children in England (around 1 million children) were living in workless households in the fourth quarter of 2020.
The ‘Workless Households’ data uses the Labour Force Survey (LFS) and responses are weighted to official population projections. As the current projections are 2018-based they reflect demographic trends that pre-date the Covid-19 pandemic. Thus the rates in the above indicator remains robust; however, levels should be used with caution.
Statutory measure 2: children living in long-term workless households in England
The proportion of children living in long-term workless households in England, 2006 to 2019
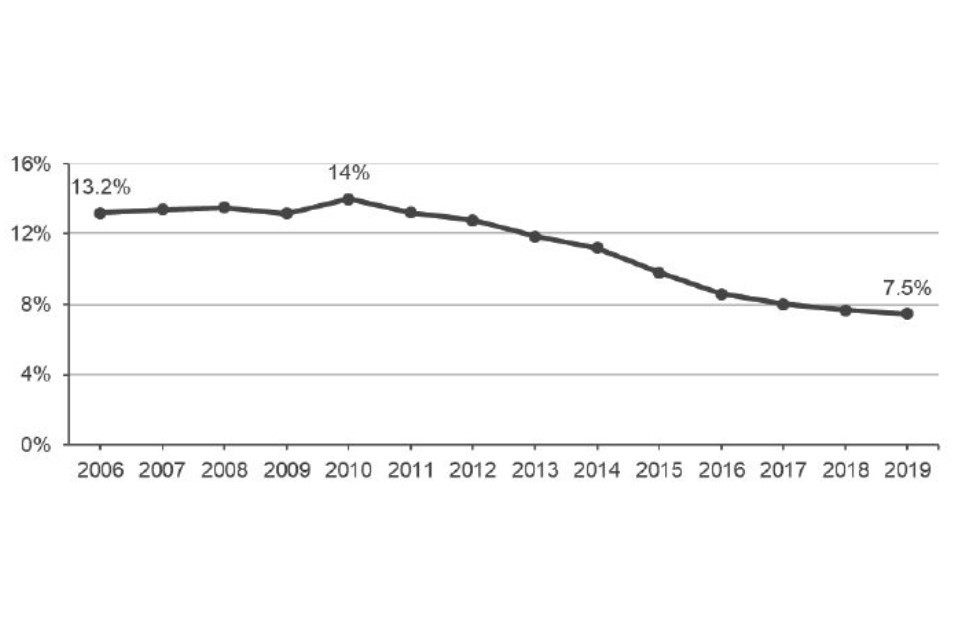
Source: Children living in long term workless households in the UK: 2019
7.5% of all children in England (around 800,000 children) were in long-term workless households in 2019. The measure has continued to decrease since 2010.
Details and methodology
Workless households are households where no one aged 16 years or over is in employment. These members may be unemployed or economically inactive. Economically inactive members may be unavailable to work because of family commitments, retirement, study, sickness or disability.
A long-term workless household is a household where all adults (that is, those aged 16 years and over) are currently economically inactive or unemployed (workless), and these adults left their last job at least 12 months ago or have never worked (in a paid job).
A long-term workless household does not necessarily imply that adults within them have been long-term unemployed. Some adults may have been out of work for 12 months or more, but had periods of inactivity such as looking after family or illness during that time.
Children in workless households
The percentage of children in workless households is derived from the Labour Force Survey (LFS), which samples around 75,000 people each quarter. To avoid seasonal fluctuations in quarter-on-quarter data results from October to December are compared each year.
Further details can be found in the Office for National Statistics (ONS) publication on working and workless households in the UK.
Children in long-term workless households
The percentage of children in long-term workless households is derived from the Annual Population Survey (APS), which samples around 300,000 people per year. The survey combines additional interviews with interviews from the LFS.
Further details can be found in the ONS publication on children in long-term workless households.
Educational attainment
Statutory measures 3 and 4: the educational attainment of children and disadvantaged children in England at the end of Key Stage 4
The average attainment 8 score per pupil in state-funded schools in England, 2016 to 2020
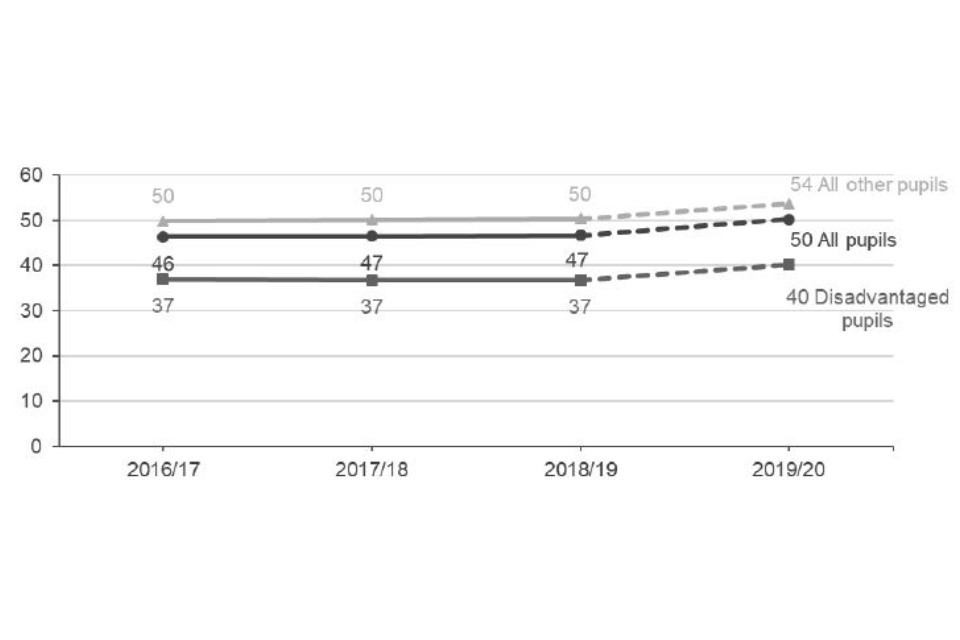
Source: Key stage 4 performance 2020
In 2019/20, the average attainment 8 score per pupil was 50. This has increased by 3 from the previous year.
The average attainment 8 score for disadvantaged pupils in state-funded schools was 37 since 2016, it has increased to 40 for 2019/20.
Due to the Covid-19 pandemic, pupils scheduled to sit GCSE level exams in 2020, were awarded the higher grade of either their:
- centre assessment grade (based on what the school or college believed the student would most likely have achieved)
- calculated grade estimated from a model developed by Ofqual
Therefore, the pupil attainment statistics for 2019/20 are unlike previous years. All of the statistics have increased more than would have been expected in a typical year. The increases reflect the change to the way GCSE grades were awarded rather than improvements in pupil performance. Subsequently, the 2019/20 data should not be compared to previous years to measure changes in student performance.
Caution is needed when comparing Attainment 8 scores between 2017 and 2016 as the scores were calculated using different scales to minimise the impact of reforming GCSEs in 2016.
Details and methodology
Attainment 8 measures the average achievement of pupils in up to 8 qualifications. These include:
- English (double weighted if both GCSEs in language and literature are taken)
- Maths (double weighted)
- 3 further qualifications that count in the English Baccalaureate (EBacc)
- 3 further qualifications that can be GCSE qualifications (including EBacc subjects) or any other non-GCSE qualifications on the Department for Education approved list
Each grade a pupil achieves is assigned a point score and then used to calculate their Attainment 8 score.
The data includes pupils in state-funded schools who have reached the end of Key Stage 4 (KS4) in the academic year (they may have obtained qualifications in previous years) and is created from:
- school census records
- qualification entries
- results collected from awarding organisations
KS4 is the legal term for the two years of school education for pupils aged 14 to 16 incorporating GCSEs and other examinations.
Pupils are defined as disadvantaged if they meet any of the following criteria:
- they have been eligible for free school meals in the previous six years (from year 6 to year 11)
- they have been looked after for at least one day during the year
- they have ceased to be looked after by a local authority in England or Wales because of:
- adoption
- a special guardianship order
- a child arrangements order
- a residence order
Further details can be found in the Department for Educations publication on Key Stage 4 multi-academy trust performance.
The disadvantage gap index: the attainment of disadvantaged pupils
The disadvantage gap index summarises the relative attainment gap between disadvantaged pupils and all other pupils. For key stage 4, the index uses the average grades achieved in English and maths GCSEs to rank all pupils in the country and asks whether disadvantaged pupils typically rank lower than non-disadvantaged pupils. A disadvantage gap of zero would indicate that pupils from disadvantaged backgrounds perform as well as pupils from non-disadvantaged backgrounds. The maximum possible gap is 10 (or -10 if disadvantaged pupils perform better than other pupils).
The gap index is more resilient to changes to grading systems and assessment methods. Whilst the absolute differences (in English and maths GCSE grades) may differ between years the gap index measures how disadvantaged pupils compare to non-disadvantage pupils and therefore, offers greater comparability between years.
The disadvantaged attainment gap index for England, 2010 to 2020
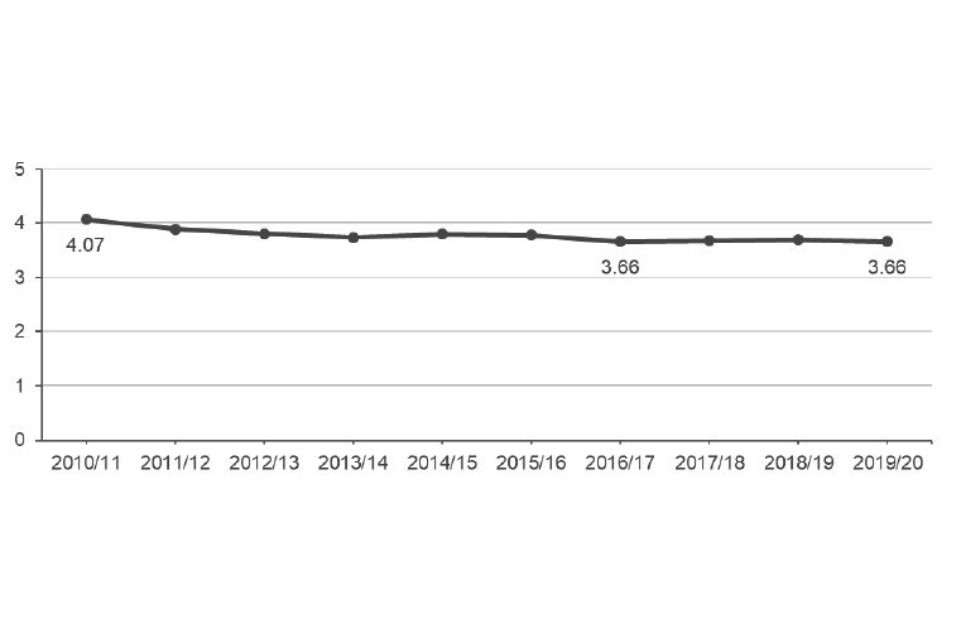
Source: Key Stage 4 performance 2020
There has been little change in the gap index between 2018/19 and 2019/20; it was 3.70 in 2018/19 and is 3.66 in 2019/20. Since 2010/11 the gap has narrowed by 10%.
Details and methodology
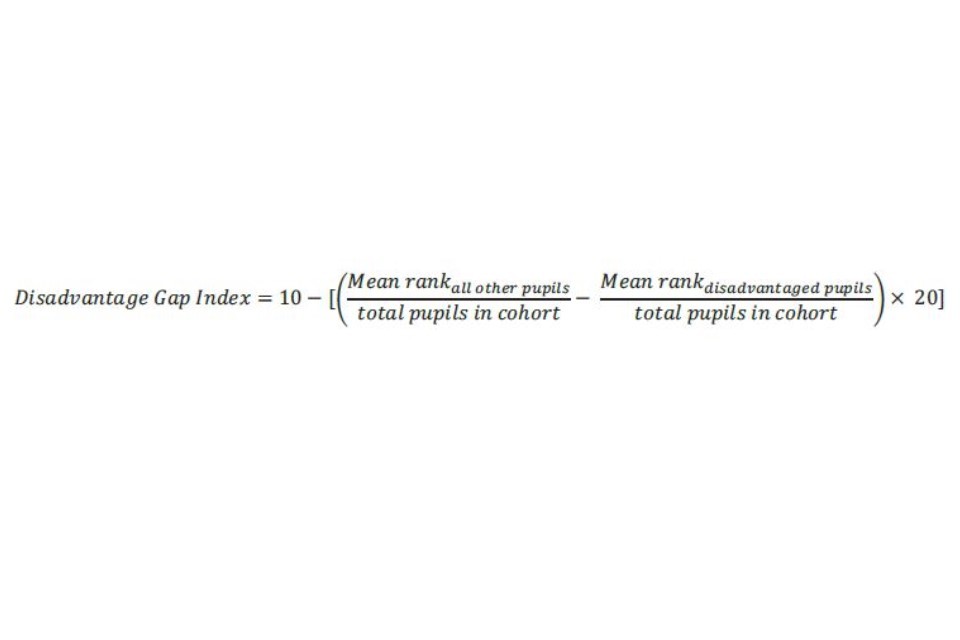
The disadvantage gap index summarises the relative attainment gap between disadvantaged pupils and all other pupils. Because it relies on ranked data and not actual grades, the measure can be calculated in the same way during a period of GCSE reform and enables consistent comparisons over time.
The average scores in English and maths GCSEs for all pupils are ranked and then separated into pupils from disadvantaged backgrounds and all other pupils. The mean of the ranks for the two groups is found and divided by the total number of pupils. These are then subtracted to arrive at a mean rank difference. The mean rank difference ranges between -0.5 (every disadvantaged pupil has higher attainment than all other pupils) and +0.5 (all other pupils have higher attainment than every disadvantaged pupil).
For presentation the mean rank difference is scaled to 10 and expressed in relation to the performance of all other pupils (the comparator). This does not affect the behaviour of the indicator over time but gives the measure a value between 0 and 10 (or -10 if disadvantaged pupils have higher attainment than nondisadvantaged pupils).
The gap index is a supplementary measure used while the GCSE reforms are ongoing. We will review the use of the gap index once more meaningful comparisons over time of the statutory measures are possible.
For further details, see the accompanying methodology for the gap index.
References
Parental Worklessness
Office for National Statistics (2021) Working and workless households in the UK: October to December 2020.
Office for National Statistics (2020) Children living in long-term workless households in the UK: 2019.
Educational attainment
Department for Education (2020) Academic year 2019/20, Key stage 4 performance.
-
This is the ONS definition. Further details can be found in Children living in long-term workless households in the UK: 2019. ↩ ↩2
-
This is the Office for National Statistics (ONS) definition. Further details can be found in Employment and labour market. ↩ ↩2
-
This is definition used by the Department for Education’s. Further details can be found in Key stage 4 performance 2020. ↩