
Waste crime reporting in England: heat maps for 2025
Updated 5 October 2026
Applies to England

© Crown copyright 2026
This publication is licensed under the terms of the Open Government Licence v3.0 except where otherwise stated. To view this licence, visit nationalarchives.gov.uk/doc/open-government-licence/version/3 or write to the Information Policy Team, The National Archives, Kew, London TW9 4DU, or email: psi@nationalarchives.gov.uk.
Where we have identified any third party copyright information you will need to obtain permission from the copyright holders concerned.
This publication is available at https://www.gov.uk/government/publications/waste-crime-reporting-in-england-heat-maps/waste-crime-reporting-in-england-heat-maps-for-2025
1. What the heat maps show
These heat maps show where people are calling from to report waste crime to the Environment Agency. The heat maps show the locations of waste crime reports made:
- across England
- for each Environment Agency operational area
The data covers reports to the Environment Agency’s incident hotline number from 1 January 2025 to 31 December 2025.
All reports made directly to the Environment Agency are shown on the maps. These include:
- duplicated reports, where a single incident or site has been reported more than once
- reports of crime types that the Environment Agency does not deal with directly – for example, reports of small-scale fly-tipping which are passed to the relevant local council
These maps do not show exact locations of waste crime incidents, only the general area where people were when they reported waste crime to the Environment Agency.
2. Waste crime reports across England
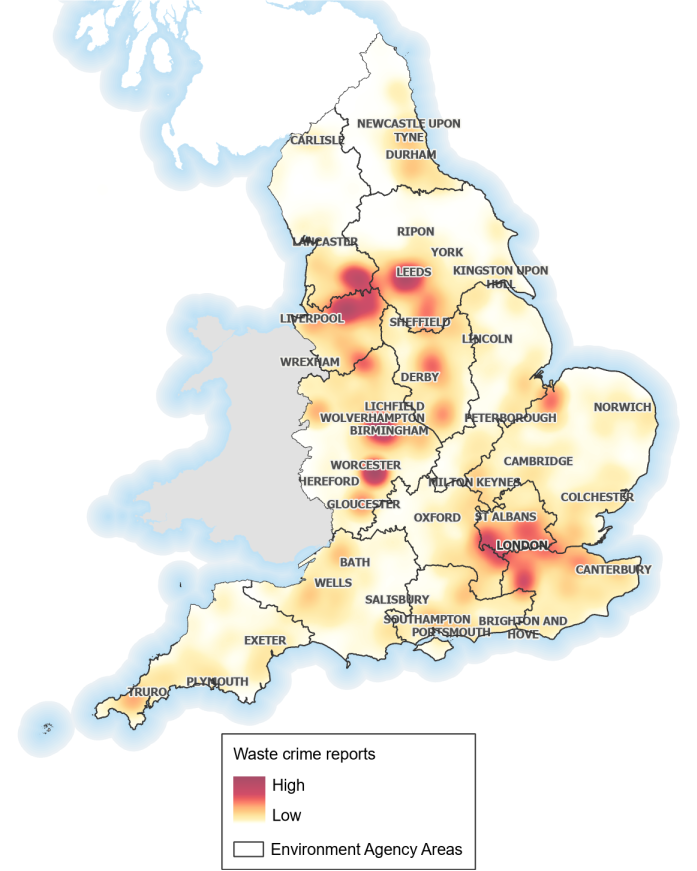
This map shows hot spots for reported waste crime in England. Hot spots can be seen in the Northwest of England in areas such as Leeds, Manchester, and Burnley as well as London, Birmingham, and Worcester areas.
3. Waste crime reports across Environment Agency operational areas
3.1 Cumbria and Lancashire
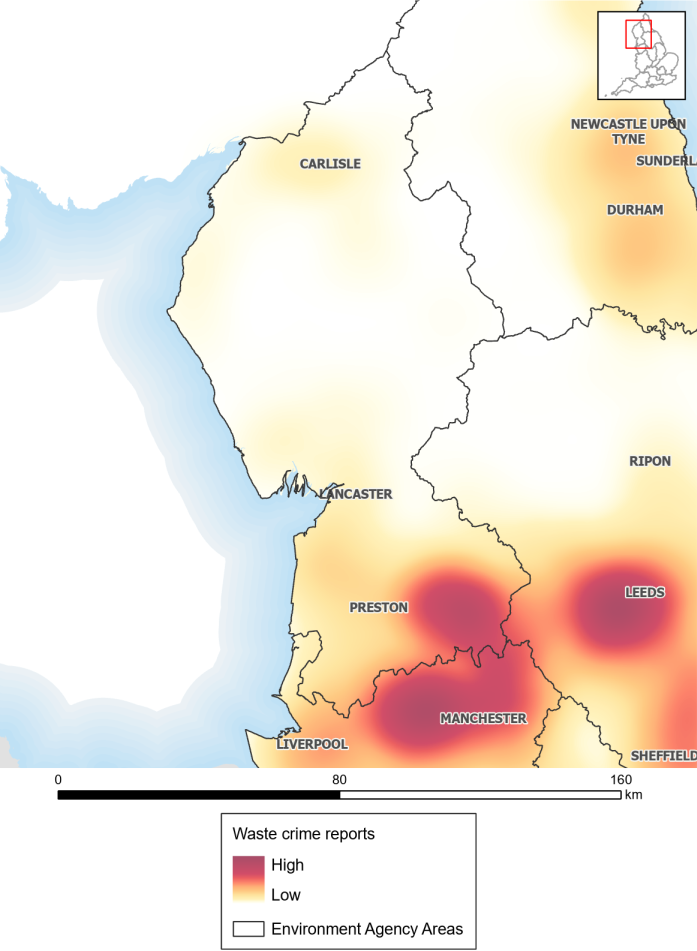
This map shows the hot spots for reported waste crime in the Environment Agency’s operational area of Cumbria and Lancashire and parts of neighbouring operational areas. Hot spots can be seen in Blackburn and Burnley. Areas such as Preston, Blackpool, Lancaster and Carlisle have a much lower report rate.
3.2 Devon, Cornwall and the Isles of Scilly
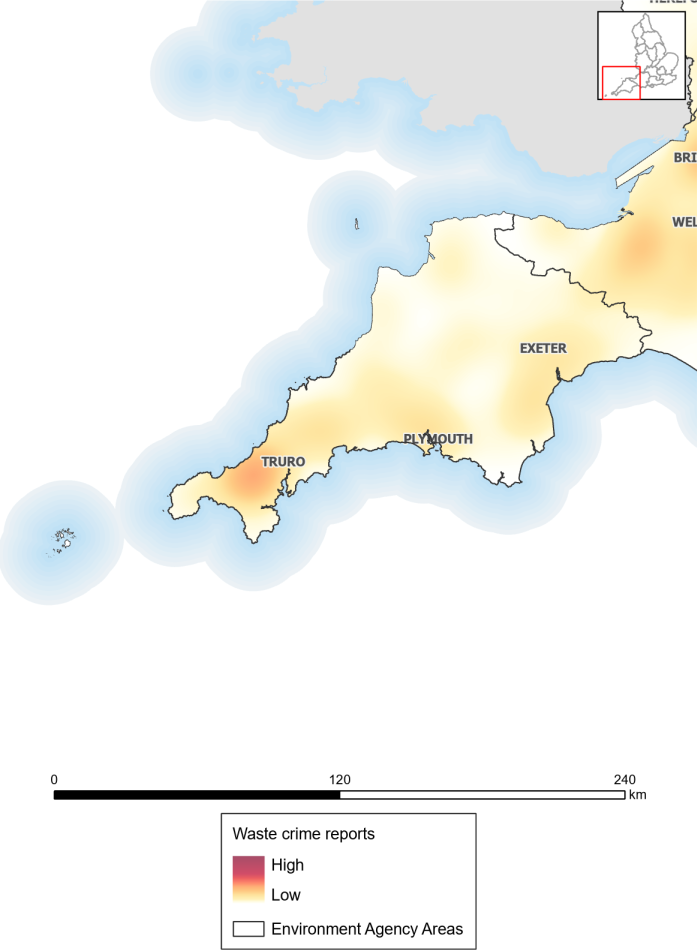
This map shows the level of waste crime reports in the Environment Agency’s operational area of Devon, Cornwall and the Isles of Scilly and parts of neighbouring operational areas. This area is mostly in the lower range of waste crime reports with only a warmer hot spot scale being seen in Camborne and Redruth.
3.3 East Anglia
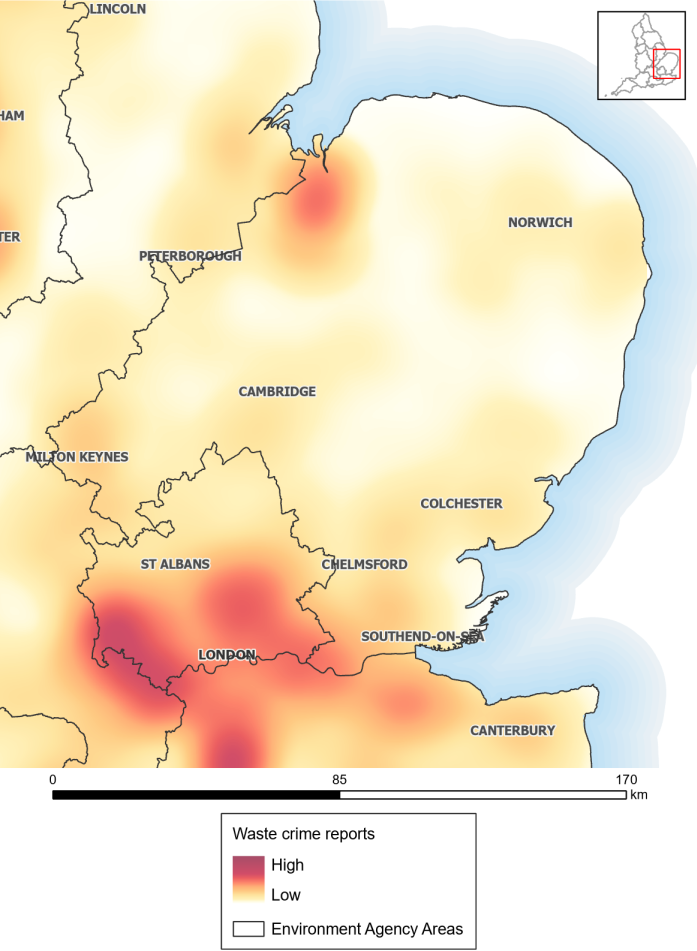
This map shows the hot spots for reported waste crime in the Environment Agency’s operational area of East Anglia and parts of neighbouring operational areas. For East Anglia, waste crime reporting is fairly evenly distributed across the region, but higher rates of waste crime reporting have been seen in North West Norfolk and South Essex.
3.4 East Midlands
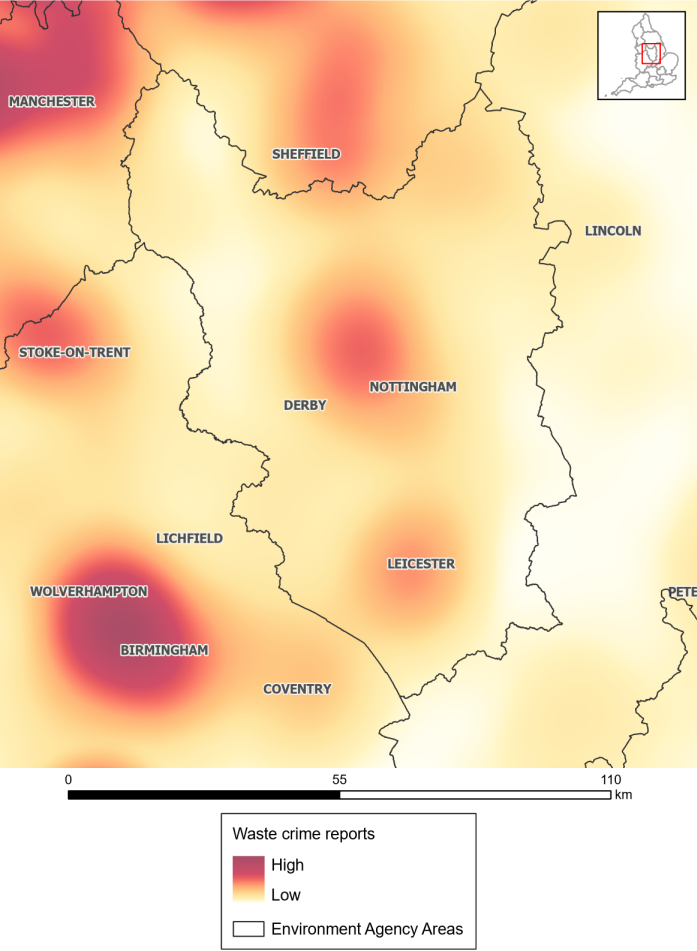
This map shows the level of waste crime reports in the Environment Agency’s operational area of the East Midlands and parts of neighbouring operational areas. Hot spots can be seen in Birmingham, Wolverhampton, and Stourbridge with areas like Stoke-on-Trent, Sheffield, Leicester and Nottingham still having relatively high rates of waste crime being reported.
3.5 Greater Manchester, Merseyside and Cheshire
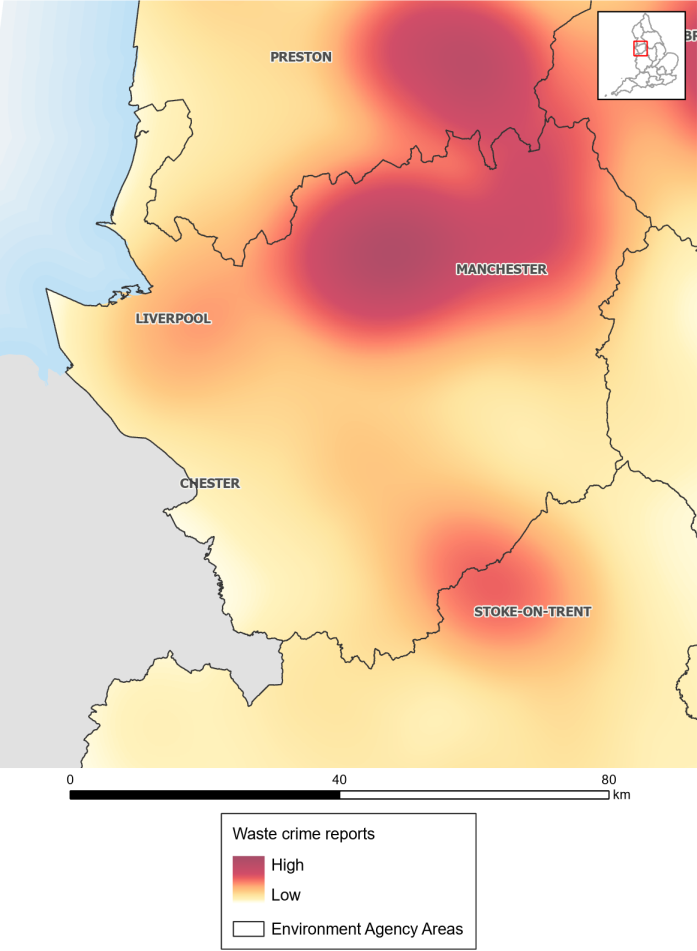
This map shows the hot spots for reported waste crime in the Environment Agency’s operational area of Greater Manchester, Merseyside and Cheshire. High levels of reports were made in Wigan, Bolton, Warrington, St Helens, Manchester, Bury, and Rochdale. Areas surrounding Crewe also have relatively high rates of waste crimes reported.
3.6 Hertfordshire and North London
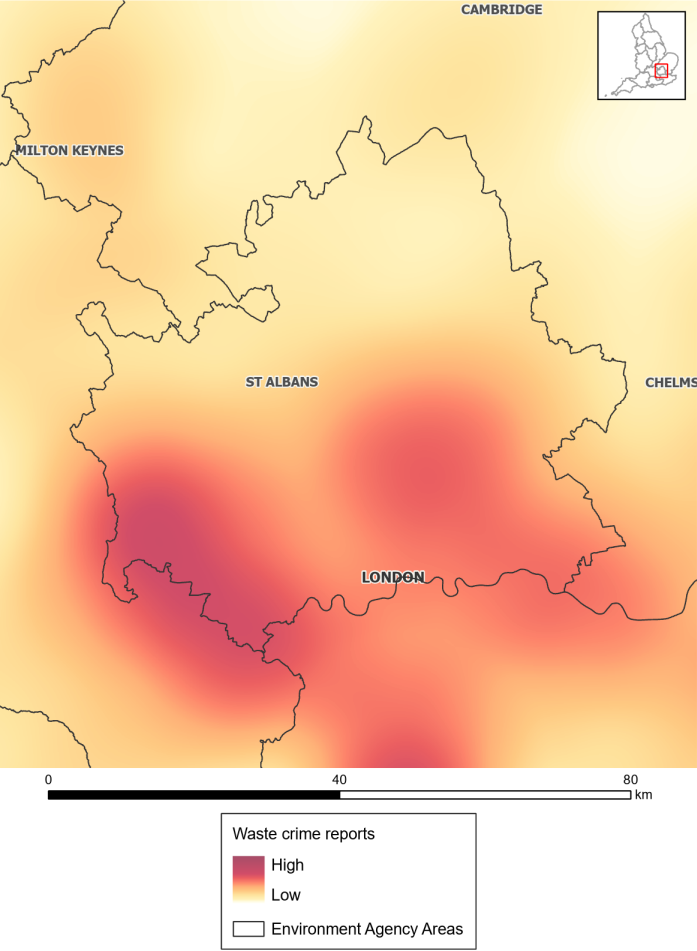
This map shows the hot spots for reported waste crimes in the Environment Agency’s operational area of Hertfordshire and North London and parts of neighbouring operational areas. The highest report rates can be seen in areas around Slough, Uxbridge, Hounslow and Staines-upon-Thames. Areas around Loughton and Waltham Cross can still be seen to have high reports of waste crime.
3.7 Kent, South London and East Sussex
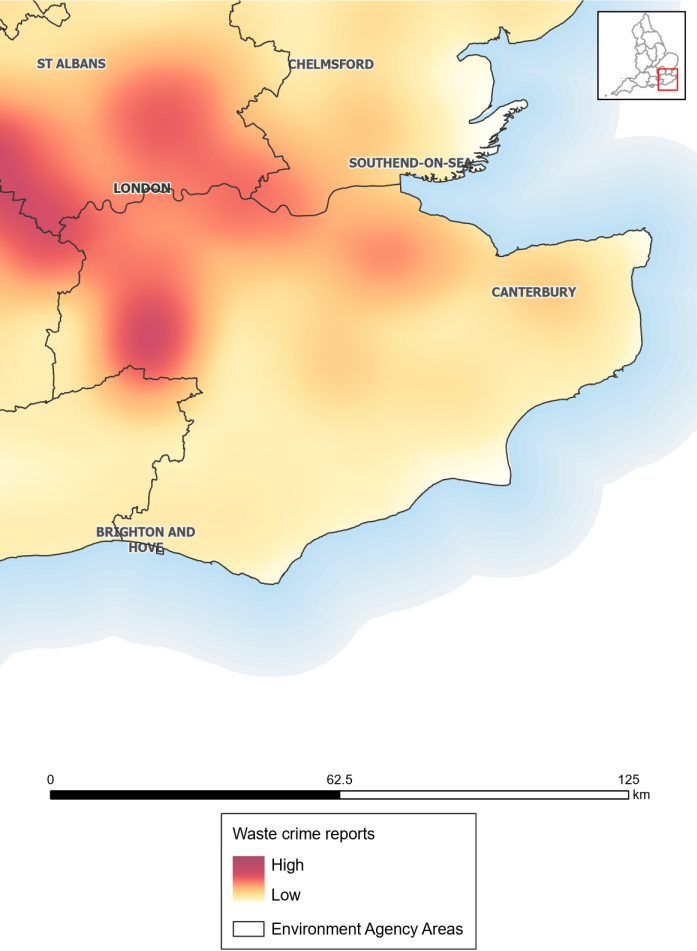
This map shows the hot spots for reported waste crimes in the Environment Agency’s operational area of Kent and South London and parts of neighbouring operational areas. The highest report rates can be seen:
- in areas near the M23 corridor in the west of the operational area on the borders of Surrey and West Sussex
- along the M2 and A2 corridor stretching from South East London through North Kent, Medway and down to Canterbury
3.8 Lincolnshire and Northamptonshire
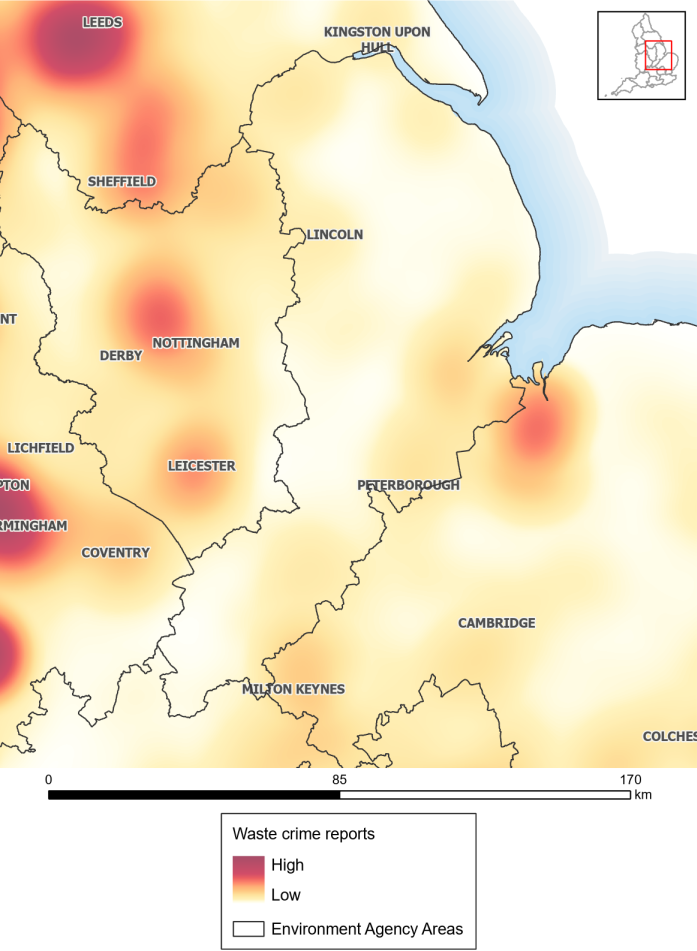
This map shows the level of waste crime reports in the Environment Agency’s operational area of Lincolnshire and Northamptonshire and parts of neighbouring operational areas. Within the Lincolnshire and Northamptonshire area, report levels are generally low to moderate, with relatively higher concentrations seen around Leicester, Nottingham and parts of the Lincolnshire coast.
3.9 North East
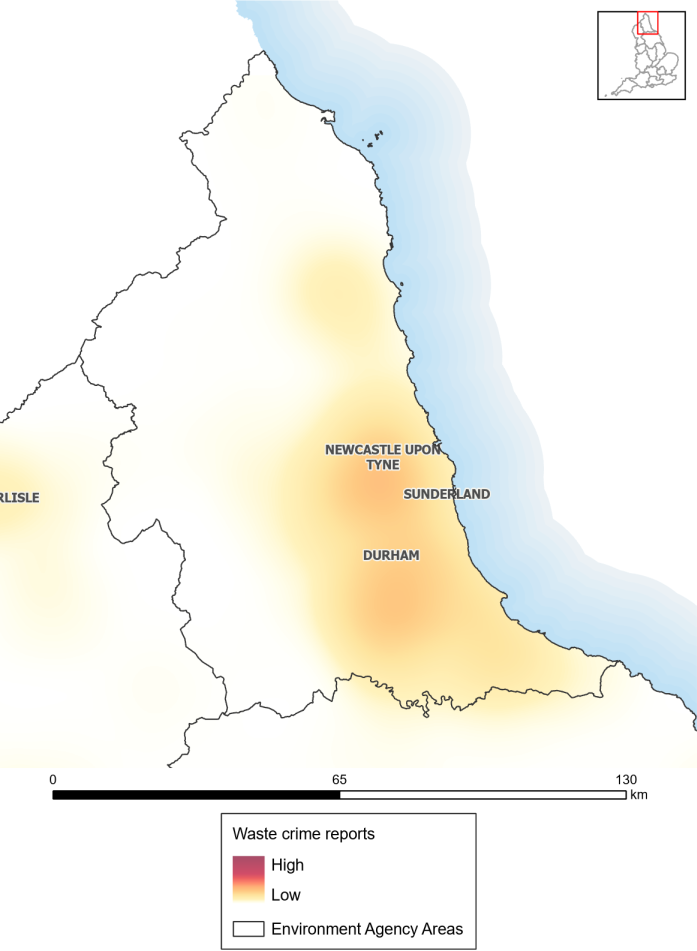
This map shows the level of waste crime reports in the Environment Agency’s operational area of the North East and parts of neighbouring operational areas. This area is mostly in the lower range of waste crime reports with only a warmer hot spot scale being found in Gateshead and south of Durham.
3.10 Solent and South Downs
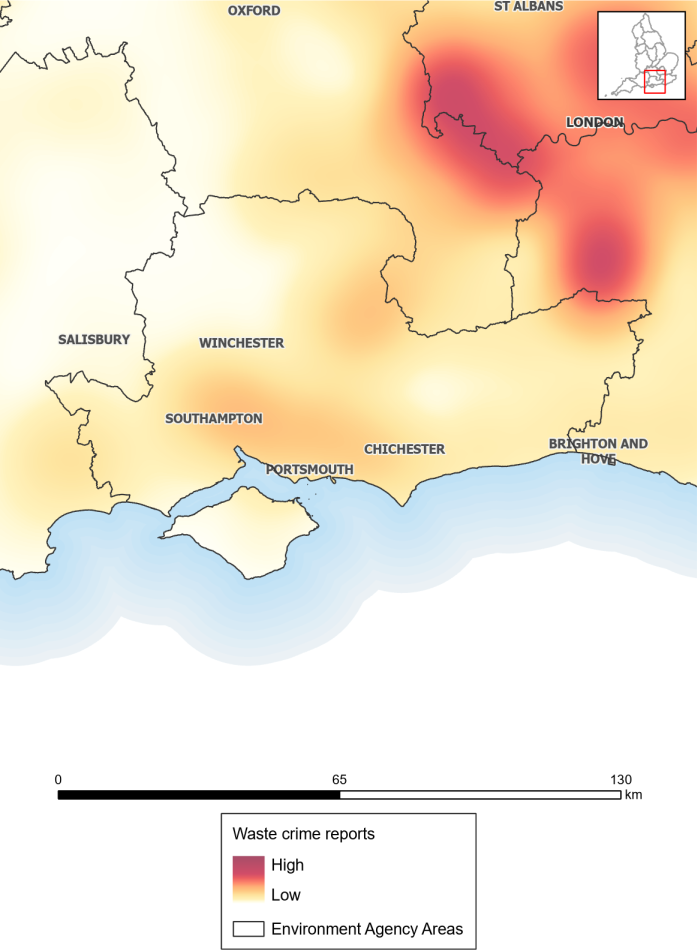
This map shows the hot spots for reported waste crimes in the Environment Agency’s operational area of Solent and South Downs and parts of neighbouring operational areas. The highest rates of waste crimes reported can be seen in Southampton, Chichester and Portsmouth.
3.11 Thames
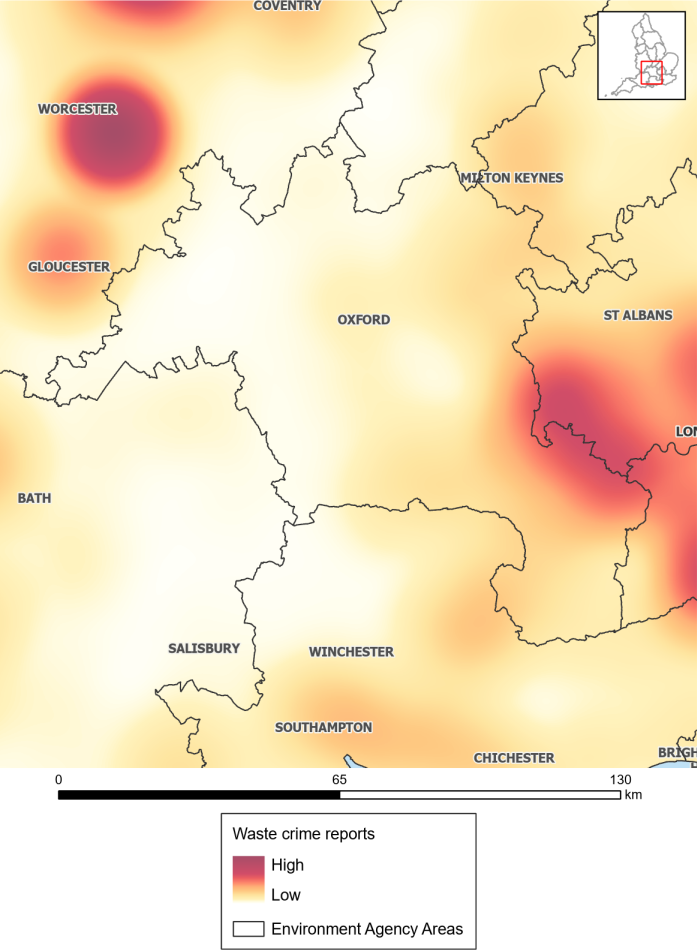
This map shows the hot spots of waste crimes reported in the Environment Agency’s operational area of Thames and parts of neighbouring operational areas. Worcester sees the highest level of waste crimes reported, along with Slough and High Wycombe.
3.12 Wessex
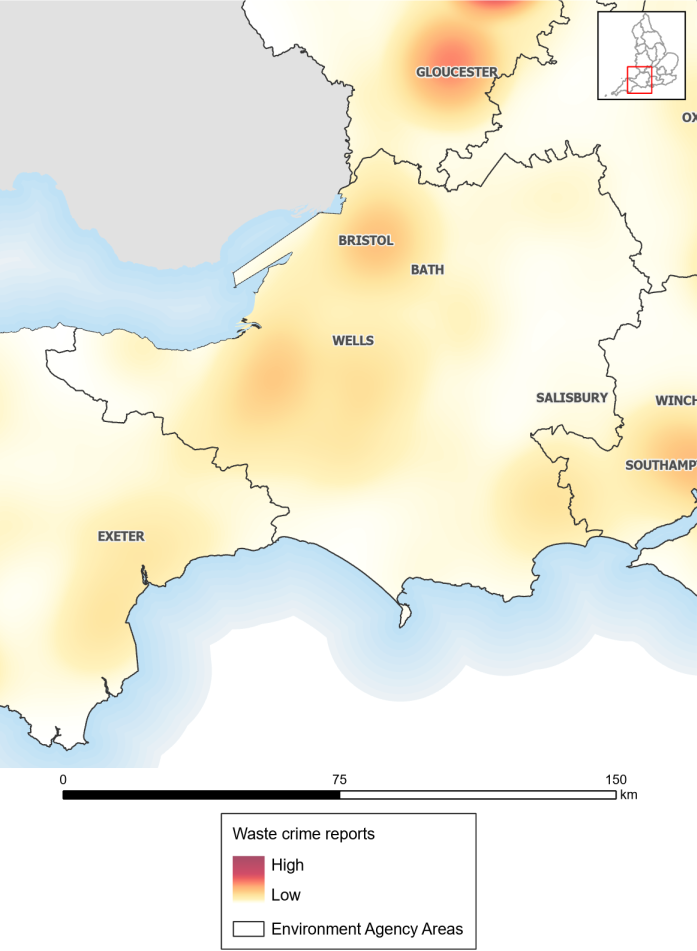
This map shows the level of waste crime reports in the Environment Agency’s operational area of Wessex and parts of neighbouring operational areas. This area is mostly in the lower range of waste crime reports with some higher levels of waste crime reporting in Bristol and areas around Bridgwater and Taunton.
3.13 West Midlands
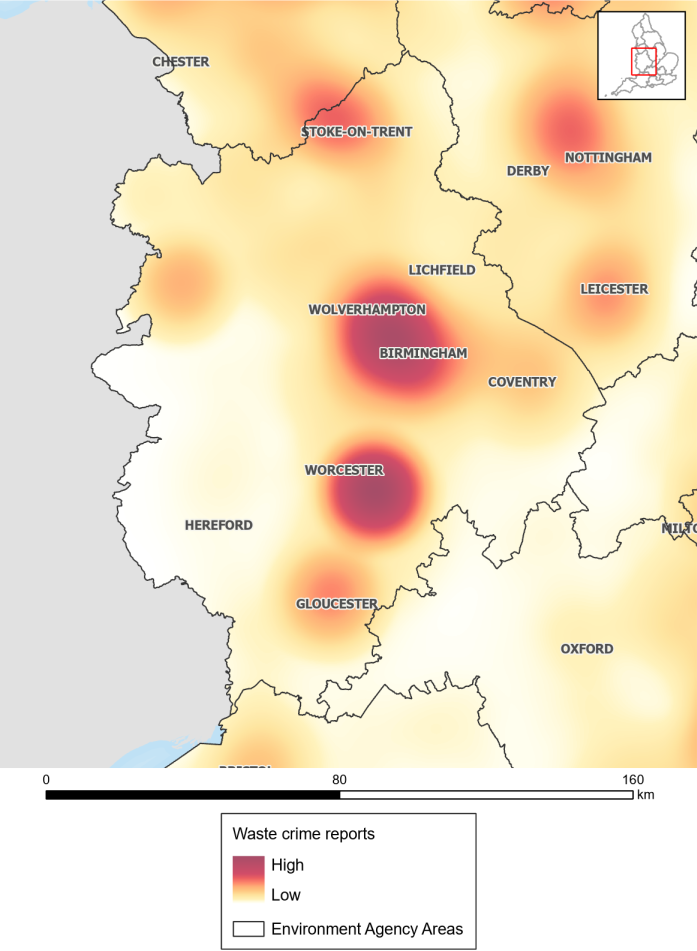
This map shows the hot spots of waste crimes reported in the Environment Agency’s operational area of West Midlands and parts of neighbouring operational areas. The highest levels of waste crimes can be seen to be reported in Wolverhampton, Stourbridge and Worcester.
3.14 Yorkshire
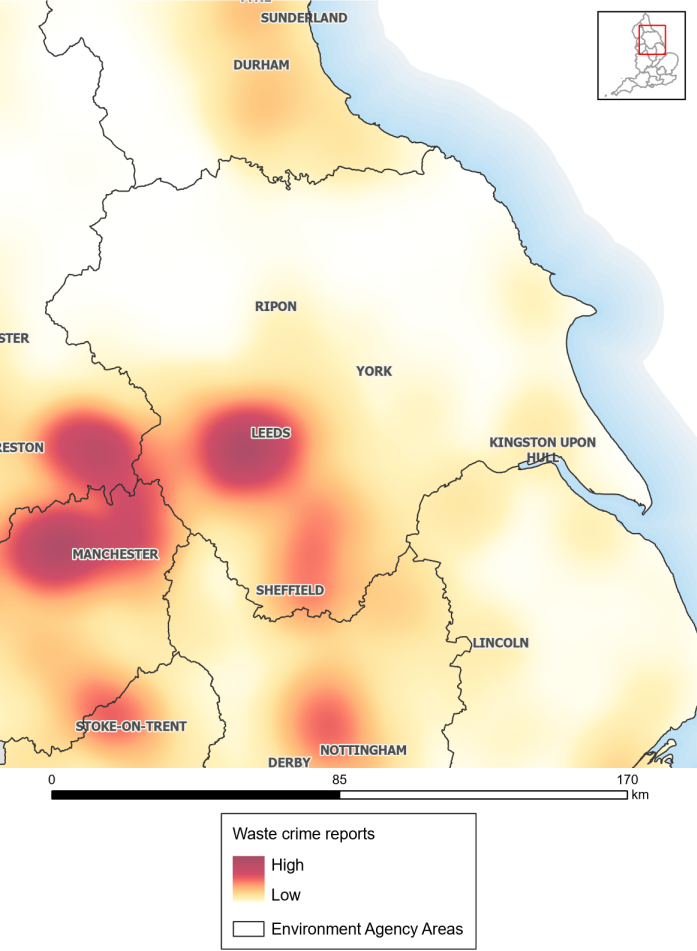
This map shows the hot spots of waste crimes reported in the Environment Agency’s operational area of Yorkshire and parts of neighbouring operational areas. Areas around Leeds, Halifax, Wakefield and Sheffield have the highest levels of waste crimes being reported.
4. If you need to report waste crime
Find out how to report fly-tipping, large-scale dumping or other waste crimes.
5. How government is responding to waste crime
The Waste Crime Action Plan outlines the next steps in government’s response to tackle serious waste crime in England.
The Environment Agency’s 10 Point Action Plan explains the action it is taking.