VOA gender pay report 2023
Published 30 November 2023

© Crown copyright 2023
This publication is licensed under the terms of the Open Government Licence v3.0 except where otherwise stated. To view this licence, visit nationalarchives.gov.uk/doc/open-government-licence/version/3 or write to the Information Policy Team, The National Archives, Kew, London TW9 4DU, or email: psi@nationalarchives.gov.uk.
Where we have identified any third party copyright information you will need to obtain permission from the copyright holders concerned.
This publication is available at https://www.gov.uk/government/publications/voa-gender-pay-gap-report-and-data-2023/voa-gender-pay-report-2023
Introduction
I am pleased to publish our 2023 gender pay gap report. In this report, we set out the progress we are making to reduce our gender pay gap - the difference in salary between all the men and women in our workforce.
This is the seventh year we have published our gender pay results and feels a good time to stand back and look at our progress to date and what we still need to do.
Since we first published our gender pay gap figures in 2017, we have continued to achieve a steady reduction in the overall mean gender pay gap. This year’s figures show a decrease in both the mean and median gaps since last year of 1.4% and 7.0%, respectively. Since the introduction of gender pay gap reporting the current figures represent a decrease in the mean of 6.6% and the median of 13.5%.
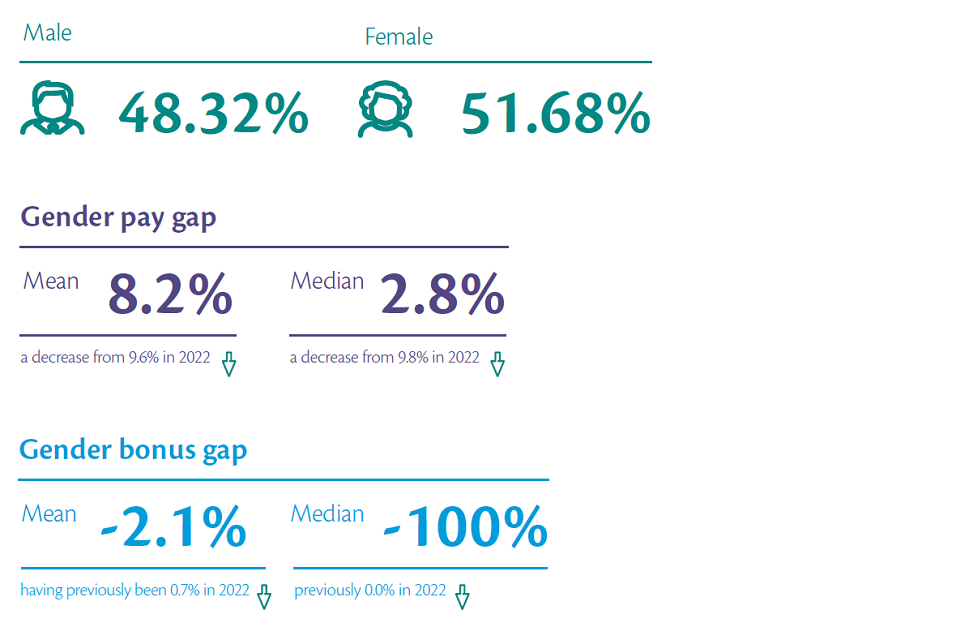
Our headline figures for 2023 are:
- Mean gender pay gap is 8.2%
- Median gender pay gap is 2.8%
- Mean bonus gap is now -2.1%
- Median bonus gap is -100.0%
To help explain what this means, as an example, the 8.2% mean gender pay gap figure shows that overall, women’s average (or mean) hourly salary is 8.2% lower than men’s average salary. The underlying reason for our overall gender pay gap remains the same: we still have a greater proportion of men than women at senior levels. As we improve female representation at senior levels of the organisation, we improve our pay gap.
This year, the proportion of women at HEO and above has increased by 0.7% overall, as more women succeed in gaining positions in more senior grades. Female representation has increased at SEO, Grade 7 and, most markedly, at Grade 6 (up 5.65% on last year). The proportion of women at SCS, however, decreased by 3.73% this year.
For the median bonus gap, we place the value of all bonuses received by women in a line, and the value of all bonuses received by men in a line, from lowest total bonuses received to highest total bonuses received. We then look at the value in the middle of the women’s line and compare it to the value in the middle of the men’s line.
This year, the median for women was 100% higher than the median for men. This means that the male recipient was likely to have received one £20 bonus and the female recipient was likely to have received two £20 bonuses. In previous years, both median figures were £20, which explains how that median bonus gap can leap from 0% to 100% in just one year.
Over the last 12 months, we have continued to support females in the workplace. For example, we have:
- made significant progress in attracting more women to our surveying roles and we compare very favourably to the wider property industry in terms of representation. Women now comprise:
- 41% of our Chartered Surveyors compared to 18% across the profession as a whole; and
- 32% of our Technical Leaders
- continued to work with the Royal Institution of Chartered Surveyors (RICS) to promote the surveying profession to females
- reviewed our recruitment processes to ensure the language used in our trawl notices and the way we attract appeals to all. We monitor recruitment data which shows a positive trend for female applicants throughout the recruitment process
- continued to review and monitor the gender split of our most talented people with the greatest potential to succeed
- initiated a review of our attendance management procedure, including a focus on women’s health. This includes a specific video outlining health conditions affecting women and support available in the workplace
- delivered sessions featuring female speakers specifically to support female colleagues in traditionally male-dominated professions
- raised awareness around the issue of harassment, and encouraged colleagues to report it if they experience it while working. This includes anyone experiencing unacceptable behaviour from customers or work colleagues
- showcased a number of visible female role models to help inspire the next generation. This includes two female colleagues who were nominated for the ‘Inspiring Women in Property Awards’ this year
- proactively used our 9 box grid talent data to ensure female colleagues are being identified for development opportunities
We offer flexible working arrangements to support people’s work life balance. This is a key part of our attraction and retention strategy. We continue to run various talent and development programmes that are open to colleagues at all grades. We proactively encourage participation in female-specific development programmes, such as Crossing Thresholds, as part of our response to addressing gender pay gap differences.
We remain committed to continue our progress in closing the gender pay gap and carry on working in partnership with our colleagues and Trade Unions to tackle the issues arising and to make the agency a great place to work for everyone.
Jonathan Russell CB
CEO, Valuation Office Agency
A message from the Executive Committee Gender Champion
Our work to close the gender pay gap is just one of the ways VOA is making the organisation even more diverse and inclusive. It’s great to see further progress this year. VOA is a public sector leader in creating a great place to work for everyone, and these results represent another step forward.
Carolyn Bartlett
Strategy and Transformation Officer
Overview
In 2017, the government introduced world-leading legislation that made it statutory for organisations with 250 or more employees to report annually on their gender pay gap. Government departments are covered by the Equality Act 2010 (Specific Duties and Public Authorities) Regulations 2017, which came into force on 31 March 2017.
These regulations underpin the Public Sector Equality Duty and require relevant organisations to publish their gender pay gap by 30 March annually. This includes the mean and median gender pay gaps; the mean and median gender bonus gaps; the proportion of men and women who received bonuses; and the proportions of male and female employees in each pay quartile.
The gender pay gap shows the difference in the average pay between all men and women in a workforce. If a workforce has a particularly high gender pay gap, this can indicate there may be a number of issues to deal with, with lower-level calculations helping identify what those issues are.
The gender pay gap is different to equal pay. Equal pay deals with the pay differences between men and women who carry out the same jobs, similar jobs or work of equal value. It is unlawful to pay people differently based on their gender.
Building a diverse and inclusive workforce that reflects the people we serve is one of the Civil Service’s top workforce priorities. Our collective aim is to make the Civil Service the UK’s most inclusive employer. Our Diversity and Inclusion Strategy outlines how we plan to achieve this. The Civil Service should create opportunities for all in a truly meritocratic way and reward all civil servants fairly, regardless of gender, ethnicity, or any other personal characteristic.
The VOA supports the fair treatment and reward of all employees irrespective of gender.
VOA Gender Pay Gap Report 2023
Headline figures
This report gives the gender pay gap data in the VOA as at 31 March 2023.
Note: a negative figure denotes instances where the mean or median hourly salary for women is higher than for men. The ideal position is 0.00%.
Our gender pay gap for 2023 is:
- Mean gender pay gap is 8.2%, a decrease from 9.6% in 2022
- Median gender pay gap is 2.8%, a decrease from 9.8% in 2022
- Mean bonus gap is now -2.1%, having previously been 0.7% in 2022
- Median bonus gap is -100%, previously 0.0% in 2022
Methodology
For salaries, we used a snapshot date of 31 March 2023. The relevant pay period was our March payroll.
For bonuses, we used the period 1 April 2022 to 31 March 2023: the 12 months before the snapshot date.
The gender pay gap data supplied is correct for all staff in post and on the VOA payroll on 31 March 2023. The results are below at Annex A.
In the VOA, on 31 March 2023 there were 3,988 staff in post, an increase of 127 from last year.
Our gender balance has continued to increase slightly in favour of women as follows:
- Women: 2,061 (comprising 51.68% of the Agency, having previously been 51.59%), an increase of 69 women from last year
- Men: 1,927 (comprising 48.32%, having previously been 48.41%), an increase of 58 men from last year
The VOA follows the standard public sector approach to pay and grading. All posts sit within one of nine levels (grades) (VOA no longer has any roles graded at AA), and each level has an associated pay range consisting of a minimum and maximum rate. Salaries are paid according to grade and annual pay awards within the grade are paid irrespective of gender. At the date of this report there remain 45 employees who opted to remain on legacy pay bands from previous grading arrangements that applied until July 2013.
Our headquarters are in East London, and we have offices right across the UK. All grades, apart from those at SCS2 and SCS3 level within the Senior Civil Service (SCS), have both a London and National pay range.
For pay purposes we are governed by public sector pay policy, for which HM Treasury has overall responsibility. This defines the overall parameters for Civil Service pay uplifts each year in the pay guidance, to ensure that Civil Service pay awards are consistent with the government’s overall objectives.
Our 2022 pay award comprised a consolidated award paid to all staff, subject to performance, together with a non-consolidated underpin payment.
- For staff in grades AO to Grade 6, bonus payments are made in the form of in-year cash bonuses to recognise commendable performance
- For members of the SCS there is also a non-consolidated award linked to exceptional performance against objectives
The value of both consolidated and non-consolidated pay awards is negotiated with our recognised trade unions and is subject to HM Treasury and ministerial business case approval. We do not negotiate individual awards, and our pay system takes no account of gender or any other protected characteristic.
Gender pay gap data - base pay
Our gender pay gap data for 2023 is:
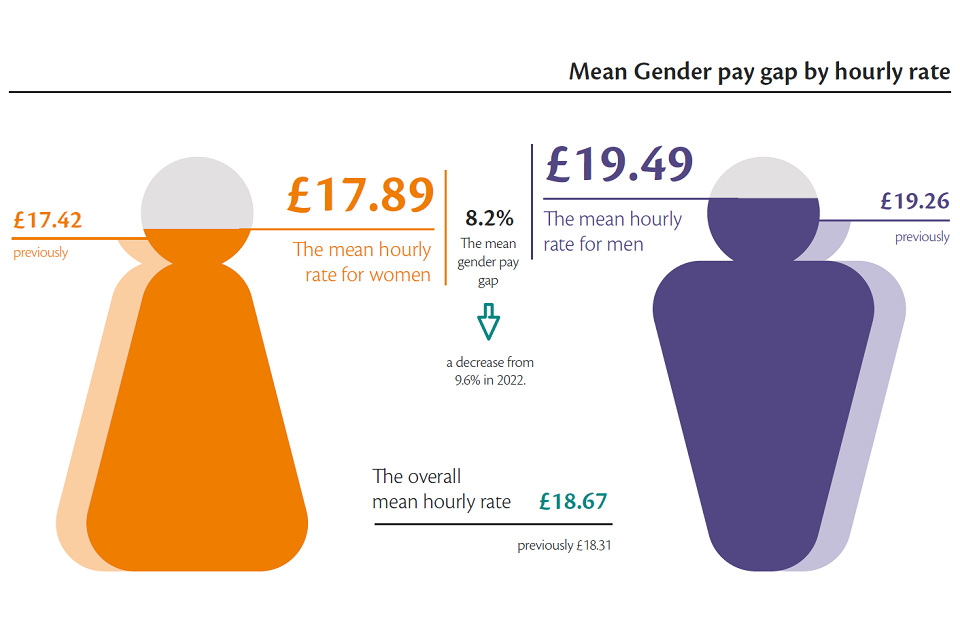
- The mean hourly rate for women is £17.89 (previously £17.42)
- The mean hourly rate for men is £19.49 (previously £19.26)
- The overall mean hourly rate is £18.67 (previously £18.31)
- The mean gender pay gap is 8.2%, a decrease from 9.6% in 2022
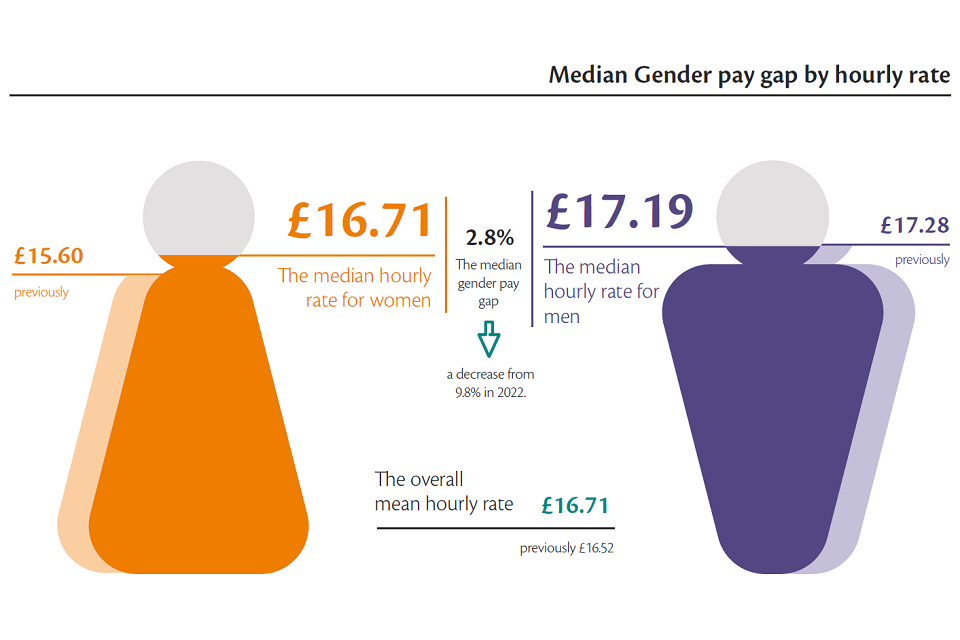
- The median hourly rate for women is £16.71 (previously £15.60)
- The median hourly rate for men is £17.19 (previously £17.28)
- The overall median hourly rate is £16.71 (previously £16.52)
- The median gender pay gap is 2.8%, a decrease from 9.8% in 2022.
The distribution of our workforce drives our mean and median figures: whilst we have a very diverse workforce, we do still have a higher proportion of our female workforce in the lower pay grades. The gender mix of our Executive Committee on 31 March 2023 was four men and two women (including two women job-sharing one Executive Committee post).
As can be seen at Annex A, while women still have a disproportionately higher representation in more junior grades AO and EO, where 58.32% of all employees in these grades were women, this has seen a decrease of 0.3% from last year.
In more senior grades, men continue to have a disproportionately higher representation (45.75% of those at HEO and above are women). The proportion of women in these grades has increased by 0.7%, as more women succeed in gaining positions in senior grades. This year has seen increases in female representation in SEO, Grade 7, and most markedly at Grade 6 (up 5.65% on last year). The proportion of women at SCS, however, decreased by 3.73% this year.
This is reflected in the shifts in the lower and top quartiles shown at Annex B, where the proportion of women in quartiles 1 and 2 have decreased by 1.4% and 1.6% respectively since last year, and both quartiles 3 and 4 have seen the proportion of women each increase by 1.4%.
We also analysed our gender pay gap results by geographical area (National and London pay areas - Annex D).
Our recruitment and promotion policies are based on fair and open competition.
We are committed to offering roles on flexible working patterns, including a range of options, such as part-time working, alternative working hours, and enhanced shared parental leave. This includes job-share up to and including posts at Senior Civil Service level. Pay elements used in the calculation include allowances. Voluntary salary sacrifice for childcare vouchers and cycle to work schemes are excluded.
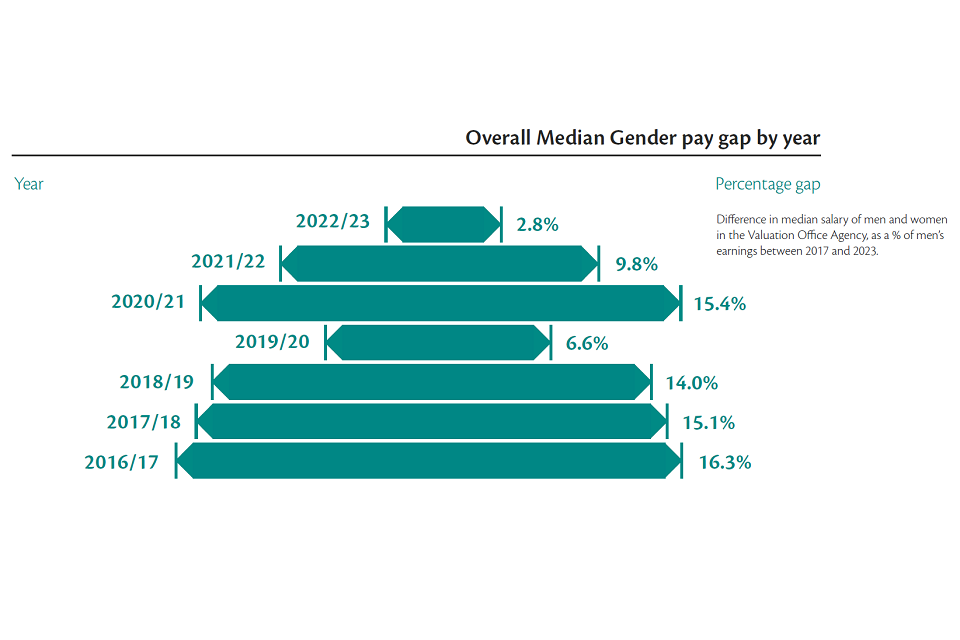
Closing the gender pay gap: Our progress so far
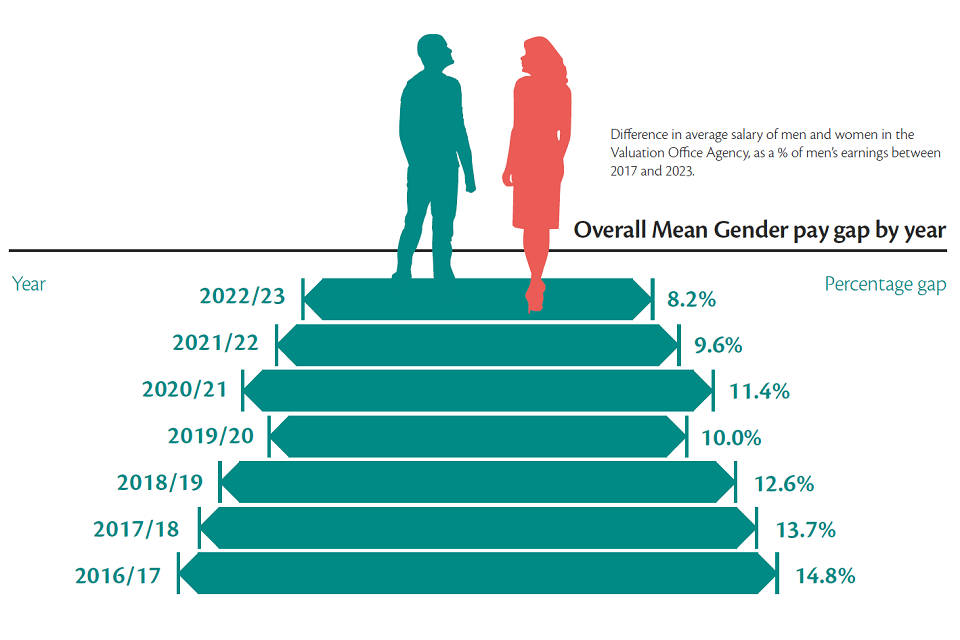
Since we first published the gender pay gap figures in 2017, we have seen a steady reduction in the overall mean gender pay gap.
As illustrated in the images below and table at Annex C, we have achieved a steady closing of the gender pay gap, with a decrease in the mean by 6.6% and the median by 13.5% since the introduction of gender pay gap reporting in 2017. This year we closed the mean by a further 1.4% and the median by 7.0%.
Bonus (non-consolidated) payments
Our mean bonus gap is now -2.1% (previously 0.7%). This means that, having previously been a gap less than 1% in favour of men last year, it is now around 2% in favour of women.
The median bonus gap is now -100% in favour of women, having in previous years been 0%. This is because the median point for women is £40 (equivalent to two Simply Thanks bonuses received in the year), whereas the median point for men is £20 (one bonus received in the year).
The 2022/23 performance year represents the seventh year of our fully in-year cash bonus scheme. We continue to monitor the gender impact of the scheme. As part of our regular reviews of the Simply Thanks scheme, we are currently undertaking a light-touch review to ensure the scheme remains fit for purpose.
Actions
VOA supports the fair treatment and reward of all staff irrespective of gender. We have pay and conditions of employment that do not discriminate unlawfully and are free from bias, by ensuring that equal pay is in place for like-for-like work, work rated as equivalent and work of equal value. We use a job evaluation system to assess the relative value of jobs across the organisation, and this provides evidence in support of the allocation of jobs within our grading structure.
Recruitment
Civil Service Resourcing have direct responsibility for recruiting all VOA employees. The aim of the vacancy filling is to find the best available people for our jobs, applying the fundamental principle of selection for appointment on merit, through fair and open competition.
Talent and development
We recognise our people don’t all want the same things from their careers. We aim to provide everyone with opportunities to be the best they can be and to progress, whether to more senior roles, or other roles in the agency or the Civil Service.
During 2022, we ran talent roadshows for senior colleagues, to help them to identify the right talent and with the greatest potential to succeed.
We continue to encourage colleagues to benefit from the variety of programmes we have across the agency, such as Future Leaders Scheme, Leap, Embrace, Ascend and Fast Stream.
We have also promoted surveying as a career for women, working with the Royal Institution of Chartered Surveyors (RICS) and the VOA’s Deputy Head of Surveying Profession to increase the percentage of women in surveying roles.
While there is still more work to do, particularly in technical leadership roles, we compare very favourably to the wider property industry in terms of representation where RICS’ latest data (July 2023) shows that just 18% of RICS members are female. Our data for September 2023 showed that women now comprise:
- 41% of our Chartered Surveyors; and
- 32% of our Technical Leaders
Mentoring schemes
During the reporting period, we continued to provide mentoring opportunities to all colleagues. This includes a VOA-wide mentoring scheme (first launched in September 2020) which offers both traditional and reverse mentoring, with the ability to ask for a mentor from a different profession. The VOA mentoring scheme has allowed colleagues to discuss many different aspects of their work life, including helping them to think about their career and personal development.
The VOA/HMRC Stride mentoring scheme (supporting social mobility) and the Civil Service disability mentoring programme (supporting disabled colleagues) have also been promoted along with other Civil Service mentoring schemes.
Flexible working
As part of our transformation programme, we will continue to support people across all grades who wish to work more flexibly. Most roles are available as job-share, reduced hours, or flexible working patterns.
Hybrid working has also been introduced and embedded into the agency. As we have more women in both junior grades and as carers, our hybrid working approach helps make us an attractive employer for women.
Leave
In 2021, the VOA’s paternity leave offer was increase from two weeks to four weeks, enabling colleagues to increase their time at home with their children.
Diversity group
The VOA’s gender group supports colleagues and drives action across the agency. The group provides a space where members can reflect, raise any issues, and discuss concerns. These invaluable insights directly inform the work of the volunteers, including improving support for all people.
The gender group also works with the VOA’s People group and with other diversity and inclusion groups and networks across the Civil Service to link into wider Civil Service initiatives. This is with the aim of understanding the challenges colleagues may face in relation to gender and intersectional issues, share learning and provide or signpost the appropriate support.
This includes raising awareness with managers and colleagues about the impact that the menopause can have through menopause support guidance and workshops.
Bonus (non-consolidated) payments
We have operated a fully voucher based system for delegated grades since November 2020. This mainly consists of rewards of £20. In exceptional cases, awards of £100 may be made but these require sign off at Director level. We regularly monitor distribution of the awards to address any issues identified.
Equal pay audit
We published our most recent equal pay audit in September this year. The audit compared pay across multiple protected characteristics, within roles of the same grade and found no significant pay differences.
Raising awareness of women’s health in the workplace
We have increased awareness of women’s health conditions and how it can impact on women in the workplace. This includes videos, guidance, and toolkits for example on menopause awareness to support those directly impacted. We are also increasing the number of allies from those not directly impacted who are able to speak up on behalf of others.
Increasing visible female role models
We have showcased a number of visible female role models to help inspire the next generation. This includes two female colleagues being nominated at the October 2023 ‘Inspiring Women in Property Awards’.
Calculations
Our calculations followed the legislative requirements, and we confirm the data reported is accurate. All staff who were deemed to be full paid relevant employees (as defined by the gender pay gap reporting provisions) were included.
Annex A: Workforce demographics 2023
| % Female within Grades | % Female within Grades | ||||||
|---|---|---|---|---|---|---|---|
| Grades | Males | Females | Total | 21/22 | 22/23 | Difference | Total as % of agency |
| AA & AO & EO | 784 | 1,097 | 1,881 | 58.62% | 58.32% | -0.30% | 47.17% |
| HEO and above | 1,143 | 964 | 2,107 | 45.05% | 45.75% | 0.70% | 52.83% |
| % Female within Grade | % Female within Grade | |||||
|---|---|---|---|---|---|---|
| Grades | Males | Females | Total | 21/22 | 22/23 | Difference |
| AA | 0 | 0 | 0 | N/A | N/A | N/A |
| AO | 381 | 560 | 941 | 62.10% | 59.51% | -2.59% |
| EO | 403 | 537 | 940 | 55.72% | 57.13% | 1.41% |
| HEO | 455 | 395 | 850 | 46.89% | 46.47% | -0.42% |
| SEO | 392 | 348 | 740 | 45.43% | 47.03% | 1.60% |
| Grade 7 | 235 | 177 | 412 | 42.42% | 42.96% | 0.54% |
| Grade 6 | 47 | 35 | 82 | 37.04% | 42.68% | 5.65% |
| SCS | 14 | 9 | 23 | 42.86% | 39.13% | -3.73% |
| Total | 1,927 | 2,061 | 3,988 | 51.59% | 51.68% | 0.09% |
Positive figures shown in the difference column indicate increased representation of women within that grade/overall.
Annex B: 2023 VOA overall gender pay gap results
| 21/22 | 22/23 | Difference | ||
|---|---|---|---|---|
| 1. Mean gender pay gap | 9.6% | 8.2% | -1.4% | |
| 2. Median gender pay gap | 9.8% | 2.8% | -7.0% | |
| 3. Mean Bonus pay | 0.7% | -2.1% | -2.8% | |
| 4. Median Bonus pay | 0.0% | -100.0% | -100.0% | |
| 5. Bonus proportions | Male | 68.0% | 68.1% | 0.1% |
| Female | 67.3% | 67.3% | 0.5% |
Proportion of male and female employees in each quartile
| 21/22 | 21/22 | 22/23 | 22/23 | Difference | Difference | |
|---|---|---|---|---|---|---|
| Quartile | % F | % M | % F | % M | % F | % M |
| 1 | 59.4% | 40.6% | 58.0% | 42.0% | -1.4% | 1.4% |
| 2 | 56.0% | 44.0% | 54.4% | 45.6% | -1.6% | 1.6% |
| 3 | 49.7% | 50.3% | 51.1% | 48.9% | 1.4% | -1.4% |
| 4 | 41.0% | 59.0% | 42.4% | 57.6% | 1.4% | -1.4% |
| Total Staff | 21/22 | 22/23 | Difference |
|---|---|---|---|
| Female | 1,992 | 2,061 | 69 |
| Male | 1,869 | 1,927 | 58 |
| Total | 3,861 | 3,988 | 127 |
Annex C: Closing the Gap – our progress to date
Figures since the introduction of gender pay gap reporting
| Difference since | Difference since | |||||||||
|---|---|---|---|---|---|---|---|---|---|---|
| 16/17 | 17/18 | 18/19 | 19/20 | 20/21 | 21/22 | 22/23 | 21/22 | 16/17 | ||
| Mean gender pay gap | 14.8% | 13.7% | 12.6% | 10.0% | 11.4% | 9.6% | 8.2% | -1.4% | -6.6% | |
| Median gender pay gap | 16.3% | 15.1% | 14.0% | 6.6% | 15.4% | 9.8% | 2.8% | -7.0% | -13.5% | |
| Mean bonus pay | -2.9% | 4.8% | -0.9% | 6.1% | -9.0% | 0.7% | -2.1% | -2.8% | 0.8% | |
| Median bonus pay | 0.0% | 0.0% | 0.0% | 0.0% | 0.0% | 0.0% | -100% | -100% | -100% | |
| Bonus Proportions | M | 87.9% | 88.8% | 76.7% | 56.5% | 61.1% | 68.0% | 68.1% | 0.1% | -19.8% |
| F | 87.5% | 88.6% | 76.3% | 53.3% | 63.5% | 66.8% | 67.3% | 0.5% | -20.2% |
Note:
- Bonus proportions are expressed as the % of total men/women receiving a bonus that year
- Where pay gap figures are shown, a positive figure denotes the % amount that women’s mean or median hourly salary is lower than men.
- A negative figure denotes instances where the mean or median hourly salary for women is higher than for men.
- The ideal position is therefore 0.00%.
Annex D: 2023 gender pay gap results by location
| 2021/2022 | 2021/2022 | 2022/23 | 2022/23 | Difference | Difference | ||
|---|---|---|---|---|---|---|---|
| London | National | London | National | London | National | ||
| Mean gender pay gap | 8.6% | 9.2% | 5.9% | 8.3% | -2.7% | -0.9% | |
| Median gender pay gap | 12.1% | 14.7% | 5.3% | 13.8% | -6.8% | -0.9% | |
| Mean Bonus pay | -41.7% | 13.1% | -30.6% | 4.1% | 11.1% | -9.0% | |
| Median Bonus pay | 0.0% | 0.0% | 0.0% | -100.0% | 0.0% | -100.0% | |
| Bonus proportions | Male | 64.9% | 68.7% | 67.1% | 68.4% | 2.2% | -0.3% |
| Female | 64.3% | 67.3% | 64.8% | 67.9% | 0.5% | 0.6% |
Note:
- Bonus proportions are expressed as the % of total men/women receiving a bonus that year
- Where pay gap figures are shown, a positive figure denotes the % amount that women’s mean or median hourly salary is lower than men.
- A negative figure denotes instances where the mean or median hourly salary for women is higher than for men.
- The ideal position is therefore 0.00%.