VOA's gender pay gap report 2019
Published 23 January 2020

© Crown copyright 2020
This publication is licensed under the terms of the Open Government Licence v3.0 except where otherwise stated. To view this licence, visit nationalarchives.gov.uk/doc/open-government-licence/version/3 or write to the Information Policy Team, The National Archives, Kew, London TW9 4DU, or email: psi@nationalarchives.gov.uk.
Where we have identified any third party copyright information you will need to obtain permission from the copyright holders concerned.
This publication is available at https://www.gov.uk/government/publications/voa-gender-pay-gap-report-and-data-2019/voas-gender-pay-gap-report-2019
Introduction
Monitoring and reporting with absolute transparency are vital to help us tackle inequality and promote diversity in the workplace. This year’s gender pay gap report shows that, while we have made improvements over the last year, there is still work to be done to close that gap.
This is the third year we have published our gender pay results. They focus on our progress in reducing our gender pay gap – the difference in salary between all the men and women in our workforce.
The data shows we are continuing to make progress in closing our overall pay gap - a gap that remains lower than the national average.
The key mean and median gender pay gaps for 2019 are listed below:
- mean gender pay gap is 12.6%
- median gender pay gap is 14.0%
- mean bonus gap is now -0.9%
- median bonus gap is 0.0%
As an agency, reporting in this way helps us identify areas we need to work on and recognises our achievements in supporting our people through their development and attracting a more diverse workforce.
We continue to see a greater proportion of men than women at senior levels, which results in an over all pay gap but at grades below senior civil servant there is actually a bias towards women.
We continue to focus on development and talent programmes at all grades to help us address these discrepancies and employee benefits such as flexible working arrangements make it easier for everyone to maintain a work-life balance. We are also making changes to our recruitment and retention programmes to help us attract, and maintain, a workforce which is representative to the communities we serve.
Jonathan Russell
Chief People Officer, Valuation Office Agency
Overview
In 2017, the Government introduced world-leading legislation that made it statutory for organisations with 250 or more employees to report annually on their gender pay gap. Government departments are covered by the Equality Act 2010 (Specific Duties and Public Authorities) Regulations 2017 which came into force on 31 March 2017. These regulations underpin the Public Sector Equality Duty and require relevant organisations to publish their gender pay gap by 30 March annually. This includes the mean and median gender pay gaps; the mean and median gender bonus gaps; the proportion of men and women who received bonuses; and the proportions of male and female employees in each pay quartile.
The gender pay gap shows the difference in the average pay between all men and women in a workforce. If a workforce has a particularly high gender pay gap, this can indicate there may be a number of issues to deal with, and the individual calculations may help to identify what those issues are.
The gender pay gap is different to equal pay. Equal pay deals with the pay differences between men and women who carry out the same jobs, similar jobs or work of equal value. It is unlawful to pay people unequally because they are a man or a woman.
Building a diverse and inclusive workforce that reflects the people we serve is one of the Civil Service’s top workforce priorities. Our collective aim is to make the Civil Service the UK’s most inclusive employer by 2020. Our Diversity and Inclusion Strategy outlines how we plan to achieve this. The Civil Service should create opportunities for all in a truly meritocratic way and reward all civil servants fairly, regardless of gender, ethnicity or any other personal characteristic.
The VOA supports the fair treatment and reward of all staff irrespective of gender.
VOA gender pay gap report 2019
This report gives the gender pay gap data in the VOA as at 31 March 2019.
Our gender pay gap for 2019 is:
- mean gender pay gap is 12.6% (a reduction from 13.7% in 2018)
- median gender pay gap is 14.0% (a reduction from 15.1% in 2018)
- mean bonus gap is now -0.9% (having previously been 4.8% in 2018)
- median bonus gap is 0.0% (unchanged since 2018)
For salaries we used a snapshot date of 31 March 2019. The relevant pay period was our March payroll.
For bonuses we used the period 1 April 2018 to 31 March 2019: the 12 months before the snapshot date.
The gender pay gap data supplied is correct for all staff in post with the VOA on 31 March 2019. The results are below at Annex A.
In the VOA there were 3,575 staff in post. Our gender balance was:
- women: 1,810 (50.6%) an increase of 1.2% from last year
- men: 1,765 (49.4%) a corresponding decrease from last year
The VOA follows the standard public sector approach to pay and grading. All posts sit within one of nine levels (grades), and each level has an associated pay range consisting of a minimum and maximum rate. The AA grade consists of a single spot rate. Salaries are paid according to grade and annual pay awards within the grade are paid irrespective of gender. At the date of this report there remain just over 100 employees who have opted to remain on the previous VOA Pay Band system.
Our headquarters are in London, and we have offices right across the UK. All grades, with the exception of Director and Director General within the Senior Civil Service (SCS), have both a London and National pay range. At 31 March 2019, we also have one further local pay zone, the Intermediate Zone. This report covers the main pay ranges. Those in the Intermediate Zone have been recorded within the National pay range to ensure anonymity, due to the relatively low numbers of employees involved.
For pay purposes we are governed by public sector pay policy, which HM Treasury has overall responsibility for. This defines the overall parameters for civil service pay uplifts each year in the pay guidance, to ensure that civil service pay awards are consistent with the government’s overall objectives.
Our annual pay award currently comprises a consolidated award paid to all staff, subject to performance.
- for staff in delegated grades, bonus payments are made in the form of in-year cash bonuses to recognise commendable performance
- for members of the SCS there is also a non-consolidated award linked to exceptional performance against objectives
The value of both consolidated and non-consolidated pay awards are negotiated with our recognised trade unions, and is subject to HM Treasury and Ministerial agreement. We do not negotiate individual awards, and our pay system takes no account of gender or any other protected characteristic.
Base pay
The mean hourly rate for women is £13.86
The mean hourly rate for men is £15.86
The overall mean hourly rate is £14.85
Mean gender pay gap is 12.6% (a reduction from 13.7% in 2018)
The median hourly rate for women is £12.36
The median hourly rate for men is £14.36
The overall median hourly rate is £13.03
Median gender pay gap is 14.0% (a reduction from 15.1% in 2018)
The distribution of our workforce drives our mean and median figures: whilst we have a very diverse workforce we do still have a large number of our female workforce in the lower pay grades. The gender mix of our Executive Committee on 31 March 2019 was 6 men and 3 women.
We analysed our GPG results in more depth and found the differences reduce, sometimes quite markedly, when considered by our National and London pay areas (Annex B) and for each grade (Annex C).
Our recruitment and promotion policies are based on fair and open competition.
We are committed to offering roles on flexible working patterns, including a range of options such as part-time working, alternative working hours, and enhanced shared parental leave.
Bonus (Non-consolidated) payments
Our mean bonus gap is now -0.9%with men receiving more in (non-consolidated) payments. Last year, this was 4.8% in favour of women. This change is close to the number of awards given. Of the bonuses awarded 49.5% was awarded to females and 50.5% to men.
The 2018/2019 performance year represents the third year of our fully in-year cash bonus scheme.
Actions
VOA supports the fair treatment and reward of all staff irrespective of gender. We have pay and conditions of employment that do not discriminate unlawfully and are free from bias by ensuring that equal pay is in place for like-for-like work, work rated as equivalent and work of equal value. We use a job evaluation system to assess the relative value of jobs across the organisation, and this provides evidence in support of the allocation of jobs within our grading structure.
- recruitment
Civil Service Resourcing have direct responsibility for recruiting all VOA employees. The aim of the vacancy filling is to find the best available people for our jobs, applying the fundamental principle of selection for appointment on merit, through fair and open competition.
- talent and development programmes
We recognise that our staff don’t all want the same things from their careers. We aim to provide everyone with opportunities to be the best they can be and to progress, whether to more senior roles, or other roles in the Agency or the civil service. To support this, we will continue to encourage staff to benefit from the variety of programmes we have across the department such as Future Leaders Scheme, Leap, Embrace, Ascend and Fast Stream.
- flexible working
As part of our Transformation programme, we will continue to support staff who wish to work more flexibly, across all grades. Most roles are available as job-share, reduced hours, or flexible working patterns.
- bonus (Non-consolidated) payments
We have reduced the number of levels of awards and are introducing a bi-annual assurance panel to analyse the distribution of non-consolidated payments in year and take remedial action where problems are identified.
- Equal Pay Audit
We publish our most recent equal pay audit earlier this year. The audit compared pay across multiple protected characteristics, within roles of the same grade and found no significant pay differences. The next Equal Pay Audit will be in 2021.
- Diversity Group
Our Gender Diversity Group supports colleagues and drives action across the Agency. They have been instrumental in creating guidance which supports women and they link into wider civil service work which seeks to understand the challenges women may face in order to provide appropriate support.
- wellbeing
Raising awareness of work-life balance and caring responsibilities, regardless of gender identity. We want to foster an environment where we can talk openly about health concerns, providing support to our colleagues and managers.
Calculations
Our calculations followed the legislative requirements, and we confirm the data reported is accurate. All staff who were deemed to be full paid relevant employees (as defined by the gender pay gap reporting provisions) were included, however contractors were not, as the vast majority were not in scope according to the regulations, or there was insufficient data. We aim to include this data for future calculations.
Annex A
Workforce demographics 2019
Women are over-represented in more junior grades AA to EO, where 62.6% are women. Pay in these grades is lower.
In more senior grades men are over represented. This is slowly changing. The departure of just a small number of women can change improvements made year to year especially at Grade 6 and SCS.
VOA data
| Grades | Males in grade | Females in grade | Total | Females % | Females % |
| +/- From 2018 | |||||
| AA and AO | 38 | 593 | 901 | 65.80% | -0.01% |
| EO | 438 | 551 | 9 | 55.70% | 0.70% |
| HEO and SEO | 741 | 529 | 1270 | 41.70% | 0.70% |
| Grade 7 | 209 | 107 | 316 | 33.90% | 1.70% |
| Grade 6 | 56 | 20 | 76 | 26.30% | -1.10% |
| SCS | 12 | 7 | 19 | 36.80% | -4.10% |
| Band T (FS) | 4 | As group is identifiable cannot comment on | |||
| Total | 1765 | 1810 | 3575 | 50.60% |
Civil Service data
Representation of women by grade, 2010 to 2019
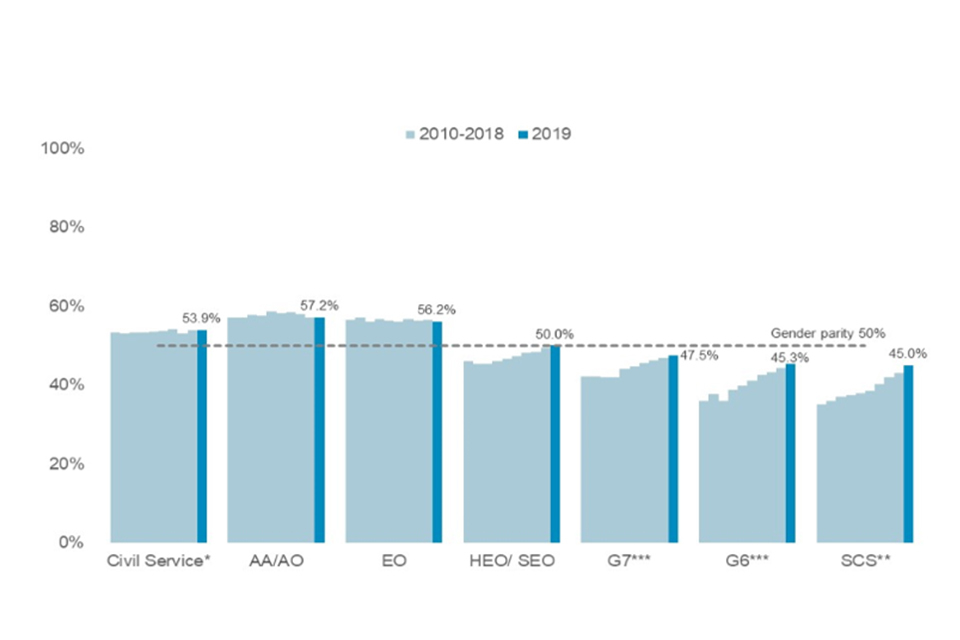
Image of a graph to represent women by grade for 2010 to 2019
Annex B
2019 VOA overall gender pay gap results
| 1. Mean gender pay gap - Ordinary pay | 12.60% |
| 2. Median gender pay gap - Ordinary pay | 14.00% |
| 3. Mean gender pay gap - Bonus pay in the 12 months ending 31 March | -0.90% |
| 4. Median gender pay gap - Bonus pay in the 12 months ending 31 March | 0.00% |
| Female | Male | |
| 5. The proportion of male and female employees paid a bonus in the 12 months ending 31 March | 76.30% | 76.70% |
| 6. Proportion of male and female employees in each quartile. | ||
| Quartile | Female | Male |
| First (lower) quartile | 59.50% | 40.50% |
| Second quartile | 56.30% | 43.70% |
| Third quartile | 49.40% | 50.60% |
| Fourth (upper) quartile | 37.40% | 62.60% |
| Totals of staff | Numbers | |
| Female | 1,810 | |
| Male | 1,765 | |
| Total | 3,575 | |
Note:
- where pay gap figures are shown, a positive figure denotes the % amount that women’s mean or median hourly salary is lower than men
- a negative figure denotes instances where the mean or median hourly salary for women is higher than for men
The ideal position is therefore 0.00%
Annex C
2019 VOA gender pay gap results by location
| London | National | |||
| 1. Mean gender pay gap - Ordinary pay 14.8% 11.5% | 14.80% | 11.50% | ||
| 2. Median gender pay gap - Ordinary pay 13.8% 10.3% | 13.80% | 10.30% | ||
| 3. Mean gender pay gap - Bonus pay in the 12 months ending 31 March | 4.60% | -2.10% | ||
| 4. Median gender pay gap - Bonus pay in the 12 months ending 31 March | 0.00% | 0.00% | ||
| Female | Male | Female | Male | |
| 5. The proportion of male and female employees paid a bonus in the 12 months ending 31 March: | 76.00% | 74.90% | 76.40% | 77.10% |
| 6. Proportion of male and female employees in each quartile. | ||||
| Female | Male | Female | Male | |
| First (lower) quartile | 55.60% | 40.40% | 62.20% | 37.80% |
| Second quartile | 62.00% | 38.00% | 54.80% | 45.20% |
| Third quartile | 43.30% | 56.70% | 49.70% | 50.30% |
| Fourth (upper) quartile | 32.20% | 67.80% | 37.20% | 62.80% |
| Totals of staff | London | National |
| Female | 337 | 1473 |
| Male | 347 | 1418 |
| Total | 684 | 2891 |
Note:
- Where pay gap figures are shown, a positive figure denotes the % amount that women’s mean or median hourly salary is lower than men
- a negative figure denotes instances where the mean or median hourly salary for women is higher than for men
- The ideal position is therefore 0.00%
Annex D
2019 VOA gender pay gap results by grade
| VOA - by grade | % - AA | % - AO | % - O | % - HO | % - SO | % - G7 | % - G6 | % SCS | ||||||||
| 1. Mean gender pay gap - Ordinary pay | -4.30% | -7.40% | -5.10% | -0.50% | -0.10% | -0.10% | 0.30% | 1.60% | ||||||||
| 2. Median gender pay gap - Ordinary pay | -13.50% | -13.00% | -4.60% | -0.90% | 0.00% | -0.20% | 0.30% | 1.90% | ||||||||
| 3. Mean gender pay gap - Bonus pay in the 12 months ending 31 March | 28.60% | 3.00% | -11.30% | -14.30% | -16% | -5.00% | 10.40% | 0.00% | ||||||||
| 4. Median gender pay gap - Bonus pay in the 12 months ending 31 March | 33.30% | -33.30% | 0.00% | 0.00% | -25.00% | 0.00% | 0.00% | 0.00% | ||||||||
| 5. The proportion of male and female employees paid a bonus in the 12 months ending 31 March: | 70.80% | 815% | 66.90% | 83.40% | 81.30% | 81.30% | 75.00% | 0.00% | ||||||||
| 67.00% | 72.30% | 74.80% | 83.50% | 86.80% | 78.50% | 65.00% | 14.30% | |||||||||
| 6. Proportion of male and female employees in each quartile. | % - AA | % - AO | % - O | % - HO | % - SO | % - G7 | % - G6 | % SCS | ||||||||
| Quartile | Female % | Male % | Female % | Male % | Female % | Male % | Female % | Male % | Female % | Male % | Female % | Male % | Female % | Male % | Female % | Male % |
| First (lower) quartile | 48.10% | 51.90% | 51.70% | 48.30% | 43.40% | 56.70% | 41.90% | 58.10% | 39.50% | 60.50% | 30.40% | 69.60% | 36.80% | 63.20% | 75.00% | 25.00% |
| Second quartile | 47.50% | 52.50% | 59.60% | 40.40% | 48.60% | 51.40% | 41.70% | 58.30% | 42.00% | 58.00% | 36.70% | 63.30% | 10.50% | 89.50% | 0.00% | 100.00% |
| Third quartile | 65.80% | 34.20% | 84.90% | 15.10% | 64.40% | 35.60% | 45.80% | 54.20% | 35.80% | 64.20% | 35.40% | 64.60% | 36.80% | 63.20% | 40.00% | 60.00% |
| Fourth (upper) quartile | 75.00% | 25.00% | 81.50% | 18.50% | 66.50% | 33.50% | 45.50% | 54.50% | 41.40% | 58.60% | 32.90% | 67.10% | 21.10% | 78.90% | 40.00% | 60.00% |