Variation in the Universal Credit sanction rate between jobcentres from August 2017 to August 2019
Published 8 October 2020
Applies to England, Scotland and Wales

© Crown copyright 2020
This publication is licensed under the terms of the Open Government Licence v3.0 except where otherwise stated. To view this licence, visit nationalarchives.gov.uk/doc/open-government-licence/version/3 or write to the Information Policy Team, The National Archives, Kew, London TW9 4DU, or email: psi@nationalarchives.gov.uk.
Where we have identified any third party copyright information you will need to obtain permission from the copyright holders concerned.
This publication is available at https://www.gov.uk/government/publications/variation-in-the-universal-credit-sanction-rate-between-jobcentres-from-august-2017-to-august-2019/variation-in-the-universal-credit-sanction-rate-between-jobcentres-from-august-2017-to-august-2019
This is an analytical release carried out by the Department for Work and Pensions (DWP).
Executive Summary
The Universal Credit (UC) sanction rate in Great Britain (GB) in August 2019 was 2.36%. This aggregate number does not provide information on potential local differences in sanctions rates. This report documents the geographic variation in sanction rates. The following key findings are established:
- the UC sanction rate of the median jobcentre in GB has reduced substantially from 8.5% in March 2018 to 2.3% in August 2019. The degree of variation between jobcentres has also reduced substantially in this period. This national pattern is repeated across each jobcentre region
- since the start of 2019, variation in the Universal Credit sanction rate across jobcentres has been low and stable
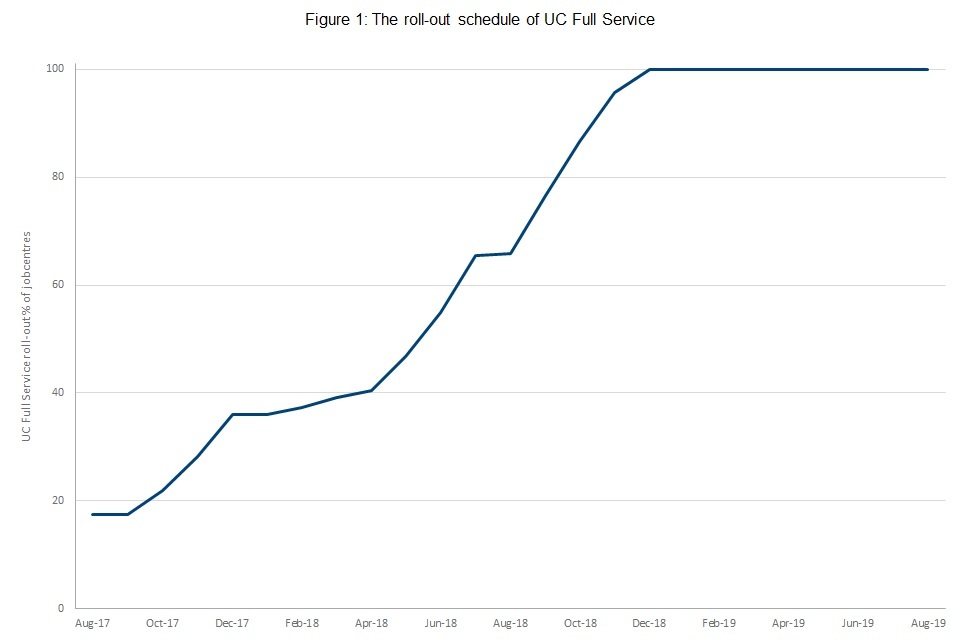
- this period of low and stable sanction rates coincides with the completion of the roll-out of UC full-service[footnote 1] at the end of 2018
It should be noted that, since sanctions are behaviour driven, there will always be natural variation in sanction rates between jobcentres so some degree of variation is to be expected.
1. Introduction
1.1 Report context
The roll-out of Universal Credit (UC) full service[footnote 2] to all jobcentres was completed at the end of 2018. To help monitor the sanctions regime this paper assesses variation in the Universal Credit sanction rate across jobcentres in Great Britain.
It should be noted that, since sanctions are behaviour driven, there will always be natural variation in sanction rates between jobcentres so some degree of variation is to be expected.
1.2 Policy context
A sanction is a reduction of the UC award calculated with reference to the standard allowance. To be entitled to UC, claimants must accept a claimant commitment. This claimant commitment may include mandatory requirements, which will be tailored to the claimant’s circumstances, including any health conditions, caring responsibilities, and other factors, such as the situation of the local labour market, so they are reasonable and achievable. Their aim is to support claimants in their journey towards work. Mandatory requirements may be applied to claimants who are subject to ‘all work-related requirements’, ‘work preparation’ and ‘work-focused interview requirements’ only[footnote 3].
Sanctions are intended to encourage claimants to comply with these requirements by having a deterrent effect. Sanctions also apply to leaving a job or for loss of pay, by choice and for no good reason, or due to misconduct, pre- or in-claim. DWP has a legal duty to monitor compliance and to impose sanctions if the claimant has no good reason for failing to comply. Good reason is determined on a case by case basis and is not codified. Examples of good reason would include suffering a temporary period of sickness or temporary childcare responsibilities.
Where a claimant has failed to comply with a requirement, the matter is referred to a Decision Maker for a sanction decision. This is known as a sanction referral. The Decision Maker looks at all the available information about the claimant’s circumstances, other external factors, and any evidence of good reason provided, to decide whether the claimant had good reason for failing to comply. If the Decision Maker considers the claimant had no good reason, a decision to impose a sanction is made. This is known as an adverse decision.
2. Data Sources
The documentation of the variation in sanction rates (section 3) uses DWP publically available benefits data on UC live and full service sanctions from Stat-Xplore released as part of the Official Statistics published on 12 November 2019[footnote 4]. This data is available aggregated to the jobcentre and regional levels.
The sample period for the analysis is August 2017 to August 2019. There are around 600 jobcentres in GB across 11 jobcentre regions[footnote 5].
3. Documenting variation in the Universal Credit sanction rate across jobcentres in Great Britain (GB)
3.1 Methodology
3.1.1 Sanction measure
The report focuses on reductions made as a result of the decision to impose a sanction, rather than referrals. This is the measure used in the official UC sanction rate. The department is currently unable to provide robust statistics on referrals[footnote 6].
3.1.2 Definition of the UC sanction rate
The UC sanction rate is a snapshot measurement made once a month[footnote 7] of the percentage of UC claimants subject to conditionality that have a reduction taken from their UC award as a result of a sanction. The conditionality group of a claimant is defined at the point when the snapshot is taken. The precise calculation is as follows.
Calculation
UC sanction rate =
Number of claimants with a sanction reduction at a point in the month, across all conditionality groups
divided by
Number of claimants in conditionality groups that are subject to sanctions at the same point in the month
UC work groups that are subject to sanctions:
- Searching for work (Intensive)
- Working - with requirements (Light touch)
- Planning for work (Work Focused Interview)
- Preparing for work (Work Preparation).
UC work groups that are not subject to sanctions:
- Working-no requirements (Working Enough)
- No work requirements (No Work Related Requirements)
The UC sanction rate statistics include those sanctions which subsequently go on to be overturned. Claimants whose sanction is overturned will be repaid any reduction[footnote 8]:
3.2 Results
3.2.1 Variation across jobcentres over time (GB level)
The UC sanction rate of the median GB jobcentre has reduced substantially from 8.5% in March 2018 to 2.3% in August 2019. The sanction rates of the 5th and 95th percentile jobcentres have also decreased over this period. Indicators of variation across jobcentres have been more stable from February to August 2019, since the roll-out of UC full-service was completed. The higher variation before 2019 could be driven by a different composition of claimants in this period as UC live service claimants made a bigger contribution to the statistics[footnote 9]. Typically only single claimants with no children were eligible for UC live service when it was first introduced.

3.2.2 Variation across jobcentres over time (regional level)
The trajectory of the median sanction rate in each region is quite similar and reflective of the UC sanction rate of the median GB jobcentre reported in section 3.2.1. Specifically, the median sanction rate in every region has decreased by 4 percentage points between 2017 and 2019.
Though the trajectories are similar, the order of different regions has changed over time, even if the range of difference between regions has remained small. For example, the ‘London and Essex’ region had one of the highest sanction rates in August 2017 at 8.6%, but by August 2019 had become the 2nd lowest region with a sanction rate of 1.9%. Conversely, East and North Scotland had the lowest rate in August 2017 at 6.7% but had the highest in August 2019 at 3.0%.


3.2.3 Distribution of jobcentre sanction rates
As presented in section 3.2.1, the sanction rate over the period June to August 2019 is stable and relatively low, and differences in sanction rates between regions are quite small. A detailed analysis of the distribution of UC Sanction Rates for GB Jobcentres, averaged across June to August 2019, reveals that 80% of jobcentres had a UC sanction rate of 3.1% or lower.

3.2.4 Jobcentre variation vs regional variation
Variation in jobcentre sanction rates for the period June to August 2019 is driven more by variation within regions than across regions. Specifically, variation in the median UC sanction rate across the regions is just over 1 percentage point. Variation between jobcentres within a region is at least 3 times more than this.

4. Conclusion
This report documents the geographic variation in sanction rates. The following key findings are established:
- the UC sanction rate of the median jobcentre in GB has reduced substantially from 8.5% in March 2018 to 2.3% in August 2019. The degree of variation between jobcentres has also reduced substantially in this period. This national pattern is repeated across each jobcentre region
- since the start of 2019, variation in the Universal Credit sanction rate across jobcentres has been low and stable
- this period of low and stable sanction rates coincides with the completion of the roll-out of UC full-service[footnote 10] at the end of 2018
It should be noted that, since sanctions are behaviour driven, there will always be natural variation in sanction rates between jobcentres so some degree of variation is to be expected.
5. Principles followed in the compilation and release of these tables
Although the tables are not Official Statistics, they have been produced as far as possible in line with the Code of Practice for Statistics. The code is built around 3 main concepts, or pillars:
- trustworthiness – is about having confidence in the people and organisations that publish statistics
- quality – is about using data and methods that produce assured statistics
- value – is about publishing statistics that support society’s needs for information.
The following explains how we have applied the pillars of the Code in a proportionate way.
Trustworthiness
DWP analysts work to a professional competency framework and Civil Service core values of integrity, honesty, objectivity, and impartiality. Analysts have produced these statistics and conducted rigorous quality assurance in line to the standards usually applied to ad hoc releases. Background and methodology information is also included in the release.
The analysis has been signed off by the expert lead analyst and the Department’s Head of Profession for Statistics was consulted on the production and publication process and the timing of the publication was pre-announced.
Care has been taken to ensure only those who needed to see the analysis prior to publication, which included officials and ministers, had access to it.
Quality
The analysis uses the Department for Work and Pensions (DWP) publically available benefits data on UC live and full service sanctions from Stat-Xplore, released quarterly. The data on which the analysis is based therefore adheres to the rigorous quality process associated with its release.
The methodology aligns to that used in the quarterly benefit sanctions release to ensure they use the best approach that is available at the time.
Value
This ad hoc release contains analysis requested by the Public Accounts Committee and publishing the report ensures the statistics are equally available to all users. It also provides value to society by helping monitor the sanctions regime.
The Department for Work and Pensions team that produced this report consisted of: Edward Martyn, Steffan Allen, John Ferrier, Stewart Butler and Carmen Pardavila.
For further information and feedback: DWP Press Office, 0203 267 5129
-
When UC was introduced in 2013, claims were administered on the live service system. New claims to UC live service ceased in January 2018 and since then the remaining live service cases were gradually migrated to UC full service. At the end of March 2019, the systems that were used to administer live service cases were shut down. As of January 2019, UC full service administers all claims. ↩
-
These are the legal names. These groups map on to the names used on the UC system as follows: ‘all work-related requirements’ (‘Intensive’ and ‘Light Touch’), ‘work preparation requirements’ (‘Work Preparation’) ‘work-focused interview requirements’ (‘Work Focused Interview’). ↩
-
The full publication is available at this link: https://assets.publishing.service.gov.uk/government/uploads/system/uploads/attachment_data/file/893156/benefit-sanctions-statistics-to-july-2019-revised-in-june-2020.pdf ↩
-
The exact number of jobcentres varies over the sample period. ↩
-
The department is looking at ways of improving the way it collates sanctions information in UC full service. ↩
-
Specifically, on the second Thursday. ↩
-
For more detail on how the sanction rate is calculated, see the ‘Sanction Rates’ section of the background information and methodology document. ↩
-
There was a peak in the UC sanction rate in early 2017 due to the allocation of more decision makers to deal with a build-up in referrals awaiting decisions. The rate decreased in 2017 and 2018 as the back-log was reduced. ↩
-
When UC was introduced in 2013, claims were administered on the live service system. New claims to UC live service ceased in January 2018 and since then the remaining live service cases were gradually migrated to UC full service. At the end of March 2019, the systems that were used to administer live service cases were shut down. As of January 2019, UC full service administers all claims. ↩