Value for Money metrics – Summary report
Published 27 September 2018
Applies to England

© Crown copyright 2018
This publication is licensed under the terms of the Open Government Licence v3.0 except where otherwise stated. To view this licence, visit nationalarchives.gov.uk/doc/open-government-licence/version/3 or write to the Information Policy Team, The National Archives, Kew, London TW9 4DU, or email: psi@nationalarchives.gov.uk.
Where we have identified any third party copyright information you will need to obtain permission from the copyright holders concerned.
This publication is available at https://www.gov.uk/government/publications/value-for-money-summary-and-technical-reports/value-for-money-metrics-summary-report
Contents
- Executive summary
- Introduction
- Data and methodology
- How does performance on the Value for Money (VfM) metrics vary across the sector?: Variations in reinvestment and new supply, variations in debt-based metrics and variations in cost and efficiency measures
- How has the sector’s performance on the VfM metrics changed from 2015-2017?: Reinvestment, New supply, Debt-based metrics, Headline social housing cost per unit and Operating margins
- What are the factors influencing differences in performance on the VfM metrics?: Reinvestment, New supply (social), Gearing, Headline social housing cost and Operating margin (overall)
- How do different categories of provider vary on the VfM metrics?: Large scale voluntary transfers, Supported housing, Housing for older people, Registered providers – London based and Organisational size
- Conclusions
Executive summary
The new Value for Money (VfM) Standard which took effect from April 2018 requires registered providers to report against a prescribed set of VfM metrics in order to support transparency and comparability across the sector. The regulator is publishing sector analysis based on its VfM metrics as part of its continuing work to help stakeholders to contextualise the performance of individual organisations more easily and to help boards compare themselves to their peers.
It is important that boards should understand their own performance on these metrics and how they compare to other organisations. In particular, it is important that providers should be able to compare themselves with organisations in a similar position. This analysis demonstrates that there are material differences in reported performance between different groups of providers. The most valuable lessons are likely to come from comparison with organisations in similar circumstances, not providers with a very different business model, or operating area. Key points from the analysis include:
- There is a wide range of reported performance on the VfM metrics across the sector.
- Some of this variation can be explained by measurable factors, particularly supported housing stock, housing for older people, geography, deprivation, and Large Scale Voluntary Transfer (LSVT) status.
- Early years LSVT providers are characterised by high levels of reinvestment in the existing stock, but have little capacity for investment in new supply.
- Supported housing activity and housing for older people are associated with much higher costs, and lower operating margins.
- London based providers also face higher costs, but this is partially compensated for by higher rents and scope for sales revenues. Providers in this high demand area are therefore still able to develop social housing at a rate slightly above the sector average.
- However, there is less clear evidence that size of providers influences performance on the metrics. There is no statistically significant relationship between size and reported figures for either new supply of social housing, or cost.
The regression analysis in this publication can only explain part of the variation across the sector. The metrics are the place that the debate can start rather than end. The key question for boards is how they decide on the value they are trying to deliver and how they measure and demonstrate it to key stakeholders including tenants, local communities and others.
It is important that boards should understand the range of factors that could influence the performance of their own organisations, and provide robust challenge where they are not making the most effective use of their resources and assets to achieve the strategic objectives of the business. The regulator will seek assurance on providers’ compliance with the new Standard through its programme of In Depth Assessments, and where necessary, will reflect its view in its published governance judgements.
Table 1: Sector and sub-sector overview (Source: FVA and SDR 2017)
| Quartile Date | No. of providers | % of sector (social united owned) | Reinvestment | New supply (social) | New supply (non-social) | Gearing | EBITDA MRI interest cover | Headline social housing CPU (£’000) | Operating margin (social) | Operating margin | Return on capital employed (ROCE) | |
|---|---|---|---|---|---|---|---|---|---|---|---|---|
| All returns | Upper quartile | 8.6% | 2.2% | 0.03% | 54.8% | 278% | £4.36 | 39.3% | 36% | 5.6% | ||
| Median | 229 | 100% | 5.6% | 1.2% | 0% | 43.4% | 212% | £3.29 | 34.7% | 31.4% | 4.3% | |
| Lower quartile | 3.7% | 0.4% | 0% | 33.5% | 174% | £2.96 | 28.7% | 25% | 3.5% | |||
| Provider sub-set | Median | |||||||||||
| Cost factor | LSVT < 7 years | 7 | 2% | 12% | 0.1% | 0% | 32.8% | 145% | £4.24 | 27.2% | 27.2% | 5.4% |
| LSVT 7-12 years | 25 | 8.6% | 10% | 1.3% | 0% | 41.4% | 274% | £3.32 | 33.4% | 31.2% | 6.1% | |
| London | 31 | 12.8% | 5.7% | 1.4% | 0% | 34.4% | 212% | £5.51 | 29.2% | 29.1% | 3.7% | |
| SH provider | 10 | 1.4% | 3.3% | 1.2% | 0% | 14.5% | 238% | £5.94 | 20.4% | 15.4% | 2.6% | |
| HOP provider | 10 | 3.2% | 5.8% | 0.2% | 0% | 32.2% | 268% | £5.53 | 22.6% | 18.1% | 4.3% | |
| Size (social united owned) | > 30,000 | 19 | 33.1% | 4.8% | 0.8% | 0.05% | 42.4% | 227% | £3.27 | 36.8% | 29.7% | 4.4% |
| 20,000- 29,999 | 17 | 15.9% | 5.7% | 1.4% | 0.12% | 44.2% | 222% | £3.21 | 35.5% | 32.9% | 4.1% | |
| 10,000-19,999 | 47 | 26.2% | 5.7% | 1.5% | 0% | 46.1% | 196% | £3.22 | 33.8% | 31.1% | 4.4% | |
| 5,000-9,999 | 59 | 15.3% | 6.7% | 1.4% | 0% | 48% | 246% | £3.29 | 37% | 33.3% | 5.1% | |
| 2,500-4,999 | 47 | 6.8% | 5.3% | 1% | 0% | 49% | 190% | £3.53 | 33.6% | 29.7% | 4.5% | |
| <2,500 | 40 | 2.7% | 4% | 0.9% | 0% | 30.4% | 248% | £3.65 | 31.5% | 28% | 3.7% |
Introduction
In April 2018 the Regulator of Social Housing (RSH) published a revised Value for Money (VfM) Standard and accompanying Code of Practice. The new Standard requires private registered providers of social housing to clearly articulate their strategic objectives and to publish evidence to enable stakeholders to understand performance against both the provider’s own VfM targets and the set of standard metrics published by the regulator alongside the new Standard.
The introduction of a set of standard metrics is intended to enhance the consistency, comparability and transparency of value for money reporting in the sector. This publication supports this aim by reporting and analysing historic performance on the regulator’s standard metrics. In combination with each provider’s own published strategic targets, these standard metrics will allow interested stakeholders to not only review the progress of each registered provider in terms of its own objectives, but also do so in the context of common performance measures that allow meaningful comparison with other organisations.
The regulator’s metrics suite is set out in table 2. The wider definitions and detail on how to calculate them from the electronic Annual Accounts (FVA) are set out in the accompanying Technical Report. The range of metrics is intended to capture measures reflecting the ‘3Es’ of economy, efficiency and effectiveness with for example: headline social housing cost per unit acting as a measure of economy; operating margins giving insight into efficiency; and output based measures such as new supply giving an insight into effectiveness in achieving some of the sector’s key goals. The metrics work most effectively when taken in the round, as performance on a single measure gives only a partial picture. For example, it is possible to cut costs, but at the expense of reinvestment in the housing stock and new supply, so a more rounded picture of performance can only be achieved by looking at the measures together.
Registered providers’ financial performance on these metrics is based upon their activity across a range of business streams, including non-social housing activity in unregistered subsidiaries and joint ventures. The majority of the metrics are therefore set at a group level and take account of non-social housing income and expenditure as well as social housing. However, there are a number of core activities common to all registered providers, principally social housing lettings. We have therefore also separated out performance between social housing and non-social housing activity for two of the VfM metrics. The metrics are set out below.
Table 2: Value for Money metrics
| Metric | Subdivision – consolidated, social housing or both | Metric description |
|---|---|---|
| 1. Reinvestment % (in existing homes and new homes) | Consolidated | Scale of investment into existing housing and acquisition or development of new housing in relation to the size of the asset base |
| 2. New supply delivered % | Consolidated and social housing | United acquired or developed in year as a proportion of existing stock |
| 3. Gearing % | Consolidated | Proportion of borrowing in relation to size of the asset base |
| 4. Earnings before interest; Tax; Depreciation; Amortisation; Major Repairs; Included (EBITDA MRI) Interest Cover % | Consolidated | Key indicator for liquidity and investment capacity |
| 5. Headline social housing cost per unit (£’000) | Social housing only | Social housing costs per unit |
| 6. Operating Margin % | Consolidated and social housing | Operating surplus (deficit) divided by turnover (demonstrates the profitability of operating assets) |
| 7. Return on Capital Employed % | Consolidated | Surplus/(deficit) plus disposal of fixed assets plus profit /(loss) of joint ventures compared to total assets |
The analysis in this publication sets out:
- Sector analysis which shows the distribution of the sector’s reported performance on each of the seven VfM metrics;
- Regression analysis which is a standard statistical method used to explain the relationship between of each of the seven values for money metrics and the explanatory variables. This helps to explain the differences in registered providers’ performance on the range of metrics.
The publication also provides additional analysis at a sub-sector level to provide more detailed insights into the differences between different types of registered provider, such as LSVT landlords, and supported housing providers.
This analysis should help registered providers and other stakeholders to contextualise and understand their relative performance, as well as identifying some of the possible causes of variation across the sector. Like other economic standards, the regulator’s approach to regulating value for money is co-regulatory. This means that the primary responsibility for ensuring and determining how the new reporting requirements of the Standard are met lies with registered providers and their boards. Boards will need assurance that they have appropriate targets in place, aligned with their own strategic objectives. This may require the development of additional measures, beyond those stipulated by the regulator, reflecting the circumstances of the individual registered provider. These additional targets may be very particular to sub-sectors (such as supported housing providers) or may draw upon sources such as the sector scorecard, which complements the regulator’s metrics and provides additional context on registered providers’ performance on social objectives, for example housing quality or tenant satisfaction.
It is for boards to decide how they run their businesses and assure themselves that they are complying with regulatory standards. The regulator does not seek to determine how registered providers should use their assets and resources, and does not mandate a particular level of performance on costs, outputs or any of the other metrics. However, as part of In Depth Assessments, the regulator will seek assurance that boards understand their own performance and how they are making best use of their assets and resources to deliver their own objectives. The regulator will make use of the VfM metrics in the round to inform its engagement with individual organisations and to identify potential areas where it may need to seek additional assurance.
Date and methodology
The analysis is based on registered providers’ published accounts over three years, as submitted to the regulator through the electronic Annual Accounts returns (FVA). It only includes registered providers with more than 1,000 units. The distributional and time series analysis included in this publication only extends back to 2015 because of the impact of the introduction of FRS102. This change in accounting method makes it more difficult to undertake meaningful comparisons on many of the metrics over a longer period.
It is also necessary for the regulator to update its regulatory returns to align with the reporting requirements of FRS102 and the SORP. The regulator updates its regulatory requirements to reflect changing accounting requirements. Where this has occurred we have made references to it in this report, and sought to explain any implications for the reported figures.
A minority of registered providers are excluded from some, or all of the analysis included in this publication. In some cases this is for methodological reasons; in others it is to support comparability and ease of interpretation. The principal omission is that due to the accounting treatment of mergers, some providers have had to be excluded from the regression analysis. However, these organisations are still included in the main comparative analysis and their exclusion from the regression does not make a fundamental difference to the overall conclusions of the analysis. More information on this issue is set out in the accompanying Technical Report.
The necessary omissions set out above mean that the reported aggregate performance on some of the metrics will not always align exactly with the sector analysis reported in the Global Accounts, though any differences are not considered material.
How does performance on the Value for Money metrics vary across the sector?
The sector level review of the VfM metrics is based on the 2017 Global Accounts dataset.
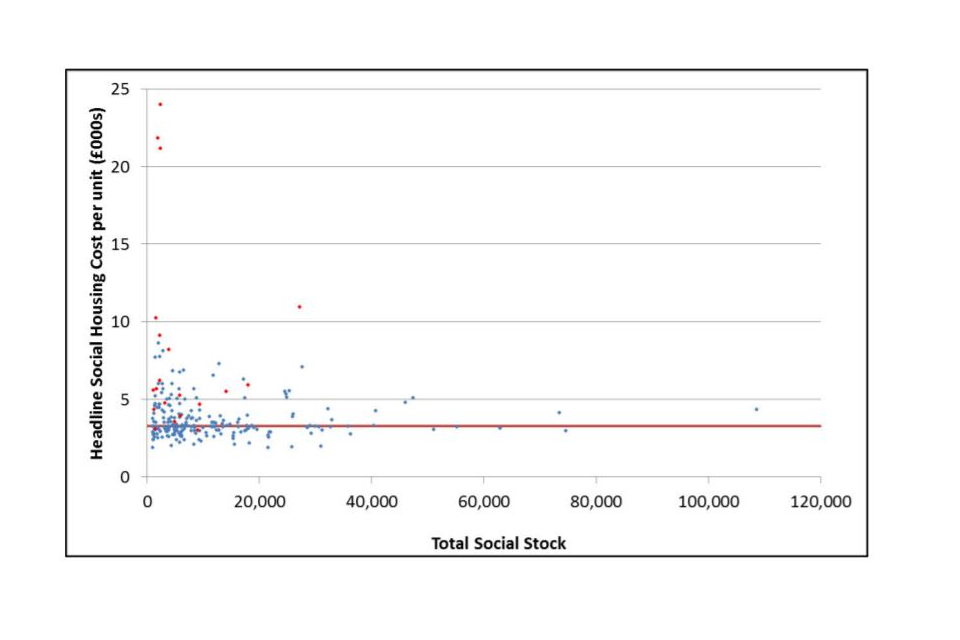
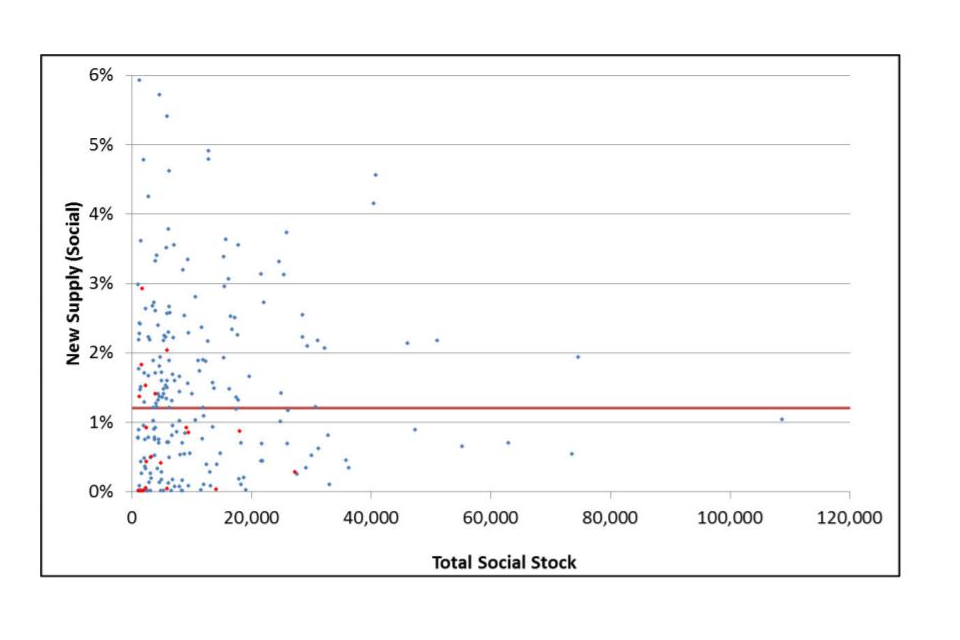
The data shows a wide range of reported performance across each of the metrics with significant variations around the median figure for each metric. To illustrate the extent of the variation, figures 1 and 2 show the overall spread of reported figures for two of the metrics, headline social housing cost per unit, and new supply (social) as a proportion of existing stock.
The mean (weighted average mean) headline social housing cost per unit is £3,780 per unit. The mean figure is influenced by a small number of registered providers with significant volumes of supported housing units, in particular by three supported housing providers which have unit costs of over £20,000 per unit. This compares to the sector median average cost of £3,290 per unit (denoted by the red line in the graph), which is less affected by these high cost outliers. However, as the scatter graph below shows, there remains considerable variation in unit costs between providers.
Figure 1: Headline social housing cost per unit by size of provider (2017)
Red dots denote supported housing providers or housing for older people providers, defined as a provider with greater than 30% housing for older people units/greater than 30% supported housing.
Red dots denote supported housing providers or housing for older people providers, defined as a provider with greater than 30% housing for older people units/greater than 30% supported housing.
The average (mean) level of new supply (social) as a proportion of existing stock across the sector was equivalent to 1.5% of existing stock in 2017, significantly above the sector median of 1.2% (denoted by red line). The difference is driven by a number of registered providers with new supply (social significantly above the average). In total, 26 registered providers delivered new supply (social) above 3% of their total stock owned. There remains a significant minority (circa 10%) of registered providers that deliver little or no new supply (social). Some of these registered providers include those with fewer than 2,500 units, LSVT organisations that are less than seven years old and supported housing/ housing for older people providers. The number of registered providers delivering little or no new supply (social) is smoothed out over a two-year period (2016 and 2017) and dips to circa 3%
Figure 2: New supply (social) % of total social housing units by size of provider (2017)
Red dots denote supported housing providers or housing for older people providers.
Red dots denote supported housing providers or housing for older people providers.
Table 3 sets out the range of performance on the regulator’s metrics across the sector over the past three years (other than for non-social housing supply where data is only available for 2017, and Reinvestment and ROCE where no 2015 data is available).
Table 3: VfM metric quartile data (Source: FVA and SDR 2015-2017)
New supply (social) includes the following types of social housing units only - social rent general needs housing (excluding Affordable Rent), Affordable Rent general needs housing, social rent supported housing and housing for older people (excluding Affordable Rent), Affordable Rent supported housing and housing for older people, Low Cost Home Ownership, care homes, other social housing units and social leasehold.
| VfM metric | Reinvestment | New supply (social) | New supply (non-social) | Gearing | EBITDA MRI interest cover | Headline social housing CPU (£’000) | Op Margin (social) | Op Margin (overall) | ROCE | |
|---|---|---|---|---|---|---|---|---|---|---|
| Upper quartile | 2017 | 8.6% | 2.2% | 0.03% | 54.8% | 278% | £4.36 | 39.3% | 36% | 5.6% |
| 2016 | 8.2% | 2.2% | N/A | 57% | 242% | £4.55 | 36.7% | 33.6% | 5.5% | |
| 2015 | N/A | 2.7% | N/A | 51.1% | 234% | £4.51 | 37.5% | 33% | N/A | |
| Median | 2017 | 5.6% | 1.2% | 0.00% | 43.4% | 212% | £3.29 | 34.7% | 31.4% | 4.3% |
| 2016 | 5.7% | 1.2% | N/A | 44.7% | 177% | £3.60 | 32.1% | 28.2% | 4.1% | |
| 2015 | N/A | 1.5% | N/A | 42% | 170% | £3.65 | 30.8% | 27.5% | N/A | |
| Lower quartile | 2017 | 3.7% | 0.4% | 0.00% | 33.5% | 174% | £2.96 | 28.7% | 25% | 3.5% |
| 2016 | 3.8% | 0.5% | N/A | 33.4% | 133% | £3.24 | 25.5% | 22.6% | 3.3% | |
| 2015 | N/A | 0.6% | N/A | 30.9% | 129% | £3.19 | 25.4% | 22.2% | N/A | |
| Weighted Average (Mean) | 2017 | 7.3% | 1.5% | 0.22% | 45.8% | 169% | £3.78 | 34.3% | 29.7% | 4.3% |
| 2016 | 5.7% | 1.6% | N/A | 45.4% | 170% | £4.05 | 32.1% | 27.7% | 4.2% | |
| 2015 | N/A | 1.9% | N/A | 41.8% | 158% | £4.04 | 31.6% | 27.3% | N/A |
Variations in reinvestment and new supply
The sector currently delivers the vast majority of new affordable homes and increasing numbers of homes for market rent and market sale. As the sector is largely non-profit, it reinvests its surpluses in the delivery of new homes and the refurbishment of existing stock. However, there are wide differences between the providers with the highest level of new supply, and reinvestment (which captures both investment in new supply and investment in the existing stock). There is a persistent difference between the levels of new social housing supply by different parts of the sector, with the lower quartile of registered providers delivering new social homes equivalent to 0.4% of their existing stock in 2017, compared to 2.2% for upper quartile registered providers. Non-social housing supply reported through the FVA is concentrated in only a small number of organisations, with the upper quartile of providers delivering non-social supply equivalent to 0.03% of their existing social stock, but with the median provider delivering none at all.
A similar pattern exists with regard to reinvestment in general. Excluding the providers affected by this issue, upper quartile reinvestment figures were 8.6% of the value of existing stock. For the lower quartile of providers reinvestment was only 3.7% of the value of existing stock.
The similarity between the pattern of new supply and reinvestment in general is unsurprising as the reinvestment measure takes account of investment in existing stock (which includes capitalised major repairs) and acquisition or development of new properties. The majority of this reinvestment, across the sector as a whole, was in new development in 2017 (worth on average 6.1% of the value of the existing stock), rather than in the existing stock (1.1% of the value of the stock spent on works to existing stock). There is therefore a correlation between performance on social housing supply and reinvestment.
Variations in debt-based metrics
Although there are variations between different groups of providers, the sector as a whole shows strong interest cover. Median interest cover was 212%. Even the lowest quartile of providers reported interest cover of 174% in 2017, rising to 278% amongst the upper quartile.
The sector average EBITDA MRI interest cover in 2017 is influenced by one registered provider as a result of finance costs incurred at the time of merger. The removal of this registered provider from the dataset shows that EBITDA MRI interest cover would increase from the sector weighted average of 169% to 196%, bringing it much closer to the sector median which demonstrates the sector’s continued financial strength which could service additional debt and support continued investment.
While individual providers’ financial capacity will be affected by factors that will not be immediately visible from these reported figures (particularly the terms of their existing loan covenants) the range of gearing figures reported suggests a relatively higher level of gearing amongst the upper quartile of providers, which may in some cases affect their ability to take on more debt. The reported upper quartile gearing in 2017 was 54.8%.
Variations in cost and efficiency measures
As discussed in the regulator’s Value for Money Metrics Technical Note we have changed the calculation of the headline social housing cost per unit metric in response to feedback from the sector (the definition of headline social housing cost has been updated so that the units are inclusive of total social housing units owned and/or managed at period end - from managed units only). This means that the figures included in this publication are not directly comparable with those published in the 2017 Global Accounts, but the overall pattern remains the same. In 2017, the median cost per unit stood at £3,290 per unit. There is not a wide variance between the least expensive providers and the median, with the lowest cost quartile of providers reporting costs of £2,960 per unit. However costs were materially higher for the most expensive quarter of providers, with the upper quartile of providers reporting costs of £4,360 per unit. The likely reasons for this are reported later in this publication.
A broadly similar pattern applies to the distribution of performance on social housing operating margins and return on capital employed. Again this is relatively unsurprising given that operating cost performance feeds directly into the calculation of both measures. It is noticeable that the overall operating margin (including non-social housing activities) is lower than the social housing only operating margin. This is true for all quartiles of performance. There is a principal explanation for this pattern. The operating margin (social housing only) is high, relative to the other activities undertaken by the sector. However, social housing lettings is capital intensive and the majority of debt held by the sector has been raised to fund this activity. As operating margins do not include interest payable, a direct comparison of operating margins across different activities does not represent a valid comparison of relative profitability.
How has the sector’s performance on the Value for Money metrics changed from 2015-2017?
In the three years to 2017, the trajectory of the sector’s performance based on the VfM metrics has remained relatively stable, although the impact of a number of key policy events is visible from the data. Providers have faced financial pressures as a result of the policy requiring them to reduce their rents by 1% per annum from April 2016 for four years (low cost home ownership units are exempt from the rent reduction. Rent from supported units was exempt from the rent reduction in 2016/17. The rent reduction will apply to supported housing from 2017/18). However, this has been offset by a generally benign economic climate over these years, characterised by historically low interest and inflation rates, and, in much of the country, a buoyant housing market providing increased revenues from sales of shared ownership and, in some cases, open market sale properties.
Reinvestment
The sector mean average reinvestment levels increased by 1.6 percentage points between 2016 and 2017, rising from 5.7% to 7.3% of the value of the existing stock. However, this was primarily due to the increased number of mergers that took place in 2017. Where mergers have taken place, existing social housing properties entering the new group for the first time, are recorded as acquisitions. This led to a minority of merged providers having apparent reinvestment figures of over 20% and has inflated the figure for the sector as a whole. Excluding the mergers, the mean average sector reinvestment level between 2016 and 2017 remained stable at 5.7%, closer to the sector median.
Relative to the overall increase in reinvestment levels year on year, are significant shifts in the underlying elements of the measurement. This includes a reduction in works to existing properties (as a proportion of total property value) from 1.8% to 1.1% (the breakdown with merger providers removed is 1.2% works to existing properties and 4.5% new development and capitalised interest expenditure). This was offset by an increase in new development and capitalised interest expenditure (inclusive of properties acquired, new development properties, schemes completed and capitalised interest payments) which increased from 3.9% in 2016 to 6.1% in 2017. As noted above, this has been enhanced by merger providers due to the recognition of additional properties acquired in 2017.
Our engagement with registered providers suggests that the reduction in expenditure relating to works to existing properties was a response to the rent reduction as required under the Welfare Reform and Work Act 2016 (WRWA). Some registered providers delayed non-essential major repairs works until they had greater certainty around a future rent settlement.
New supply
New supply (social)15 delivery fell from 1.9% of existing stock in 2015 to 1.5% of existing stock in 2017. The drop is likely to be associated with the timing of the Affordable Homes Programme, which saw delivery peak in the final year of the 2011-15 grant programme, and was followed by a drop in activity as the subsequent programme took time to get underway.
(New supply (social) includes the following types of social housing units only - social rent general needs housing (excluding Affordable Rent), Affordable Rent general needs housing, social rent supported housing and housing for older people (excluding Affordable Rent), Affordable Rent supported housing and housing for older people, Low Cost Home Ownership, care homes, other social housing units, and social leasehold.)
Figure 3: New supply (social): Change in quartiles 2015-2017
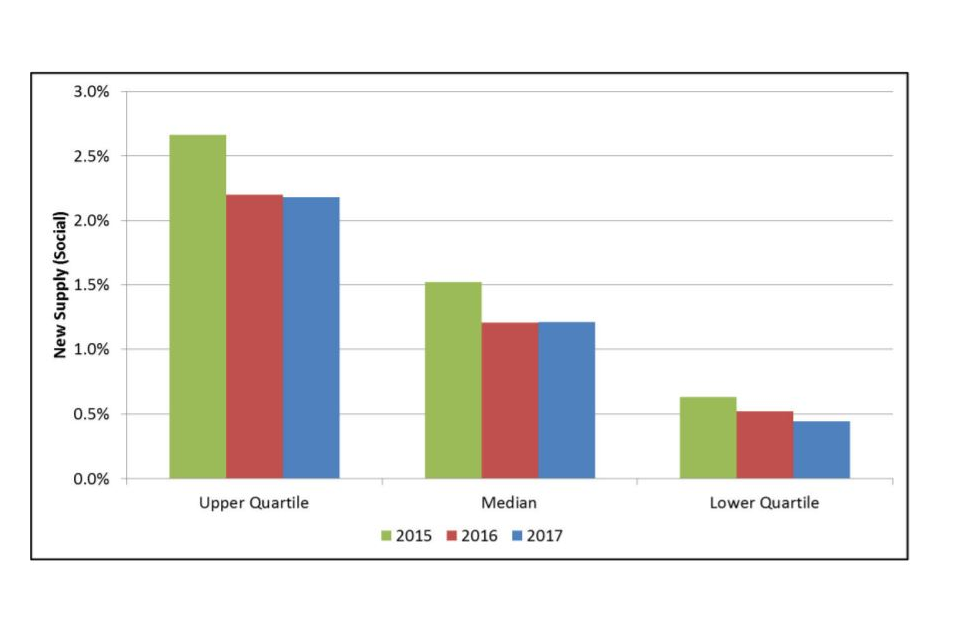
New supply (social) includes the following types of social housing units only - social rent general needs housing (excluding Affordable Rent), Affordable Rent general needs housing, social rent supported housing and housing for older people (excluding Affordable Rent), Affordable Rent supported housing and housing for older people, Low Cost Home Ownership, care homes, other social housing units, and social leasehold.
In 2017, the sector delivered 40,000 new affordable homes and the weighted sector average for new social supply was equivalent to 1.5% of existing stock in 2017. This new supply (social) figure recorded here is a gross figure, and will, to an extent, be offset by losses to the sector (for example through planned disposals, or sales to tenants) or to the housing stock altogether (for example through demolitions). However, to help contextualise this level of development, this compares to an increase in total number of dwellings in England of 0.9% and 0.6% increase in the population of England in the same year.
Debt-based metrics
There is a contrasting picture across the two debt-based metrics. Gearing has increased throughout the sector over the past three years. Gearing for the least indebted (lower quartile) registered providers rose from 30.9% in 2015 to 33.5% in 2017, and for the most indebted (upper quartile) registered providers from 51.1% to 54.8% in 2017, as registered providers take on additional debt to invest in their properties. EBITDA MRI interest cover on the other hand has generally strengthened, with the lower quartile of registered providers seeing an increase from 129% in 2015 to 174% in 2017, and the upper quartile an increase from 234% to 278% over the same period. This increase has been largely supported by the cost savings and economic trends outlined above. For the lower quartile in particular, this is due to the maturing of the LSVT sub-sector.
Headline social housing cost per unit
Figure 4: Headline social housing cost: Change in quartiles 2015-2017
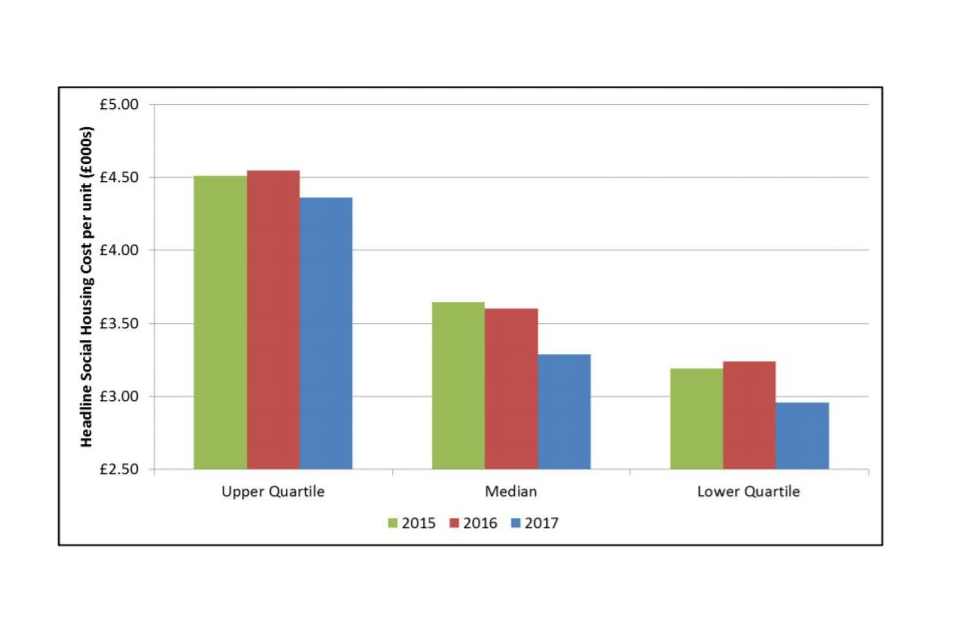
Figure 4: Headline social housing cost: Change in quartiles 2015-2017
In recent years, pressure on rental income has also led most providers to drive down costs and seek operational efficiencies. Reductions in headline social housing cost per unit have been recorded across each of the quartiles. Between 2015 and 2017 the average (mean) headline social housing cost has reduced by 6.4% from £4,040 to £3,780 per unit. A significant part of the reduction in costs is due to a deferral of major repair expenditure in the period following the rent cuts.
Operating margins
Figure 5: Operating margin (overall): Change in quartiles 2015- 2017
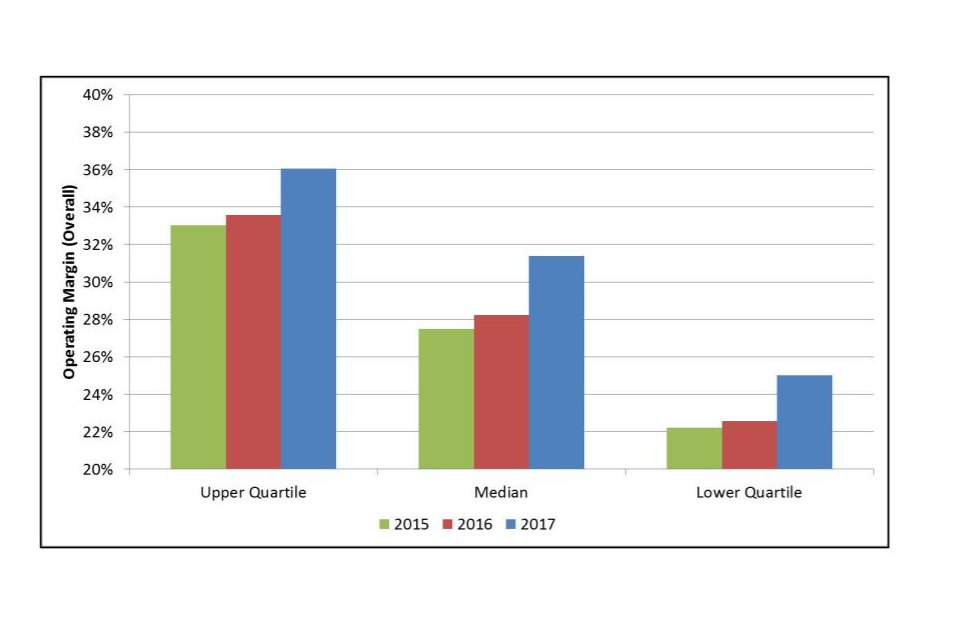
Figure 5: Operating margin (overall): Change in quartiles 2015- 2017
In each of the last two years, operating margin (overall) has increased across all three of the quartile measures; with the median now standing at 31.4%, up from 28.2% in 2016 and 27.5% in 2015.
Between 2015 and 2016 the increase to the operating margin (overall) was driven primarily by an increase in turnover (turnover includes rental income from social housing and non-social housing plus shared ownership and properties developed for outright sale). In contrast, the increase in operating margin (overall) between 2016 and 2017 was driven by a reduction in expenditure. In addition between 2015 and 2017, turnover per unit dipped by 0.9% following the 1% rent reduction on general needs units and the dip in the revenue from properties for sale due to a change in accounting for joint venture income by one provider - see 2017 Global Accounts. However, the operating surplus per unit increased by 6.4%, because of falling costs.
What are the factors influencing differences in performance on the Value for Money metrics?
The regulator has undertaken regression analysis to explore some of the potential explanations for the variation observed in performance across the sector. This builds on previously published regression analysis of the drivers behind variations in operating costs to help registered providers’ understanding of cost drivers, and assist them in the effective management of their businesses. Demonstrating the range of variation in the sector, and the identifiable explanations for this variation, can also help reinforce the transparency driven approach required as part of the new VfM Standard.
The analysis in this section of the report is also based on the 2017 Global Accounts dataset (other than the specific omissions described above). It is important to bear in mind that this single year’s data represents a snapshot of the sector’s activity, and that providers’ capital investment in particular can rise and fall significantly from one year to another according to the timing of providers’ asset management cycles including development, regeneration and major repair programmes. Nevertheless, the regression analysis produces conclusions which are broadly consistent with the regulator’s experience of how providers’ business models, size and geographical location influence their performance.
The analysis considers the statistical relationship between reported performance on the metrics and a number of key explanatory variables. These include:
- size of the organisation
- proportion of supported housing stock and housing for older people
- geographical distribution of stock
- deprivation (as measured by the Index of Multiple Deprivation - A provider operating in neighbourhoods ranked in the 1% most deprived according to the Index of Multiple Deprivation has costs around £500 per unit higher than average)
- whether the organisation is a LSVT provider, and where this is the case, the number of years since transfer from the local authority sector.
The methodology used in the regression analysis is set out in more detail in the accompanying Technical Report.
The ability of these factors set out above to explain variation in performance differs from one metric to another. Around 54% of the headline social housing cost variation can be explained by the seven variables in the streamlined model (the standardised regression model which includes the most powerful explanatory variables in terms of explaining the variation across each of the value for money metrics). In contrast only 16% of the variation can be explained for new supply (social) and 9% of the variation for new supply (non-social). The regression analysis nevertheless shows a number of statistically significant relationships (at 95% confidence level) between the range of performance on these measures and key explanatory variables. These relationships produce potentially valuable insights into the drivers of performance amongst different types of provider, and can help registered providers and other stakeholders understand some of the factors shaping differential performance on the metrics.
Table 4 shows the explanatory power of the regression models and identifies which factors have the greatest influence on performance on each of the metrics. A positive figure shows a positive relationship (for example, a rise in the proportion of supported housing is associated with a rise in headline social housing cost per unit), and negative figure shows a negative relationship (for example, a rise in the proportion of housing for older people is associated with a fall in operating margin).
Table 4: Regression analysis: Overview
| VfM metric | Streamlined model | Most influencial factors* | ||
|---|---|---|---|---|
| R^2 (explanatory power of the model) | First | Second | Third | |
| Reinvestment | 0.23 | LSVT 7-12 years (DV)** (+) | LSVT <7 years (DV)** (+) | % Supported housing (-) |
| New supply (social) | 0.16 | Index of Multiple Deprivation (% rank) (-) | LSVT <7 years (DV)** (-) | % Housing for older people (-) |
| New supply (non-social) | 0.09 | Total social stock (000s) (+) | Index of Multiple Deprivation (% rank) (-) | LSVT <7 years (DV)** (-) |
| Gearing | 0.24 | % Supported housing (-) | Index of Multiple Deprivation (% rank) (-) | % Housing for older people (-) |
| EBITDA MRI interest rate cover | 0.10 | Index of Multiple Deprivation (% rank) (+) | % Housing for older people (+) | LSVT 7-12 years (DV)** (+) |
| Headline social housing cost | 0.54 | Regional wage index (Combined) (+) | % Supported housing (+) | LSVT <7 years (DV)** (+) |
| Operating margin (social) | 0.35 | Index of Multiple Deprivation (% rank) (-) | % Housing for older people (-) | % Supported housing (-) |
| Operating margin (overall) | 0.39 | % Supported housing (-) | Index of Multiple Deprivation (% rank) (-) | % Housing for older people (-) |
| ROCE | 0.27 | % Supported housing (-) | LSVT 7-12 years (DV)** (+) | Regional wage index (Combined) (-) |
(+) indicates a positive relationship between the variable and the VfM metric.
(-) indicates a negative relationship.
*Most influential factors using Streamlined Regression Model with standardised variables. Value underneath each variable is the standardised coefficient.
**Standardised regression highlighted as influential factor - however there are potential issues using dummy variables (DVs) in standardised regression models so results must be interpreted with caution.
The following section summarises some of the key statistically significant relationships.
Reinvestment
LSVT categorisation is the most influential factor driving levels of reinvestment. LSVT providers have reinvestment levels significantly above the sector average, as they complete major repairs commitments made at the time of transfer. All else being equal, in years 1-6 post-transfer reinvestment is 132% higher than a comparable traditional provider; reducing to 76% for LSVT providers 7-12 years after transfer.
The next biggest factor in explaining the variation in reinvestment is a registered provider’s level of supported housing. Registered providers with 30% supported housing properties have reinvestment levels on average, 20% lower than registered providers with solely general needs stock. This appears to be driven by significantly lower levels of investment in new development and capitalised interest expenditure, as opposed to lower investment in existing stock (once other influential factors such as LSVT status have been taken into account). The higher costs and lower operating margins associated with owning and/or managing supported housing stock mean that fewer resources are likely to be available for new development.
New supply (social)
Average (median) new supply as a percentage of total social stock is 1.2%. There is a significant relationship between deprivation and new supply (social). All else being equal, a hypothetical provider whose stock was all in the most deprived percentile according to the Index of Multiple Deprivation could be expected to develop 76% less new social supply than those operating in the least deprived percentile. This is likely to be driven by three factors: more deprived areas tend to have higher costs associated with more extensive regeneration and community initiatives, higher voids and tenancy turnover. The turnover per unit is also lower in more deprived areas, due to typically lower rents, meaning that operating margins are significantly lower and thus capacity to develop is curtailed. Alongside this, while it is not universally the case, demand for housing tends to be lower in deprived areas. This is likely to further reduce development activity.
Holding other factors constant, an LSVT organisation in its first seven years typically delivers 79% less new supply (social), in comparison to a traditional provider. Early years transfers typically have higher costs, associated with the completion of post-transfer maintenance and major repairs works, and lower turnover, as local authority rent levels tend to be below those in housing associations, meaning that they have limited capacity to focus on the development of new supply.
Gearing
The supported housing and housing for older people variables have a significant impact on gearing levels. All else being equal, a registered provider with 30% supported housing would have gearing levels 30% lower than that of an equivalent general needs registered provider. In comparison, the regression suggests that a registered provider with 30% housing for older people stock will typically have gearing levels 17% lower than a general needs registered provider. This is driven by a handful of providers that hold very low levels of debt. Due to the profile of these registered providers who tend to have high costs and very low operating margins, this could limit their financial capacity to take on debt for reinvestment. This explains their lower gearing levels.
Headline social housing cost
The latest regression analysis of the drivers of headline social housing cost is broadly consistent with our previous analysis on unit costs. Each unit of supported housing is associated with costs of £6,700 above general needs properties. This is likely to be linked to the high support costs and a broader scope of activities undertaken by organisations with a specialised focus. The precise estimate of associated costs is sensitive to the inclusion or removal of more specialised supported housing organisations – with model estimates increasing to £10,800 when all outliers are included. There is likely to be considerable diversity with the cost associated with each supported housing unit in the sector, for example by the client group and the level of service supplied. The equivalent figure for housing for older people is £1,400.
Cost differences in registered providers operating in different regions broadly follow the differences in underlying regional wages, once all factors are taken into account. The average coefficient from the streamlined regression means that, all else being equal, registered providers in London have average costs of £2,600 per unit above the North East (the baseline headline social housing cost per unit is £3,300. This is based on a traditional registered provider with the median number of units all of which are general needs, operating in an area with average deprivation and wages. It is composed of the regression intercept (£2,900) plus the effect of average neighbourhood deprivation and stock holding).
Operating margin (overall)
Given that operating margins are directly affected by operating costs, it is unsurprising that variability in operating margins is closely associated with the same factors that drive variation in headline social housing costs. A registered provider with 30% supported housing units will have, on average, an operating margin (overall) of 21.9%. This compares to an operating margin (overall) of 35% (this is based on a traditional registered provider with the median number of units all of which are general needs, operating in an area with average deprivation and wages for a registered provider with only) general needs units. This is linked to the higher costs associated with providing support and also to the fact that a larger proportion of supported providers’ income comes via service charges which can only cover costs incurred.
The relationship is the same for housing for older people providers, although the difference is not as pronounced. The operating margin (overall) for a registered provider with 30% housing for older people units is 30.5% which is 13% lower than that of a general needs provider.
Higher costs and lower rental levels, driven by lower property prices and lower wages, alongside typically lower demand for social housing properties means that operating margins (overall) are lower in more deprived areas. A hypothetical provider with stock entirely located in the most deprived percentile according to the Index of Multiple Deprivation could be expected to have an operating margin (overall) of 30.5%. This compares to 45.5% for a provider with stock wholly in the least deprived percentile.
How do different categories of provider vary on the Value for Money metrics?
Taken together, the relationships identified through the regression analysis help to explain some of the characteristic differences that are visible between different types of provider. The different metric performance for some of the main types of the providers are shown in Table 5.
Table 5: 2017 VfM metric medians: Segmented by size and cost factors (Source: 2017 FVA and SDR)
| Quartile data | No. of providers | % of sector (social units owned) | Median | ||||||||||
|---|---|---|---|---|---|---|---|---|---|---|---|---|---|
| Reinvestment | New supply (social) | New supply (non-social) | Gearing | EBITDA MRI Interest Cover | Headline social housing CPU (£’000) | Operating Margin (social) | Operating Margin | ROCE | |||||
| All returns | 229 | 100.0% | 5.6% | 1.2% | 0.00% | 43.4% | 212% | £3.29 | 34.7% | 31.4% | 4.3% | ||
| Cost Factor | LSVT <7 years | 7 | 2.0% | 12.0% | 0.1% | 0.00% | 32.8% | 145% | £4.24 | 27.2% | 27.2% | 5.4% | |
| LSVT 7-12 years | 25 | 8.6% | 10.0% | 1.3% | 0.00% | 41.4% | 274% | £3.32 | 33.4% | 31.2% | 6.1% | ||
| London | 31 | 12.8% | 5.7% | 1.4% | 0.00% | 34.4% | 212% | £5.51 | 33.4% | 29.2% | 3.7% | ||
| SH provider | 10 | 1.4% | 3.3% | 1.2% | 0.00% | 14.5% | 238% | £5.94 | 20.4% | 15.4% | 2.6% | ||
| HOP provider | 10 | 3.2% | 5.8% | 0.2% | 0.00% | 32.2% | 268% | £5.53 | 22.6% | 18.1% | 4.3% | ||
| Size (social units owned) | >30,000 | 19 | 33.1% | 4.8% | 0.8% | 0.05% | 42.4% | 227% | £3.27 | 36.8% | 29.7% | 4.4% | |
| 20,000-29,999 | 17 | 15.9% | 5.7% | 1.4% | 0.12% | 44.2% | 222% | £3.21 | 35.5% | 32.9% | 4.1% | ||
| 10,000-19,999 | 47 | 26.2% | 5.7% | 1.5% | 0.00% | 46.1% | 196% | £3.22 | 33.8% | 31.1% | 4.4% | ||
| 5,000-9,999 | 59 | 15.3% | 6.7% | 1.4% | 0.00% | 48.0% | 246% | £3.29 | 37.0% | 33.3% | 5.1% | ||
| 2,500-4,999 | 47 | 6.8% | 5.3% | 1.0% | 0.00% | 49.0% | 190% | £3.53 | 33.6% | 29.7% | 4.5% | ||
| < 2,500 | 40 | 2.7% | 4.0% | 0.9% | 0.00% | 30.4% | 248% | £3.65 | 31.5% | 28.0% | 3.7% |
Large scale voluntary transfers
LSVT providers are principally characterised by very high levels of reinvestment. While the median level of reinvestment in new homes and existing stock across the sector is 5.6% of the value of the existing stock, this rises to 10.0% for LSVTs between 7-12 years from transfer and as high as 12.0% for providers in the first seven years after transfer. These organisations are contractually obliged to undertake major improvement works to the properties transferred and therefore have the highest rates of reinvestment in the sector. However, because their resources are taken up by the need to deliver these transfer promises, relatively little can be spared for investment in new supply with the youngest group of LSVTs only developing new social housing equivalent to 0.1% of their existing stock.
For LSVT providers in their first seven years after transfer, 84% of their reinvestment is attributable to works to existing properties, compared to a sector average of 15%. Previous analysis by the regulator has shown that, once LSVT organisations reach 12 years from transfer they are not significantly different from traditional providers in terms of their costs and financial profile. Their development activities also become more typical of the sector as a whole, with LSVT providers between 7-12 years delivering new social supply equivalent to 1.3% of their existing stock, a figure slightly higher than the sector median.
The median level of gearing across the sector is 43%. For LVST providers that are less than seven years of age, the figure is 33%, reflecting the fact that they had lower initial valuations than historic LSVT providers. Thus their debt peaks in later years in their business plans.
Supported housing
(Supported housing providers are defined as providers with over 30% of supported housing units for the purposes of this analysis.)
The median level of gearing for supported housing providers is 14.5%. Such providers tend to have less financial capacity to support debt. This may help to explain why their reinvestment rates are somewhat lower than the sector as a whole. As the regression analysis suggested, this lower level of investment is primarily because this group of providers invests less in new supply, rather than suggesting a lower level of investment in the existing stock. More surprisingly, the level of new social supply outputs in this group as a whole is in line with the sector median. However, much of this new supported housing supply is concentrated amongst a small number of providers.
Housing for older people
Housing for older people (HOP) providers have similar characteristics to supported housing providers. Their costs tend to be higher, with the regression analysis suggesting that, all things being equal, each additional HOP unit is associated with costs of circa £1,400 above general needs units. They similarly have lower operating margins compared to the sector as a whole and lower gearing. This group of providers have higher levels of reinvestment in comparison to the sector median. This reinvestment is primarily in the existing stock, rather than in new supply. The high reported reinvestment figure for 2017 is driven by a small number of providers with large major repair and development programmes.
Registered providers – London based
Registered providers with 100% of social housing stock based in London have average costs of circa £2,600 per unit above providers in the North East*. They also have lower operating margins, partly as a result of these higher costs. However, because rents also tend to be higher in London than elsewhere, the gap between London operating margins and the average is not as marked as it is on cost per unit. This means that London based registered providers do not appear to be significantly constrained in investing in existing stock and new homes. Reinvestment is generally in line with the sector median of 5.7% as a proportion of the asset base, while new supply (social) housing as a proportion of total stock by London providers is above the sector median at 1.4% (sector median: 1.2%)
*The variability in costs associated with operating in different regions is calculated using a regional wage index, formulated using ASHE regional wage data and SDR data on stock location. A registered provider only has the highest ASHE wage index (1.25), and therefore additional cost of £2,600 (compared to a provider in the North East), if all their stock is based in the highest cost region, London. A London based registered provider with stock in other regions would have to take this into consideration when calculating the additional costs associated with their business.
Organisational size
The relationship between organisational size and the metrics is complex. It is hard to discern clear patterns with regard to either the debt metrics (gearing and interest cover) or efficiency measures such as operating margin and return on capital employed. In particular there is no simple relationship between size and either cost or the level of new supply. In 2017, the lowest levels of reported social housing supply were amongst the very largest providers (those with over 30,000 units, who developed new social supply equivalent to 0.8% of their existing stock) and the very smallest (those with fewer than 5,000 units, who developed new social supply equivalent to 1% of their existing stock). Mid-sized providers with between 5-30,000 units tended to develop at levels around 1.4-1.5% of their existing stock. Gearing amongst this group tended to be higher, potentially as a result of the higher levels of development.
Over a longer period, the difference between the largest registered providers and the sector median on social supply is less marked with the largest registered providers delivering supply equivalent to 1.2% of existing stock per annum over the three years 2015-17, compared to a sector median of 1.4% over the same period (three year sector median new supply - social). The reasons for this consistent difference may in part be suggested by the results of the regression analysis. This found that the most influential factor of New Supply (social) was deprivation. All things being equal, a registered provider operating only in the most deprived percentile according to the Index of Multiple Deprivation could be expected to develop 76% less new supply (social) in comparison to those registered providers operating solely in the least deprived percentile. A majority (58%) of registered providers with total stock above 30,000 units operate in areas where the average deprivation levels are in the highest quartile, this compares to only 37% of registered providers with fewer than 30,000 units.
The very largest registered providers (greater than 30,000 units) who operate primarily in London and the South East tend to deliver higher new supply (social) levels than their peers. However, these registered providers all operate in areas where deprivation is below the sector average and have an average (unweighted) new supply (social) figure of 2.7%. Controlling for other modelled factors such as region and deprivation, the regression analysis found no simple statistically significant relationship (positive or negative) between size of provider and new social supply.
Registered providers with greater than 20k units were more likely to develop non-social housing in 2017.
As the regulator has previously found in its unit cost regression work, there is also little clear relationship between size and headline social housing cost per unit. Although the smallest providers (fewer than 5,000 units) had reported costs above the sector median, there is relatively little difference in costs between mid-sized and larger providers.
Conclusions
The new Value for Money Standard expects boards to understand their own performance and how it compares to their peers. The analysis in this publication should help boards to achieve this task, and in particular to assess how their own organisation’s performance compares to those of a comparable peer group.
The regression analysis is a powerful tool to test the evidence that the average VfM metrics will vary with measured factors and should help boards to appreciate some of the key factors that can shape the performance of individual organisations.
However, this analysis can only provide a partial picture, and cannot substitute for an organisation’s own understanding of its operating environment and its use of resources and assets. Boards will need to consider a wider range of evidence to fully understand the drivers of their own costs and resources. While the regression analysis can explain some of the variability between providers, it leaves much unexplained. In some cases, accounting policies may affect relative performance on some metrics. The regulator does not collect systematic data on all of the factors that could drive variations in reported performance. For example, we do not hold systematic data on service levels or stock condition, which is likely to drive differences in reinvestment, unit costs and operating margins in particular. It may be that some of these missing factors have more of a bearing on variations in the other metrics than they do on headline social housing cost per unit.
For some of the other measures there is also greater potential for the variation to be explained by board and management decisions, as opposed to the characteristics of the organisation. For example, investment activity is likely to be influenced by a range of variables beyond the measurable characteristics of the organisation itself. These factors could include the demand for particular types of housing in the organisation’s area of operations, the availability of land and section 106 contributions from private developers, as well as the priorities and risk appetite of the board. In addition, development outputs can be relatively volatile from year to year given the way in which developments tend to be phased. This makes it more difficult to draw conclusions from the data on development than for some of the other variables.
Looking at value for money is not a simple task. This analysis provides evidence that can inform the debate about the potential to deliver greater value for money in the sector. The real question for boards is how they decide on the value they are trying to deliver and how they measure and demonstrate it to key stakeholders including tenants, local communities and others.
© RSH copyright 2020
This publication is licensed under the terms of the Open Government Licence v3.0 except where otherwise stated. Where we have identified any third party copyright information you will need to obtain permission from the copyright holders concerned.
Any enquiries regarding this publication should be sent via enquiries@rsh.gov.uk or call 0300 124 5225 or write to:
Regulator of Social Housing
Level 2
7-8 Wellington Place
Leeds LS1 4AP