A scoping study on the valuation of risks to life and health: the monetary Value of a Life year (VOLY)
Published 28 July 2020

© Crown copyright 2020
This publication is licensed under the terms of the Open Government Licence v3.0 except where otherwise stated. To view this licence, visit nationalarchives.gov.uk/doc/open-government-licence/version/3 or write to the Information Policy Team, The National Archives, Kew, London TW9 4DU, or email: psi@nationalarchives.gov.uk.
Where we have identified any third party copyright information you will need to obtain permission from the copyright holders concerned.
This publication is available at https://www.gov.uk/government/publications/valuation-of-risks-to-life-and-health-monetary-value-of-a-life-year-voly/a-scoping-study-on-the-valuation-of-risks-to-life-and-health-the-monetary-value-of-a-life-year-voly
List of authors
Newcastle University:
Susan Chilton
Michael Jones-Lee
Hugh Metcalf
Jytte Seested Nielsen
Glasgow Caledonian University:
Rachel Baker
Cam Donaldson
Helen Mason
Neil McHugh
University of Birmingham:
Rebecca McDonald
Independent Consultant
Michael Spackman
The authors are grateful for research assistance from:
Maddison Moore and Cameron Bateman
Key messages
Policy Facts
It is a fundamental duty of government to implement policies that improve social welfare. Policies that affect risks to human life and health are often cross-cutting in departmental reach and are examples of how welfare can be improved.
Risks to life and health range from risks of immediate harm (for example, traffic or work-related accidents) to lifetime risks (for example, air pollution impacts, latent cancers) and uncertain, future risks (for example, climate change; global trade-related food safety).
It is also the government’s duty to deliver ‘value for money’. This requires valuation of these different types of risk reductions. Her Majesty’s Treasury ‘Green Book’ guidance sets out different approaches to valuing life and health impacts:
- Value of a Prevented Fatality (VPF): values small changes in fatality risks
- Value of Statistical Life Year (value of a SLY or VOLY): values the impact of risks to the length of life
- Quality Adjusted Life Year (QALY): values changes in health-related quality of life and length of life
Findings
Currently, recommended Green Book values for the VPF and the monetary value of a QALY are based on a very small sample-survey of the UK public carried out in the 1990s. The only UK study to directly elicit a VOLY is also outdated, but was carried out on larger sample. Updated values for changes in longevity derived from a broadly representative sample of the UK population would better reflect current preferences.
Due to the limited number of UK Value of Life Year (VOLY) studies, a VOLY cannot be generated from secondary data. Appropriate revealed preference/behavioural data does not exist in the UK to estimate a VOLY. As such, a stated preference survey drawing on the most up to date methodological practices is the only viable option.
This report finds that a VOLY can be derived that has a clear conceptual link to the monetary value of a QALY and VPF. It also finds that the 3 measures can be empirically derived from a common source, reflecting the same underlying preferences over health and safety. This maximises consistency across policy Appraisals but allows flexibility and choice over the valuation measure government departments use. Whilst other valuation methods are available to elicit these values separately or indirectly exist, this report finds that the proposed framework delivers the most clarity in this respect. Empirically, the proposed method has benefited from recent developments and improvements.
Conclusions
Longevity valuation is evolving and future research will improve our understanding of this complex issue. However, the technology exists now to generate a theoretically robust, evidence-based and updated valuation of risk to human life and health.
Applying such values would lead to better and more informed policy decisions and would have major implications not only for efficiency of government spending but also for equity in population well-being.
Executive summary
Context
Risks to life, longevity and health can be monetised for policy analysis. The Project Group Consortium brought together by the Health and Safety Executive (HSE) has a particular concern with the robustness of the monetary value placed on reducing risks to longevity: the value of a life year.
The focus of this report is to assess the need for and feasibility of undertaking new large-scale primary research to update the Value of a Life Year (VOLY) and Willingness-To-Pay for a Quality Adjusted Life-Year (WTP-QALY), used by the UK government Departments and Agencies.
In particular, it addresses the question of whether a VOLY that is compatible with a Value of a Prevented Fatality (VPF) and WTP-QALY could be elicited directly on the basis of current theoretical and empirical practice.
Method
The methodology for this scoping study comprises 3 distinct phases:
- literature reviews: a set of literature reviews addressing 5 broader and overarching research questions (RQs I, II, III, IV and V) which were set out in the Tender and are presented in the Annexes to this report and referred to below
- synthesis: based on the literature reviews and in-depth team discussions agreement and conclusions were drawn on:
- the need for and feasibility of undertaking new primary research and the most appropriate methodology
- derivation and development of the underlying conceptual framework
- strengths and limitations of the associated empirical methods
- additional issues with respect to policy application in practice that are both cross-cutting and not restricted to any particular valuation methodology
- report: content derived from a combination of phases I and II.
Each section of the report addresses specific questions and/or issues arising from phases I and II above.
Can a reliable VOLY be derived from existing studies? (Section 2)
A review of the relevant literature (RQI) noted the significant variation in VOLY values and heterogeneity of methods precluded the identification of a VOLY value robust and reliable enough for future policymaking. Significant differences in timing, value elicitation and risk communication methods, amongst other things, meant that a robust value could not be identified. 3 studies did generate a value close to current value £60,000 for the monetary value of a QALY or VOLY but some fundamental concerns were raised with respect to their reliability for policy purposes. Similarly, it was noted that whilst there were a few primary studies converging around a value of £30,000 to £40,000, these were too few in number and varied too much in terms of timing and/or methodology to provide a reliable corpus of studies as a whole. In the UK, we found only 3 primary VOLY studies and 3 primary UK WTP-QALY studies.
Studies were also compared using a qualitative-based assessment framework to establish whether a particular study or studies could be considered to generate a reliable, gold-standard value from a methodological point of view. The primary purpose of this approach was to allow each study to be assessed in a consistent manner across a range of relevant factors, as opposed to generating an (implied) ranking of one study over another. At the most general level, it was noted that this assessment identified a wide variety of practices with respect to overall design and that it was not really possible to assess how these differences might affect convergence or divergence of any resulting VOLY.
RQI also reviewed the WTP-QALY literature using similar procedures with a view to establishing the degree of consistency amongst estimates and procedures and/or establishing whether a VOLY could be derived from this literature instead. For reasons similar to those outlined already, it was concluded that a VOLY robust enough for future policymaking could not be derived from this literature.
Thus, no reliable UK VOLY or WTP-QALY can be derived from existing stated preference (or revealed preference) studies (RQI), either from a reference ‘gold standard’ study nor a meta-analysis of existing UK VOLY and WTP-QALY studies.
Given recent methodological advances in mortality risk valuation practice, we recommend that new primary research is required to update the current values, which, as noted, are based on 2 dated studies.
Can a new primary VOLY be elicited? (Sections 2, 3)
The report develops and sets out a unifying framework that demonstrates a conceptual link between the VPF, VOLY and WTP-QALY, bringing together the 2 traditions underpinning the calculation of these values. This framework is developed in the context of a one-period model. In principle, it could be adapted to accommodate multi-period risk reductions (RQII; RQV).
Alternative methods to the one proposed do exist (RQII). For example, a VOLY can be indirectly estimated from a VPF (Mason et al., 2008) as could a WTP-QALY although this would require further adjustment. Other methods are not demonstrably superior to the method proposed in this report; and some would require more significant methodological development.
We recommend a ‘chained approach’ as the preferred method to deploy in a survey to directly elicit a VOLY. This involves:
- a 2-stage process to generate the value of a life expectancy gain which establishes how mortality risk reductions and/or improvements in health (policy deliverable) are converted into gains in life expectancy (policy outcome)
- the estimation of a value function that encompasses life expectancy gains from a few hours to a few months, reflecting a broad class of policy outcomes
- an empirical application based on WTP, Standard Gamble (SG) and Time-Trade-Off (TTO) data, analysed in combination
It has a number of advantages over other methods:
- the chained approach breaks the valuation process down into 2 steps that are conceptually and cognitively more manageable than direct valuation
- elicited values map directly and transparently to the conceptual framework
- VOLY, VPF and WTP-QALY values are derived from the same data set i.e. from the same underlying preferences, so any observed differences in values cannot be driven by differences in methods; comparisons of values derived from different methods are less reliable and require additional, often heroic, assumptions
- a VOLY and WTP-QALY can be estimated based on existing approaches and both traditions can be harnessed to validate/ triangulate any change in recommended policy values. These methods reflect currently available technologies and have been implemented successfully in the field in the context of a VPF and WTP-QALY
- using the same methodology, the VPF currently recommended for regulatory analysis can be updated to account for current preferences
Nevertheless, the validity of any empirical estimates should not be assumed. In the literature, concerns have been raised that the chaining process amplifies the effect of people’s imprecise preferences on valuations, thereby increasing the number of outliers. It is possible that the same result would be observed in any new chaining study. However, methodological advances since 2011 have reduced the number of outlier observations excluded from WTP-QALY data to less than 10%. Similarly, with respect to the VPF and VOLY, more sophisticated information sets have been shown to reduce the insensitivities in valuation.
Efforts should therefore focus on:
(i) ensuring respondents understand the trade-offs when valuing life expectancy gains to minimise the number of extreme outliers and their impact on the final estimates
(ii) investigating the impact of combining the component parts of the method into either single or multiple chains
Acquiring more information on how people derive their values and what they understand by life expectancy gains should be a priority, pursued in parallel with a new primary study. In a similar manner, qualitative information could also generate insights into peoples’ views on how the quantitative evidence is used in policy.
Age and Context (Sections 3, 4)
A VOLY is expected to vary with age (RQIV) and time preferences (see below), thus any new primary research should be stratified with respect to age (as well as income and geographical location) to test this empirically. Age-specific values could inform VOLY updates in the future as the population ages.
If a constant age-independent VOLY and constant age-independent VPF are used in policy this will lead to an inconsistency in how safety is valued across different projects. This inconsistency is not related to the robustness or otherwise of the values. As with the VPF, the VOLY is based on individual values for small reductions in the risk of death which are then aggregated to form the value used in policy. The process of aggregation differs across the 2 measures, but the underlying principle is the same.
The possibility of a ‘context free’ measure was considered (RQIV). The definition of ‘context’ is multi-faceted and can include almost anything. The evidence in the literature is such that it would be difficult to identify specific contextual features that can be expected to systematically affect a VOLY.
We use the term ‘generic’ VOLY instead, meaning a value that is not specific to a particular scenario description/risk reduction. By definition, the domain (for example, road; air pollution; food) would be left unstated; however, if difficulties arise with respect to realism/acceptability, a domain may have to be introduced into the survey.
Discounting (Section 4)
This report is not prescriptive about how to deal with discounting in a new primary study, although a number of potential approaches are set out.
Current practice in the public sector is to use social time preferences to discount mortality/morbidity values. If individual discount rates could be recovered, either directly or indirectly, then this would allow WTP values to be re-inflated using personal discount rates. An aggregate VOLY increasing in value over time could then be recalculated using undiscounted values – to be subsequently discounted using the Social Rate of Time Preference (SRTP). This would avoid the problem of ‘double discounting’.
Conclusions
A conceptual framework has been set out and empirical methods identified that could underpin a new primary study, one that would:
- incorporate recent theoretical and empirical advances to improve the policy robustness of the 3 values, leading to better informed and consistent policy decisions in an area of fundamental importance to everyone i.e. longevity, safety and health
- generate a VOLY with a clear conceptual link to WTP-QALY and a VPF and facilitate the estimation of these measures from the same data set
- methods exist to operationalise the framework presented but should be subject to some further investigations and improvements. An in-depth and intensive approach to piloting is advocated given concerns that some aspects of the method may amplify the effect of people’s imprecise preferences on valuations, thereby increasing the number of outliers
1. Introduction
1.1. Policy background
It is the duty of a number of government departments to develop policies and interventions that improve the safety and/or health of the UK population. These include reducing the risk of death (mortality risks), increasing life expectancy and improving health-related quality of life. Allocation of resources across these different options, and across the broader policy remit, must be done as efficiently and fairly as possible.
To facilitate this, these benefits can be monetarised in 3 alternative ways (HM Treasury, 2018):
- Value of a Prevented Fatality (VPF): values small changes in fatality risks (mortality)
- Value of Statistical Life Year (value of a SLY): values the impact of risks to the length of life
- Quality Adjusted Life Year (QALY): values changes in health-related quality of life (morbidity) and length of life[footnote 1]
Current guidance (HM Treasury, 2018; Annexe A2) recommends the following monetary values for the different measures:
- VPF: £1 million (1997 prices) updated to £ 1.6 million (2010 prices)
- VOLY: £60,000
- QALY: £60,000
This approach allows flexibility with respect to the valuation measure that Government Departments use, although, as noted by Wolff and Orr (2009 p. 53) ‘There are good reasons not to replace VPFs with QALYs in safety contexts and good reasons not to replace QALYs with VPFs in health contexts’. However, for interventions delivering both longevity and changes in quality of life, the choice of which measure – if any – is far from clear. The inclusion of both is potentially important for efficient valuation and would make it easier to compare such policies with those that affect mortality risks.
What is required for policy purposes is a framework in which the value of a SLY has a clear conceptual link to the value of a QALY and the VPF. Hereafter, we refer to these 3 measures as value of a life year (VOLY), willingness-to-pay for a QALY (WTP-QALY)[footnote 2] and VPF. Together, these values would provide quantitative information on how people value changes in life expectancy (delivered through risk reduction in the coming year and/or over the lifetime), in perfect or full health and in poorer health. In addition, clarifying the conceptual link between the 3 values would facilitate consistency in the use of a VOLY across different government departments and agencies.
Schedule A[footnote 3] notes that both the current VPF and VOLY estimates primarily used by UK Government Departments and Agencies are derived from the Carthy et al. (1999) study, although only the former are estimated directly from the individual-based data. The current approach to estimating a VOLY is described in Franklin (2015). Thus, whilst the conceptual link between the 2 measures is there, it is not as clear as it might be. In addition, the Carthy et al. (1999) study was carried out over 20 years ago and applying it to current interventions implicitly assumes that the tastes and preferences of the population with respect to safety have not changed markedly over time. Whether this assumption holds is an open question, as is their relationship – if any – to WTP-QALY.
1.2. Aims
In line with the research brief, the overarching aims of this report are to:
- assess the need for and feasibility of undertaking new large-scale primary research to update the VOLY, and value of a QALY, used in the UK government departments and agencies
- describe the required scale and recommend appropriate methodology required for such a valuation study
- review whether and how primary research could address some key aspects of the application of these valuations in practice
1.3. Content
These overarching aims are addressed via 2 mechanisms:
- literature reviews with respect to 5 research questions (Annexes):
- RQI What are the relevant published estimates of the Value of a Life Year, and what are their strengths and weaknesses?
- RQII What are the main methodological issues in deriving a Value of a Life Year and what approaches exist in literature for addressing these?
- RQIII Can a Value of a Life Year be derived which is compatible with a Quality-Adjusted Life Year framework?
- RQIV Is it possible to derive a context-free Value of a Life Year for application across different policy contexts?
- RQV What is the relationship between the Value of a Life Year and the Value of a Prevented Fatality?
- a ‘synthesis’ exercise drawing together the findings from a subset of this literature:
- the purpose of (ii) is to establish whether one conceptual and empirical framework for the elicitation of a VOLY can be derived, based on robust, available technologies. Further, ideally, this framework would be able to accommodate the VPF, VOLY and the monetary value of a QALY to provide government departments and agencies with the flexibility to value the type of life expectancy or health outcomes delivered by their own policies using values derived from the same data set i.e. reflecting the same underlying set of preferences
The report is based around 3 main sections: the derivation of a conceptual model that clarifies the relationship between the 3 measures, a (potential) empirical study to elicit a VOLY (and by extension, a VPF and a monetary value for a QALY) and an identification of some key cross cutting policy issues arising from the literature reviews and their synthesis. These are followed by a set of recommendations addressing the key issue i.e. the need for and feasibility of new primary research to elicit a VOLY.
2. A conceptual framework for the VPF, VOLY and WTP-QALY
This section assesses the need for and feasibility of undertaking new large-scale primary research to generate monetary estimates of both a VOLY and a WTP-QALY, as well as an updated VPF. It demonstrates that these values can be underpinned by the same conceptual framework and empirical data to facilitate consistency in UK government regulatory analysis[footnote 4].
2.1. Existing literature and other approaches
The first stage is to establish the need for new primary research or whether a reliable ‘reference value’ can be sourced from the existing mortality risk valuation literature.
2.1.1. Can a reliable reference value for a VOLY be identified from the existing literature?
The findings of RQI directly address the need for new primary research. RQI reviewed the existing VOLY and WTP-QALY literature to establish whether a reliable ‘reference value’ for a VOLY could be identified either from existing studies as a whole or from a study or subset of studies that might be judged to reflect best practice across a range of factors.
The review concluded that the significant variation in values (for example, £216 to £230,113 for a VOLY; £970 to £912,835 for WTP-QALY) and heterogeneity of methods precluded the identification of a VOLY based on an empirical consensus, although 2 distinct clusters of values were identified. 3 studies (Mason et al., 2009; Grisolia et al., 2018 and Ryen and Svenson, 2015) were observed to generate a value close to £60,000 which is broadly in line with the estimation provided in Franklin (2015), but some fundamental concerns were raised with respect to their reliability for policy purposes. Whilst an additional study by Dolan et al. (2008) generated a VOLY in the range of £57,000, a direct comparison is inappropriate given the very different conceptual underpinning of the study (Subjective Wellbeing Analysis[footnote 5]). Similarly, it was found that whilst there were a few primary studies clustering around a value of £30,000 to £40,000, once again, these were too few in number and varied too much in terms of timing and/or methodology to provide a reliable basis for a value.
Studies were also compared qualitatively with each other to establish whether a particular study or studies could be considered to generate a reliable value from a methodological point of view. Under this scenario, such a value need not map to either a reference value or values from other studies. An assessment framework was devised in RQI. Its primary purpose was to allow each study to be assessed in a consistent manner across a range of relevant factors, as opposed to generating an (implied) ranking of one study over another, although any study judged to perform well across all (or many) of the factors would clearly be preferred to a study performing poorly across these same factors.[footnote 6]
Thus, studies were compared across timing and location, elicitation procedures and standard economic consistency tests and data handling procedures (for example, responsiveness of WTP to income; scope sensitivity; data cleaning). At the most general level, this assessment identified a wide variety of practices with respect to overall design and it was not realistic to assess how these differences might affect convergence or divergence of any resulting VOLY, either with respect to VOLYs from other studies and/or any ‘reference value’.
RQI also reviewed the WTP-QALY literature[footnote 7] using similar procedures with a view to establishing the degree of consistency amongst estimates and procedures and/or establishing whether a ‘reference’ VOLY could be derived from this literature instead. For reasons similar to those outlined already, it was concluded that this was not possible.
As the significant variation in values as a whole and the heterogeneity of methods precluded the identification of a specific VOLY, the second stage is to consider the feasibility of new primary research i.e. whether an empirical method exists in the literature that could be used – with or without adaptation – as opposed to developing a completely new method.
2.1.2. Alternative methods to elicit a monetary value of a VOLY
RQV highlighted that a number of methods exist to elicit monetary values for fatality risk reductions in a survey, all of which should generate an equivalent value of a life year, providing they each were understood perfectly by respondents in a survey. However, the review in RQI suggests caution in this respect. More details can be found in RQV with respect to these methods, but the identified problems and/or uncertainties – which are summarised below – and/or lack of compatibility with a WTP-QALY led the research team to reject them as methods to take forward in new primary research.
The first alternative would simply be to ask a representative sample of the population quite directly about their WTP for a marginal gain in life-expectancy, for example Chilton et al. (2004). As well as losing a conceptual link to WTP-QALY (see Section 2.2 below), the first difficulty with this approach is that members of the public – most of whom will almost certainly be unfamiliar with the way in which life-expectancy is defined and measured – are likely to regard a gain in remaining life-expectancy as constituting a simple ‘add-on’ to survival time at the end of life in poor health. The second problem is that the gains in life-expectancy to be valued will almost certainly need to be marginal gains in life-expectancy. For example, for an individual with 40 years of remaining life-expectancy, a halving of the current average risk of death as a car driver or passenger during the coming year would generate a gain in remaining life-expectancy of less than 4 hours, while an ongoing halving of the risk over future years would generate a gain of about 3 days. It would not be surprising if the individual stated that she would be willing to pay only a very limited amount, if anything at all, for the gain, particularly if the individual regarded it as an ‘add-on’ to survival time at the end of life.
A second, direct approach might be to extend the method developed in Nielsen et al. (2010) – in which respondents were asked to choose between gains in life expectancy generated by different types of perturbation in the vector of future hazard rates. If deployed in new primary research, respondents would also be asked to state their WTP for these different distributions, a so far empirically unverified approach. However, 2 potential problems arise. The first is that, in the 2 applications in the field (Nielsen et al., 2010; Hammitt and Tunҫel, 2015), it was found that preferences were more or less evenly distributed across the sample of respondents. This finding might be considered to be at odds with the theoretical analysis outlined in Jones-Lee et al. (2015) and RQV, suggesting at the very least, that further significant empirical investigation of the psychological underpinnings of people’s attitudes to the timing of hazard rate reductions would be required before this method could be recommended for use in large scale primary research. The second issue is that, so far, this method has been used for a relative valuation of different perturbations in the hazard rates that each generated the same gain in life expectancy. Further developing this method to allow for a monetary valuation would almost certainly require a protracted period of time to develop and test appropriately.
Thirdly, a VOLY could be estimated, by a direct elicitation of WTP to reduce current risk and estimating the gain in life expectancy that such a risk reduction would generate for the individual (see for example Alberini et al., 2006). 2 issues arise from using this approach.
The first is a well-established issue in attempts to directly elicit WTP for changes in fatality risks: insensitivity to scope. In the UK, Beattie et al., (1998) reported significant scope insensitivity issues on the individual level with up to 42% of respondents giving identical non-zero CV responses for 2 different risk reduction. Similar concerns regarding non-fatal road injuries are reported in Jones-Lee et al. (1995) and Dubourg et al. (1997). These findings led directly to the development of the ‘chained’ approach to estimating a VPF in the UK (Carthy et al., 1999). Hammitt et al. (2019) used the direct elicitation approach in China in 2016. Their consistency test had 2 components:
- positivity – elicited WTP must be strictly positive)
- proportionality – responses to 2 binary-choice WTP questions for 2 different risk reductions must be consistent with the requirement that WTP is less than but close to proportional to the magnitudes of the risk reductions
The survey was designed such that accepting both offered risk reductions at the offered WTP amount, or rejecting both offered risk reductions at the offered WTP amount, counted as consistent, whilst accepting one and rejecting the other counted as inconsistent. The authors acknowledge that satisfying this criterion is a necessary, but not sufficient, condition for being close to proportional in WTP. Only 42% of respondents passed this test leading to the exclusion of a total of 58% of the sample in the most restrictive analyses. In Alolayan et al. (2017), where the consistency test was originally introduced, 16% of the sample was excluded using the same criteria. Whereas as described, previous studies using the direct elicitation approach have encountered issues on the individual level, several studies have found that on the aggregate (across individuals), estimated WTPs are near proportional to the reduction in probability of illness which is in accordance with theory see (Hammitt and Haninger, 2017; Hammitt and Haninger, 2010). Still, the issue that a large number of respondents do not meet the scope sensitivity consistency check on the individual level, raises validity concerns about the use of the direct elicitation method.
The second issue is that a direct elicitation of WTP would require information or assumptions about individual health states to provide an empirical link to the WTP-QALY (Section 2.2 below).
Setting these 2 issues aside, a recent study (Balmford et al., 2019) comparing the validity of the chained method and the direct method concluded that the former generated more reliable estimates of an adult VPF. However, child VPFs were also elicited but results were inconclusive with respect to the validity of both the direct and the chained methods. A conventional standard gamble was used in the Balmford et al. (2019) paper which has been shown to be vulnerable to a ‘certainty effect’. A modified standard gamble was developed for the Carthy et al. (1999) to ameliorate the ‘certainty effect’. Thus, 2 of the unresolved issues with respect to the chained method in that study (valuation with respect to children and the reliability of a conventional standard gamble) do not obviously apply to the chained method as proposed in the conceptual framework (Section 2) although of course other validity issues may arise and are considered in Section 3.
Finally, as discussed in RQI, a VOLY and WTP-QALY can be derived from existing VPF estimates (see Mason et al. 2008 for a review) as well as RQI and RQV for a discussion). However, this raises similar concerns as above with regards to scope insensitivity and assumptions regarding health states. In addition, preferences might differ significantly across health care and traffic safety which led Mason et al. (2008) to conclude that this would not be a suitable way of estimating WTP-QALY. Also, as explained in Mason et al. (2009), there are 2 variants of deriving a VOLY and WTP-QALY from a VPF depending on whether all affected individuals enjoy the same risk reduction or individuals enjoy the same gain in life expectancy. As discussed in Mason et al. (2009), only in exceptional circumstances will the 2 be equal. The proposed framework allows for an estimation of both.
It turns out, though, that by adapting existing empirical methods from the VPF and WTP-QALY literature, an empirical method for calculating a VOLY can be proposed, one that is compatible with the conceptual framework below. Combined, this means that any new primary research would be underpinned by significant conceptual and empirical advances, offering substantially more robust values for future policymaking.
2.1.3. Proposed framework: conceptual and empirical advances
An important issue not raised so far is the fact that the approaches underpinning VOLY and WTP-QALY elicitation have been developed from different methodological traditions relying on different assumptions (see Hammitt (2002) for a discussion). Whilst the 2 approaches do to some extent borrow methods and data from each other, the conceptual links are not yet well developed. The purpose of the next sub-section is to fill this gap by setting out a framework for the empirical elicitation of the value of life expectancy gains in a manner compatible with a WTP-QALY. In this framework, a VOLY is consistent with the conceptual foundations of the one-period VPF model underpinning current HM Treasury advice (Green Book, 2018) for valuing the prevention of immediate fatalities and also has a clear link to a monetary value of a QALY. Thus, when applied empirically, the same methodology could be used to estimate a VOLY, a VPF or a WTP-QALY.
Empirically, the framework avoids the elicitation issues outlined above since it breaks the valuation task down into 2 stages, each of which is designed to be cognitively manageable for respondents. A respondent’s value of a gain in life-expectancy is then derived by ‘chaining together’ his/her responses to the questions posed in the 2 stages. Thus, empirically, the method adapts the approach used to derive the current VPF (Carthy et al., 1999) to a VOLY context. The chained approach has also been used to derive a usable set of data in the context of a WTP-QALY (Robinson et al., 2013).
Thus, in principle this framework could be deployed without any further conceptual development (over and above that outlined in the next sub-section). Empirically implementing the framework in the VOLY context would require intensive piloting to identify and mitigate any potential problems (see Section 3). The next sub-section sets out this framework.
2.2. Conceptual framework for eliciting a VOLY and/or WTP-QALY
The conceptual framework is grounded in the formal specification of a VOLY outlined in the Technical Appendix and RQV and hence a VOLY can be considered as:
Aggregate willingness to pay, summed over a large group of people, for marginal reductions in the hazard rate for the coming year (or some future year or years) where, taken over the group of people affected, the marginal gains in remaining life expectancy generated by the hazard rate reductions sum to one year.[footnote 8]
This definition establishes the close relationship between the VOLY and the VPF. Both measures are underpinned by the assumptions of Expected Utility Theory and are based on individual WTP – based values for small risk reductions which are aggregated over a large group of individuals in 2 different ways for use in policy. The link between the VOLY/VPF and the WTP-QALY will be described later but in the context of the VOLY and the VPF, the relationship is as follows:
- gains in life expectancy can only be generated by small mortality risk reductions. These are valued using WTP
- the VPF represents the aggregate WTP-based value of small individual mortality risk reductions which, taken over the affected group of individuals, can be expected to prevent one statistical fatality/save one statistical life (not the value of saving an identified life). Similarly, the VOLY represents the aggregate WTP-based value of small individual gains in life expectancy which, taken over the affected group of individuals, sum to one year (not the value of one individual’s life year). As such, the VOLY represents the value of a ‘statistical’ life year
Based on the above, it is clear that the relationship between WTP (which reflects the value of the gain in lifetime expected utility generated by the change in hazard rate) and a change in life expectancy must be established as part of this framework. In the Technical Appendix and RQV, it is established that expected utility increases in proportion to the size of the gain in life expectancy implied by the change in hazard rate. However, once diminishing marginal utility of wealth is taken into account this linearity no longer holds by definition i.e. the increase in WTP is no longer proportionate to the life expectancy gain, in that WTP for a 3-month gain would be expected to be less than 3 times that for a one-month gain[footnote 9]. Hence, the relation between an individual’s WTP and his/her gain in life expectancy i.e. WTP = f(∆E) – where ∆E represents a change in life expectancy – will take the following form (Figure 1)[footnote 10]:
Figure 1: Relationship between WTP and gains in life expectancy (LE)
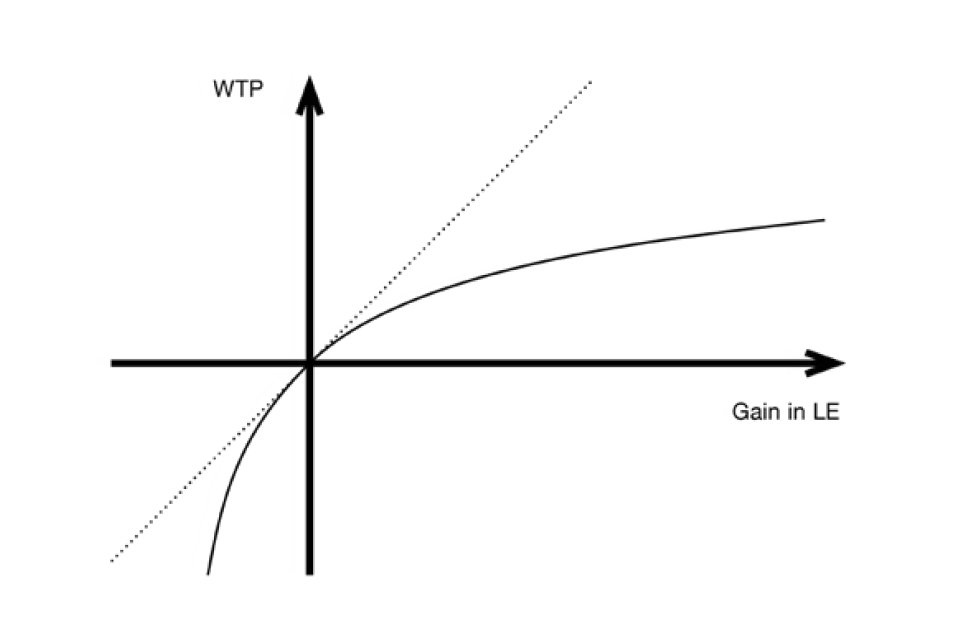
Line graph showing 4 quadrants with an x axis of WTP and y axis of gain in LE. The two lines on the graph both cut through the centre of the quadrant: a diagonal dashed line going up from left to right and a solid curved line.
Life expectancy gains delivered by public policies can be marginal or non-marginal. In the case of marginal gains, a very small gain in life expectancy is enjoyed by each member of a large group of individuals. Thus, suppose that each member of a large group of n individuals enjoys a gain of 1/n of a year of life expectancy so that, summed over the affected group, the aggregate gain in life expectancy is one year. As far as each affected individual is concerned, his/her WTP for the marginal gain will be given by the gradient of his/her WTP = f(∆E) function at the origin (the slope of the dotted line in Figure 1) multiplied by 1/n. Summed over the n affected individuals, aggregate willingness to pay will therefore be equal to the sum of 1/n times the gradient of each individual’s WTP = f(∆E) function at the origin which is, by definition, the arithmetic mean of the gradient for the affected group. It therefore follows that the VOLY for marginal gains in life expectancy for the group is given by the arithmetic mean of the gradient of each affected individual’s WTP = f (∆E) function at the origin.
Ideally, we would elicit individual’s WTP for extremely small gains in LE (very close to the origin). Due to issues of scope insensitivity (see above), that is likely to be problematic. However, given that the graph is constructed so as to pass smoothly through the origin, by estimating (at least) 2 points on the curve, the functional form of the curve can be estimated. To get an indication of the typical size of a marginal gain in life expectancy, the risk reduction in a typical VPF survey would, as mentioned, generate a gain in life expectancy of a few hours, or at most, days. The study by Alberini et al. (2006) found that a relatively large mortality risk reduction of 5 in a 1000 over the next 10 years corresponds to 37 days of additional life expectancy.
As far as the research team is aware, the large majority of policies that deliver risk reductions to the general population will deliver marginal gains, and for these it would be appropriate to use the approach outlined above. However, the method can also be applied to the case of non-marginal gains and is thereby more flexible. The Technical Appendix argues that in the case of non-marginal gains, it might be inappropriate to base the VOLY on the affected individual’s valuation of marginal gains (i.e. the gradient of the graph in Figure 1 at the origin) as above and, instead, it may be more appropriate to base it on an individual’s WTP for a longer duration e.g. a 0.25 year (i.e. 3-month) gain in life expectancy. Diagrammatically, the VOLY would then be given by the arithmetic mean over the affected group of the slope of the chord (i.e. WTP/∆E) at ∆E (Figure 1 above). For example, in the case of a 3-month gain in life expectancy the VOLY would be given by the arithmetic mean over the affected group of the slope of the chord, WTP/∆E, at ∆E = 0.25. In summary, by estimating the whole curve, policy makers are provided with the flexibility to adopt either approach i.e. a VOLY based on marginal or non-marginal gains in life expectancy.
Turning to the relationship between the VOLY and WTP-QALY, the conceptual framework requires a mechanism to convert WTP for a non-fatal injury or a health state and chain this to an equivalent gain in life expectancy. This is known as the chained method. Note that the basic argument underpinning the chained approach is that it is simply a mechanism that links the answers to 2 separate questions together and in and of itself does not require the assumption of Expected Utility Theory.
Here, we present 2 different ways of relating different severities of non-fatal injuries/illnesses to gains in life expectancy. Both of the approaches are based on existing conventions presented in the literature and which are used for policy making (see Carthy et al. (1999) and Franklin (2015)). The novelty here is that, by keeping gains in life expectancy as the common denominator, we demonstrate how this framework for deriving a VOLY is compatible with the WTP-QALY framework. It is, of course, the case that the compatibility of the measures is affected by a number of additional considerations, in particular by discounting and by the distinction between normal versus perfect or full health, although the underlying fundamentals of the relationship remain intact. The 2 approaches are summarised below[footnote 11]. We restrict the framework to a one-period hazard reduction and gains, rather than losses, in life expectancy[footnote 12].
2.2.1. Approach 1 (VPF and VOLY)
Approach 1 is set out in detail in the Technical Appendix. In summary, this approach is a modification of the Carthy et al. (1999) chained approach used to elicit the value of mortality risk reductions to estimate a VPF. This process is explained in detail in Carthy et al. (1999).
Here, we modify this method to instead elicit individual values for gains in life expectancy in normal health and, hence, to estimate a VOLY. The key difference here is that a modified Standard Gamble (SG) approach is used to elicit the loss in life expectancy that the respondent regards as being as bad as suffering a non-fatal injury H for a year[footnote 13].
The procedure is as below:
- elicit WTP for quick and complete cure for suffering a non-fatal injury (H) for a year
- elicit the loss of life expectancy in normal health (∆E) that is as bad as suffering the non-fatal injury or illness. The procedure is as follows:
- individual responses to a modified[footnote 14] SG generate an estimate of π which is the maximum risk of treatment failure the individual would be prepared to accept in a treatment which, if successful, would result in an immediate and complete cure for injury H and returning to normal health for the rest of their lives. If the treatment was unsuccessful it would result in immediate death
- the π elicited from the exercise above is a one-period change in mortality risk. Multiplying π by remaining life expectancy i.e. (∆E) = πE allows a calculation of the loss in life expectancy in normal health that follows from π (see Technical Appendix). Hence a quick and complete cure for H yields the same gain in lifetime expected utility as a gain in life expectancy of πE in normal health. The estimated WTP (from step 1) is chained to the gain in life expectancy in normal health (from step 2)
Steps 1-4 are repeated with different severities of H and different gains in life expectancy (in normal health) can therefore be valued corresponding to different points on the valuation function i.e. VOLYs. Based on this, the rest of the valuation function (for smaller and larger life expectancy gains) in Figure 1 can be estimated using regression analysis (see the Technical Appendix for a simple example or Alolayan et al. [2017] and Hammitt et al. [2019] for more discussion of how empirical estimates of income elasticity can be used to estimate the curve). Note that π elicited in step 2 can be chained to the WTP elicited in step 1 to estimate a VPF, see Carthy et al. (1999). Following the procedure above effectively ‘translates’ a complete cure for different severities of H into the equivalent gains in life expectancy in normal health, corresponding to particular points on the horizontal axis in Figure 1. The procedure above would enable a more robust valuation function (WTP = f(∆E)) to be established both at an individual and aggregate level, across a range of plausible life expectancy gains, both marginal and non-marginal. The Technical Appendix uses data from the Carthy et al. (1999) study to illustrate the process in practice and finds approximate correspondence to the WTP-QALYs estimated in Franklin (2015).
2.2.2. Approach 2 (WTP-QALY)
RQII describes how to estimate a WTP-QALY using the chained approach. Below, we outline how the Carthy et al. (1999) data and the UK EQ-5D tariffs (Devlin et al., 2018) for different EQ-5D health states can be used to estimate a WTP-QALY (further details on the EQ-5D descriptive system and tariffs can be found in RQIII). This follows the approach outlined in Franklin (2015).
- elicit WTP for quick and complete cure for suffering a non-fatal injury (H) for a year
- the QALY loss associated with H is estimated by multiplying the time spent in health state H with the health state utility value associated with that health state. Following Franklin (2015), the health state utility value is estimated using the UK EQ-5D tariffs for different EQ-5D health states (Devlin et al., 2018)[footnote 15]
Step 1-2 is repeated with different severities of H. A valuation function can be derived and the associated WTP-QALY can be estimated. Using this approach, the valuation function will effectively be a function of gains in QALYs, which appears to be in contrast to Figure 1. Below, we show how an elicited health state utility value for a health state H – a health state with equivalent loss of quality of life to suffering non-fatal injury or illness H – can be translated into a change in life expectancy in perfect or full health using a Time Trade-Off(TTO).[footnote 16] We therefore provide the link between Approach 1 and Approach 2 and hence a WTP-QALY can be illustrated in Figure 1 as well as a VOLY and a VPF.
As demonstrated below and in the Technical Appendix, the 2 approaches are intrinsically linked and as such, this framework is one way of integrating the VOLY and WTP-QALY measures, both conceptually and empirically. Whichever approach (1 or 2) is used, in the first stage an individual is asked for his/her WTP for a quick and complete cure for non-fatal injury H. At the second stage s/he provides a response that identifies the loss of remaining life expectancy (∆E) in normal – or full – health that the individual considers equally as undesirable as suffering non-fatal injury H. In this case, the maximum WTP elicited in stage one can also be taken to represent his/her maximum willingness to pay for a gain of ∆E years of life expectancy in normal – or full (perfect) – health. In this way, the individual’s responses to the WTP and SG (or TTO) questions can be ‘chained together’ to obtain an estimate of his/her WTP for a specific gain in life expectancy. By presenting the individual with WTP and SG (or TTO) questions for a number of different severities of non-fatal injury or illness it would then be possible to estimate his/her WTP = f(∆E) function (see Figure 1).
The conceptual link between VOLY and WTP-QALY denote the utility of one year in perfect or full health by U and the utility of one year of suffering injury H by H[footnote 17]. If the individual in a TTO question indicates that suffering injury H for 10 years is equivalent to spending t years in perfect or full health, it follows that 10H = tU. This means that H/U = t/10 and one year of H would therefore be treated as yielding t/10 QALYs. Likewise, it follows from the SG in Approach 1 (see Technical Appendix (eqn. 6)) that H/U = (1 – πÊ), where Ê denotes the individual’s remaining discounted life expectancy (computed using his/her personal discount rate. We will return to the issue of discounting in Section 2.2.4 below. Setting the distinction between normal and perfect or full health aside for now (see Section 2.2.4.), if the individual answers both the SG question (in Approach 1) and TTO questions (in Approach 2) in a manner that conforms with expected utility, then it will necessarily be the case that H/U = t/10 = (1 - πÊ). This means that the loss of life expectancy equivalent to suffering the non-fatal injury or illness for one year implied by the response to the SG question (i.e. πÊ) will be equal to the loss of discounted life expectancy equivalent to suffering the non-fatal injury or illness for one year implied by the response to the TTO question (i.e. 1 – t/10) as defined in the Technical Appendix, eqn. 7. Note also that SG has been used to elicit health state utility values used in the calculation of QALYs in the literature (see RQIII) and hence a SG could, in principle, be used in both Approaches 1 and 2.
For the purpose of simplifying the presentation of this framework here, we have chosen to focus on the TTO as it was used to estimate the health state utility values for different EQ-5D health states (EuroQoL Group, 1990) that are recommended for use by the National Institute for Health and Care Excellence (NICE) in the appraisal of new health technologies (NICE, 2013). The SG presented under Approach 1 differs from the one traditionally used to elicit health state utility values on 2 key aspects; 1) respondents are informed that they will return to perfect or full health, whereas in the chained approach respondents are informed that they would return to normal health. The distinction between perfect or full and normal health might be expected to ‘pull’ the 2 measures of the value of the same gain in life expectancy apart, an issue on which we will elaborate on later, and 2) in the chained approach, preferences are elicited for avoiding H which is a temporary health state (e.g. one year). Traditionally, when health state utility values have been elicited to be used in QALYs, preferences have been elicited for a chronic health state which will be ongoing over the rest of the individual’s life, see Appendix to RQIII. In this case, as time is held constant across the 3 states (perfect health, death and chronic illness), the QALY weight (H/U) is elicited as (1-π) and life expectancy (E) cancels out (see Technical Appendix Eqn. 6).
However, there are some further issues to be considered. The framework illustrates the relationship between WTP and gain in life expectancy when the gain in life expectancy is undiscounted. Further, as noted, the framework has not accounted for the difference between full or perfect and normal health (which is an artefact of 2 different methodological conventions within the 2 different contexts (health economics (QALYs) and safety economics (WTP)). These 2 issues are discussed below.
2.2.4. Discounting and issues relating to full/normal health
Prior to setting out a more formal framework with respect to discounting life expectancy (below) we first provide an intuitive explanation. Essentially, the value of a gain in life expectancy will be determined by the resultant gain in the discounted present value (computed at personal discount rates) of the stream of future annual expected utilities of affected individuals. This means that if a gain in undiscounted life expectancy is the result of later hazard rate reductions then it will be accorded a lower value than the same gain in undiscounted life expectancy generated by earlier hazard rate reductions. In order to accommodate this effect, it would seem sensible to define the VOLY on the basis of gains in appropriately discounted life expectancy.
For example, when we calculate the VOLY from individuals’ aggregated stated willingness to pay for a gain in undiscounted life expectancy, we divide the stated aggregate WTP amount by the undiscounted life expectancy gain as a proportion of one year (for example if a 6-month gain is worth £10,000, we divide WTP by 0.5 to get a VOLY of £20,000). However, WTP values will actually be based on discounted utility, and an X-month objective gain in life expectancy is equivalent to a gain of less than X months in discounted life expectancy. For instance, a 6-month objective gain in life expectancy may equate to a 4-month gain in discounted life expectancy. In this case, to calculate the VOLY, we must divide £10,000 by (1/(1/3)), so the VOLY is £30,000. From this, it is clear that ignoring discounting means that the VOLY will be underestimated.
As explained above in Approach 2, a TTO-based QALY associated with an injury/illness is defined as a fraction of a year in full health that yields the same utility as one year suffering that same injury/illness. Let us denote utility of one year in full health by U and utility of one year spent suffering injury/illness by H. It therefore follows that the loss of life expectancy equivalent to suffering the injury/illness for one year implied by the TTO-based QALY-loss associated with the injury/illness is the fraction of a year in full health which, if subtracted from remaining survival time, would imply a utility loss of U – H. Approach 1 is based on a SG-based elicitation of the maximum probability of treatment failure, π, that he/she would accept for a treatment which, if successful, would result in an immediate cure for the injury/illness lasting one year, but if unsuccessful would result in immediate death. Thus, if the loss of life expectancy equivalent to suffering the injury/illness for one year implied by the response to the SG question is to be equal to the loss of life expectancy implied by the TTO-based QALY-loss, then the loss of lifetime expected utility resulting from an increase, π, in the probability of immediate death must be equal to U – H. But, by definition, an individual’s remaining lifetime expected utility will be the discounted present value of future annual utilities computed using his/her personal rate of time-preference. In addition, when answering the SG question in Carthy et al. (1999), the respondents were asked to imagine that he/she will spend the rest of life in normal (rather than full or perfect) health. Thus, if the loss of life expectancy derived from the response, π , to the SG question is to be equal to the loss derived from the TTO-based QALY for the injury/illness concerned then a) the loss of life expectancy implied by the SG response will need to be computed as the product of π and discounted remaining life expectancy and b) the loss implied by the SG response in Carthy et al. (1999) will require further downward adjustment to take account of the fact that the TTO-based QALY-loss is a loss of survival time in full or perfect health, whereas the SG response in Carthy et al. (1999) is based on the assumption that the rest of life will be spent in normal health.
Clearly then, if the VOLY is derived using Approach 1 by chaining WTP for a complete cure for one year of the injury/illness to the SG-based estimate of the loss of life expectancy judged to be equivalent to suffering the injury/illness for one year – with the latter subjected to appropriate discounting and further downward adjustment to take account of the full health/normal health distinction – then the resultant VOLY should be equal to the WTP-based value of a QALY derived by chaining the WTP response to the TTO-based QALY-loss associated with suffering the injury/illness for one year. Derived using discounted life expectancy and subjected to an appropriate full health/normal health adjustment, a SG-based VOLY should therefore be equivalent to the valuation of a TTO-based QALY.
To get an indication of the magnitude of the effect of discounting, assume, as in Technical Appendix, that average remaining life expectancy is 40 years. Applying, for illustrative purposes, a personal discount rate of 6%, the 40 years can be converted to 15 discounted life years which are then multiplied by the change in mortality risk, π to get the (discounted) gain in life expectancy[footnote 18]. Jones-Lee et al. (2015) note that, if gains in life expectancy are computed on a discounted basis using the personal rate of time preference, then under reasonable assumptions concerning the pattern of anticipated future annual utilities, the VOLY will be completely independent of whether the risk reduction that gives rise to the gain in discounted life expectancy occurs in the current year or is instead on-going over a person’s lifetime. This, together with the argument developed above concerning the appropriate interpretation of TTO-based QALY losses and SG results, provides a rather persuasive case in favour of defining a VOLYd i.e. on the basis of gains in discounted life expectancy. Similar to the VOLYd, an argument for discounting can be made for WTP-QALY i.e. WTP-QALYd. Due to the difference between normal and perfect or full health noted above, the individual’s WTP-QALYd (estimated as the gradient of the valuation function) will be steeper than the VOLYd and hence WTP-QALY will be higher than the VOLY.
2.3. The Carthy et al. (1999) data set
In the Technical Appendix, we utilise the Carthy et al. (1999) data set to illustrate how the framework would underpin both an estimate of a VOLY and a WTP-QALY in addition to the VPF reported in the original study. As such, an argument could be made to use this data set to estimate a VOLY for use in current and future regulatory analysis, not least since it would generate a VOLY based on the same preferences elicitation as the current VPF. However, caution is merited in considering this approach for the following reasons:
- the data for the Carthy el al. (1999) study was collected in 1997 and is therefore more than 20 years old
- the estimates were based on a small initial data set of 167 respondents; which was trimmed to a final, usable data set of 135 respondents
- only 2 different injuries were used for the elicitation (X and W). To derive the full curve (Figures 1-2 above), valuation of other, non-marginal changes in life expectancy would be needed to generate a reliable value function
- the Carthy et al. (1999) study used a one-time payment to avoid non-severe injuries (which, as noted, equate to relatively smaller life expectancy gains). Such a payment vehicle would imply significant budget constraints impacting on the valuation of non-marginal injuries (which would equate to larger life expectancy gains) and hence a more appropriate the payment vehicle of on-going payment over, for example, 5 to10 years would be preferable, with appropriate adjustment to account for discounting (see RQII for further discussion of payment vehicles)
On a related note, the Chilton et al. (2004) study does in fact provide 3 points on a VOLY value function i.e. values for 1 month, 3 months and 6 months additional life expectancy. However, due to its incompatibility with the above framework, a WTP-QALY could not be derived. In addition to other limitations (see RQII) and the increasingly dated nature of the resulting information, this precludes recommending the widespread adoption of a VOLY based on this study.
In summary, the proposed framework makes clear the conceptual link between the 3 measures used to value reductions in risks to life and health. Adopting a ‘context-less’ or ‘generic’ VOLY (see RQIV and Section 3 for a discussion) underpinned by this framework maintains the current flexibility that Government Departments have to value the type of life expectancy or health outcomes delivered by their own policies.
2.4. Outstanding considerations
Nevertheless, there are some outstanding issues, some of which are addressed in Section 2 and 3 and others that would require to be accommodated or addressed within any primary research employing this framework.
- the current approach is based on a one-period model. This has some advantages, not least that the current VPF could also be updated to reflect current preferences, and that a WTP-QALY can be estimated. However, it does mean that the potential exists for the VOLY to be underestimated for those respondents who have higher values for (equivalent) life expectancy gains generated by on-going risk reductions. The degree of bias depends on how significantly estimates of π differ between these respondents and those that would strictly prefer their life expectancy gain to be generated from a one-period risk reduction (RQV). This issue could be addressed by employing a relative valuation method to identify the necessary adjustments to the value of life expectancy gains generated from on-going risk reductions relative to the value elicited for one-period reductions
- the problem posed by the inherent inconsistency of a constant VOLY and constant VPF (RQV) if deployed in policy remains. This is considered later in Section 4
- much is yet to be learned about respondents’ understanding of how life expectancy gains are generated from small changes in the underlying hazard rate–as well as their comprehension of value elicitation questions per se. Whilst the latter is covered using best-practice survey design procedures which include cognitive testing, the latter would seem to require a directed, in-depth qualitative investigation, the results of which may also assist in the interpretation of the aggregate quantitative data
- behavioural biases are not included in the above framework. In particular, if non-standard discounting (i.e. non-exponential discounting, or time preferences that imply inconsistent choices over time) prevails at the level of the respondent, then it would be necessary to account for each respondent’s personal discount function, as well as their personal rate of time preference, when calculating the discounted gains in life expectancy
- the purpose of the framework is not to identify categories of practical application for which the VOLY (as distinct from the VPF or the QALY) is to be preferred
Section 3 now follows in which the associated empirical procedures are considered in more detail.
3. An empirical study for the VOLY, VPF, and WTP-QALY
This section will describe the required scale and appropriate methodology necessary to deliver a set of empirical estimates under the framework described in Section 2, one that allows the 3 monetary values: VOLY, WTP-QALY and VPF to be estimated from the same data set.
To recap, in order to operationalise the conceptual framework, and to estimate a VOLY, an empirical approach is required that chains a gain in life expectancy to Willingness to Pay (WTP) for this change in life expectancy. We propose the use of Standard Gamble (SG) and Time Trade-off (TTO) to estimate the change in life expectancy to ensure the elicitation procedures reflect the conceptual link in the 2 approaches.
The chained approach is not new, as presented in RQI and RQIII, a number of studies have been developed over the past 20 years which have chained a WTP estimate with a health state (via a SG or TTO) (Carthy et al., 1999; Robinson et al., 2013; Baker et al., 2010). However, the manner in which the estimates of WTP and SG/TTO are combined to calculate the VOLY is novel. Further, if discounted life expectancy is used, this eliminates the need (for policy purposes) to calculate the value of life expectancy gains arising from other perturbations of the underlying survival function and incorporates the recent theoretical developments with respect to discounting into the estimation process.
Many aspects of the design will be unique to a particular survey and so cannot be considered here. One important issue that is difficult to be prescriptive on is whether it is possible (or even desirable) to elicit a ‘context free’ measure. This is considered in more detail in (RQIV). We simply note here that the definition of ‘context’ is multi-faceted and can include almost anything. The evidence in the literature is such that it would be difficult to identify specific contextual features that can be expected to systematically affect a VOLY.
We prefer the term ‘generic’ VOLY instead, meaning a value that is not specific to a particular scenario description/risk reduction. This maximises the tractability of the measure for policy use and means it is not affected by features specific to a particular domain that might not be relevant in another. Mason et al. (2008) specifically raised this concern with respect to using preferences for traffic safety in the context of health care. By definition then, the domain (for example, road; air pollution; food) would be left unstated in the survey; however, if difficulties arise in respect of realism/acceptability in the piloting phase, a domain may have to be introduced.
3.1. Survey design
The survey is designed around SG/TTO and corresponding WTP questions relating to health states or injuries to generate sufficient data points to estimate the value function as outlined in Section 2 (Figure 1). Ideally, each respondent would provide responses to the 3 types of questions for 3 to 5 points on the curve representing health states or injuries of different levels of severity (and hence differing life expectancy gains). If piloting suggested that this was too many questions for an individual, a split sample design could be deployed (WTP and SG; WTP and TTO) and the aggregate responses combined.
As outlined in RQIII, both the SG and TTO have been successfully used in the elicitation of WTP-QALY (Robinson et al., 2013; Baker et al., 2010). In this study, the SG and TTO are used to link WTP to avoid the suffering associated with a non-fatal injury or health state to a change in remaining life expectancy and not as a measure of the health-related quality of life of the health state. However, the design and application of these questions should still take account of best practice. For example, using visual aids alongside a written explanation of the choice task (see Attema et al., 2013 and Brazier et al., 2017 for a discussion of best practice for each approach).
For a survey based on the framework outlined in Section 2 the contingent valuation method (CVM) would provide the most direct way to elicit individual WTP[footnote 19]. This would be in accordance with the chained approach adapted in Carthy et al. (1999) and Robinson et al. (2013). As with SG and TTO questions, current best practice should be used for the design of standard contingent valuation survey features, such as the payment vehicle, including duration of payment and elicitation method (see Johnston et al., 2017) for further discussion). The payment vehicle is non-neutral but should be compatible with the way in which the scenario is presented to respondents, for example justification should be made for selecting either out of pocket payments, changes in taxation or general cost of living. Alternative payment vehicles are discussed in more detail in RQII and would require different payment structure to the one suggested here e.g. recurring payments for the rest of a respondent’s life.
The framework proposed in Section 2, relies on a (next) one period risk reduction, and thus the timing of the payments should also be in the same one period. This does not preclude a series of payments within that period – such an approach might be advantageous as it could reduce, or eliminate, the potential problem that budget constraints may severely limit WTP. To elicit WTP values from respondents, elicitation mechanisms with proven weaknesses, such as payment scales which can suffer from range bias, should be avoided.
As the overall validity of the chained approach relies on the quality of the data in response to both the SG/TTO and the WTP questions, we have identified 3 key methodological issues to consider during the design of a chained study. The first 2 arise because of the potential impact of the ‘anchoring and adjustment’ heuristic (Tversky and Kahneman, 1974) that affects stated preference techniques in general[footnote 20]. The third issue is a potential artefact of the chained method itself.
3.1.1. Scope insensitivity
The problem of scope insensitivity was in fact the major motivation for the development of the chained approach (Beattie et al., 1998; Carthy et al., 1999) that underpins the conceptual framework. Scope insensitivity in the estimation of the VOLY relates to whether WTP values change in proportion to the size of life expectancy gain or risk reduction. As outlined in RQII, a number of methodological developments have been made within stated preference methods over the past 10 years to reduce the problem of scope insensitive WTP responses. In this particular context whilst risk communication remains a challenge – some recent developments could in principle be tested and incorporated to reduce the impact of imprecise preferences over risk and/or cognitive difficulties on the proportionality of WTP to the different risk reduction.
There are 2 further elements that can cause scope-insensitivity and hence non-linearity in the valuation function; budget constraints and diminishing marginal utility of wealth. It is possible to design an instrument that avoids the impact of budget constraint and minimises the impact of insensitivity to the magnitude of the risk reduction by choosing appropriate points on the valuation curve (see above). However, it is not possible to isolate and quantify the impact on the slope of the valuation function of diminishing marginal utility of wealth[footnote 21] as it will be conflated by the 2 other elements. In addition, whereas scope insensitivity and budget constraints are problematic with respect to elicitation of WTP, diminishing marginal utility of wealth is not. Thus, as Figure 1 illustrates (and further expanded in the Technical Appendix) due to diminishing marginal utility of wealth it is expected that an individual’s WTP for a gain in life expectancy will not be linear i.e. proportional to the magnitude of the increase in life expectancy; instead an individual’s WTP will increase at a decreasing rate. This is not unique to life expectancy gains and is predicted by theory to apply generally across domains[footnote 22].
3.1.2. Non-traders or excess traders
In earlier studies designed to elicit a VOLY non-traders – respondents who refuse to take any risk of death however small for a proposed health gain in the SG question – have comprised up to approximately 20% of the sample (Alberini et al., 2010; Chilton et al. 2004). However, the direction of travel in terms of the percentage of non-traders is encouraging as in the more recent European Value of a QALY (EuroVaQ) study non-traders were substantially lower i.e. 3 to 5% for SG and 7 to 11% for TTO (Robinson et al., 2013).
To deal with non-trading in the SG, the traditional strategy has been to present people with smaller risks of death for example, 1 in 1,000, 1 in 10,000, in the hope that they will trade. However, when combined with WTP to estimate a VOLY or WTP-QALY this can result in extreme values. For example, in the Social Value of a QALY study the options presented were 1 in 100, 1 in 1,000, 1 in 100,000; and 1 in 1,000,000; 28% of respondents were only willing to take a 1 in 100,000 risk of death in a standard gamble question, implying WTP-QALY values in excess of £1 million (Baker et al., 2010).
To address this problem, in a subsequent study (EuroVaQ (Donaldson et al., 2010)) risk was expressed in a more gradual way (1 in 100; 1 in 200; 1 in 300; 1 in 500 and 1 in 10,000) than in the SVQ study (1 in 100; 1 in 1,000; 1 in 100,000; and 1 in 1,000,000). This appears promising but would need further testing in the piloting phase of an empirical study to ensure that responses are not an artefact of the methods/options and instead that they represent a reliable reflection of respondents’ preferences.
A key consideration in the design of the scenarios necessary for this framework will be to identify a set of health states or injuries to be used in the survey. This will require significant attention in the piloting stage to ensure that the severity of these injuries or health states are such that respondents will be willing to take some risk of death (SG) or sacrifice some time in perfect or full health (TTO) and also be willing to pay to avoid the impaired health state. For example, if the scenario described a very minor injury like a broken finger, many respondents are unlikely to take a risk of death in the SG to avoid this minor injury even if they would be willing to pay to avoid it. Alternatively, if the injury was very severe e.g. paraplegia, respondents are likely to take a risk of death on the SG but would be budget constrained in the WTP question.
This is important because it demonstrates that there will be empirical limitations to how much of the curve can be elicited and non-traders and budget constraints combine to set those limits. It may be difficult to identify 3 to 5 temporary health states that meet the requirements outlined. However, there are examples of a range of temporary health states being used in TTO and SG studies outside the VPF/VOLY/WTP-QALY literature that would serve as a starting point (see Stoniute et al. 2018; Oqwulu et al. 2017). As noted in Section 2.2.1, while the method outlined in Figure 1 is illustrated using a duration of one year, the chaining approach can be used with different durations as well as different levels of severity. This offers the potential of identifying the same point on the curve using different chains, serving to test the validity of the chaining approach (see below). The decision of what scenarios to use is an issue to investigate in the piloting phase.
Choice of appropriate health states is a necessary but not sufficient condition to the successful elicitation of points on the valuation curve. The difficulties that people have in understanding risks, in particular very small risks are well-documented elsewhere, but a general consensus has evolved in the mortality risk valuation literature with respect to this. To ensure respondents correctly interpret the probabilities in the SG exercise, it is important to incorporate a risk communication exercise, most usually risk grids in which respondents are shown for example a 100 square grid, with a small proportion of shaded squares to convey visually a respondent’s risk of dying (Robinson et al., 2013). This exercise should be interactive if possible, allowing respondents to make choices and receive feedback, to test comprehension before the start of the exercise.
Even with risk communication prior to the start of the exercise, significant problems may still arise from the complexities in the risk-risk trade off required in the modified SG question, developed in Carthy et al., (1999). These concerns, which were investigated during piloting, led directly to the decision in the SVQ studies (Baker et al., 2010) and the Valuation of Environment-Related Health Risks for Children study (Alberini et al., 2010), to not take it forward and instead to use a conventional SG where the comparator is a certain outcome[footnote 23].
However, more recent attempts at communicating risks have focussed on the wider information set in the scenario and have shown that it is possible to harness ‘spillover’ effects from incorporating incentivised decision-making experiments in a ‘learning’ phase prior to the valuation phase. Nielsen et al. (2010) showed that it was possible to establish valid preference rankings over different probability distributions generating the same gain in life expectancy. Nielsen et al. (2018) reduced the number of non-traders by employing a pre-survey learning experiment in which respondents make incentivised risky choices and also using a frame that focuses on the total risk or risks that respondents face.
Our conclusion is that the combination of increased validity of responses (for example, EuroVaQ) and improvements in design of the information set (“spillovers”) – both of which have been shown to reduce the number of non-traders – are sufficient methodological advances that should be harnessed to minimise the impact on the central tendency measures and to reduce number of responses trimmed from the data set to less than 10%.
However, researchers should not be complacent with respect to the challenges involved in incorporating such advances into a new study. Thus, new testing of this method should be conducted in the piloting phase to establish whether these new methodological developments can be incorporated and reduce the problem of non-trading.
3.1.3. Interactions in the chaining process
A further caveat relates to the feasibility of chaining health states using the SG approach. Doing so relies on the assumption that “indirect” and “direct” estimates of the utility of a health state are equivalent. However, there is some evidence in the health economics literature that indirect estimates of the utility of a health state are higher than direct estimates (Llewellyn-Thomas et al., 1982; Rutten-van Molken et al., 1995; Bleichrodt, 2001; Oliver, 2003). Similar findings have been reported in the VPF literature (Carthy et al., 1999; Balmford et al., 2019) and lotteries (Chilton and Spencer, 2001).
By design, the chained approach must link together a response from a WTP question with a response from a TTO or SG question. If there is error within the responses to either (or both) of the questions, there is the potential for the resulting VOLY estimates to be inflated (an issue driving the Spackman et al., 2011 recommendation for further testing of the method in the context of the VPF). Individuals may have imprecise or uncertain preferences, particularly for non-market goods (Dubourg et al., 1997; Butler and Loomes, 2007). Thus, it is recommended that approaches which account for uncertain preferences, such as Range-WTP are piloted during the design of the survey (Braun et al., 2016). At the very least, it implies that, the number of health states/injuries chained together should be kept to a minimum[footnote 24].
Each of these methodological issues have been presented separately here but, as noted, some of the solutions could be used to address more than one issue, for example, risk communication can reduce problems of insensitivity to scope and non-trading. Nevertheless, and as with all empirical methods, there are outstanding issues which have not yet been resolved in the literature on the chained approach. It is strongly recommended that any future study conduct an extensive pre-piloting phase to examine these issues before commencement of a large scale nationally representative study.
If, as recommended, estimates of the VOLY are based on discounted life expectancy then there are a number of options regarding the discount rate to use, which are outlined in Section 4.4. To elicit personal discount rates would require an extension to the current experimental design i.e. values for one-period risk reductions would be elicited for the coming year and for future years for example, 5 years, 10 years (see McDonald et al., 2016 for an example of such a design in the context of latent cancer risks).
3.2. Qualitative pre-testing
It is essential that the design and development stage of any new study includes qualitative methods, such as cognitive interviews, with members of the public to ensure respondent comprehension of the exercise. This is standard ‘good practice’, but there are a number of approaches that might be used. In this case, the proposed elicitation methods are relatively well established so the focus of qualitative developmental work should be respondents’ understanding and interpretation of the injury / illness scenarios, explanation of risk, presentation of WTP and SG questions, and time preference questions. Since there is a literature to draw on (Baker et al., 2014a; Chilton and Hutchinson, 2003; Baker and Robinson, 2004; Coast, 2017), any piloting should build on that work and focus on understanding of the ‘bespoke’ aspects of this study, the appropriateness and acceptability of presentational format and language, and limitations in terms respondent burden/fatigue. Concurrent ‘think-aloud’ techniques followed by brief interviews to follow each pilot survey would be appropriate (Coast, 2017). The qualitative pilot work should also seek to identify (and ‘design out’ where possible) issues that have arisen in previous studies, such as non-traders in health or wealth.
Beyond the development of the questionnaire, it would be instructive to have a subsample of main study respondents (n=approx. 50) complete valuation questionnaires together with ‘think–aloud’ techniques, immediately followed by brief qualitative interviews. Although the methods are the same as above the purpose and interview schedule would be different in this subsample, the purpose of which would be to investigate the construction of values and the rationales given by respondents for their values. This will be useful data to support and interpret quantitative findings and would ideally be conducted after a preliminary analysis of early survey completions. Respondents might be selected on the basis of, and qualitative interview schedules targeted towards explaining, any particular patterns of response. There might also be merit in exploring the perspectives of particular socio-demographic groups to get a sense of a range of different rationales.
Lastly, there is potential for an additional qualitative, deliberative and/or Q methodology study to run in parallel with (but separately from) the valuation work. This would explore more general, and in more depth, public perceptions of issues of interest to the funders. For example, using mini-publics (Escobar and Elstub, 2017) to investigate the views of the public in relation to contexts in which it might be acceptable for the value of a life year to vary and for their views on the process by which individual values for risk reductions are aggregated into a VOLY and a VPF. There are a number of methods that can be used, but generally deliberative approaches require provision of good information; time and resources for guided, reasoned deliberation and locating common ground, before coming to proposals and ideally consensus. Within the broad area of deliberation mixed qualitative and quantitative techniques can be used, including voting methods and Q methodology (Baker et al., 2006; Baker et al., 2014b).
3.3. Sampling
The sample size should be sufficiently large to make claims about representativeness of the UK general population based on demographic quotas for age, gender and socioeconomic classification; this is envisaged as no fewer than 1,000 participants. As will be outlined in Section 4 of this report, it will be particularly important to have sufficient sample size to conduct age-specific analyses.
3.4. Survey administration
The survey should be delivered using computer assisted technology to allow for personalisation of the survey design, for example based on respondents’ current age, projected life expectancy or health status. The survey could be interviewer administered or via the internet using an online panel and reviews by Nielsen (2010) and Lindhjem and Navrud (2011) comparing internet with other survey modes do not observe substantially different welfare estimates.
As outlined in RQII, there are trade-offs in both modes of delivery. Interviewer administered surveys allow respondents to ask questions while completing the survey to enhance comprehension of the task. However, there is the potential for interviewer effects and respondents may give what they consider to be the ‘correct’ answer rather than a true preference. It is also resource intensive and therefore sample size is likely to be reduced. Online surveys via internet panels give the opportunity to increase the sample size and to collect data faster. Surveys should be designed to be understandable without the aid of an interviewer, but the risk associated with online surveys is that respondents will ‘click through’ if they consider the survey to be difficult (or time consuming). Internet based surveys are only available to those who are online, and although internet penetration has significantly increased in the UK, there are some demographic groups (for example older women) who engage less online.
The survey administration mode should be justified with reference to the acceptability to respondents and confidence in the mode to convey the concepts correctly. Both interviewer-delivered and online modes of administration should be tested in a pilot study following the development of the computer assisted programme to test for comprehension of the exercise. A priori, given the importance of the proposed study and the need to have as much confidence in the resulting values as possible, a potential solution would be to have an interviewer delivered survey for the VOLY valuation data and on-line versions utilised to explore further, related research questions noted elsewhere in this report.
3.5. Data handling and analysis
An appropriate data handling and analytical strategy should be developed that would allow for the estimation of a value function at the individual and aggregate level and produce a generic VOLY. The analytical strategy should follow practice applied in the previous VPF studies and remove non-traders and protest responses. Additionally, to ensure good practice, approaches to data cleaning and trimming should be considered and specified ex ante as part of the design phase in advance of the data analysis. In addition, econometric techniques to deal with skewed data sets (common in all areas of non-market valuation) can also be deployed, although this should not substitute for collecting ‘good’ data in the first place.
Section 4 now follows in which we consider some broader cross-cutting issues.
4. Cross-cutting issues arising from the literature reviews
4.1. Introduction
This section sets out the cross-cutting recommendations and key issues that apply when estimating and implementing the VOLY. Some issues relate to features to be accounted for if new primary research was undertaken, as recommended in Section 2 of this report. Other features relate to the application of the VOLY in policymaking and apply even if no new research is conducted. This report does not promise a ‘final word’ on the issues raised in this section, since many are a matter of judgement for policymakers (which could usefully be informed by new qualitative research). It does, however, provide our opinion on the most appropriate way to proceed where such an opinion can be supported by theoretical or empirical evidence underpinning this report.
4.2. What would a new study aim to achieve?
Any new primary research should generate up-to-date, robust, reliable conclusions about the monetary VOLY according to the preferences of a representative sample of the UK population. The literature reviews and this synthesis report have highlighted the justification for such a study, a new conceptual framework to underpin it, and possible empirical approaches. However, beyond providing empirical estimates of the value function (Figure 1), a new study could provide additional benefits as follows:
- methodological research that investigates the robustness of new and existing empirical findings; explores the influence of behavioural biases and heuristics that may influence responses to preference elicitation tasks; and/or, provides the foundations for elicitation techniques that could be employed in future (for example, exploring the potential for direct valuation of changes in survival curves)
- investigations into the effect of contextual features highlighted in RQIII and RQIV. We recommend focusing on the features that are theoretically relevant for the VOLY (i.e. age, discounting) or that have been demonstrated to matter empirically. Although a full empirical account of context effects would be beyond the scope of any single study, it may be fruitful to empirically investigate the most important features. Contextual features defined in terms of respondents’ personal characteristics (gender, location etc.) would be investigated as standard in an empirical study
- using a relativities approach (see RQII), alternative types of VOLY[footnote 25] could be estimated. For example, to capture the VOLY generated by ongoing risk reductions, the method generated by Nielsen et al. (2010) could be implemented
- as outlined in the previous section, additional qualitative research could provide a measure of public understanding and acceptance for the implications of the quantitative findings. Taking this qualitative approach as a complement to the quantitative main study would also allow public input into some of the issues raised throughout this study that cannot be quantitatively decided, for example how they would prefer to resolve the incompatibility between an age-independent VOLY and an age-independent VPF
4.3. The incompatibility between a constant VPF, a constant VOLY and a constant WTP-QALY
Both the prevention of an immediate fatality and life expectancy gains could be generated by small individual one-period reductions in mortality risk for the affected group. For policy purposes, the WTP-based values are aggregated into a VPF and VOLY, respectively and the VOLY is given by the VPF for the affected group divided by mean remaining (discounted) life expectancy for the affected group (see also discussion in RQV). The 2 measure are thus intimately related and both are consistent with expected utility theory. Although some evidence exists to support an inverted u-shaped relationship between age and the VPF (whereby the VPF is lower for older and younger age groups) a constant, age-independent VPF is applied in policy. The formal relationship above means that a VOLY, by definition, will be age-dependent if the VPF is constant. However, the application of an age-independent VPF is based on equity principles. If applied to the VOLY as well, then a conceptual incompatibility (from an efficiency point of view) between an age-independent VPF and an age-independent VOLY (or WTP-QALY) cannot be avoided but can be justified on equity grounds.
To illustrate the implications of imposing an age independent VOLY and age-independent VPF, we set out some example projects. Suppose that the Government has funds to spend on one (but not all) of 3 alternative projects, A, B and C. Project A benefits 1000 individuals of an older age with 10 years of discounted remaining life expectancy. Project B benefits 1000 individuals of a younger age with 40 years of discounted remaining life expectancy.
Suppose projects A and B each offer a reduction of 1/1000 in the current period hazard rate, meaning that each prevents one statistical fatality. For project A, which helps the older individuals, this is a gain of statistical life years. For policy B, which helps the younger individuals, this is an improvement of statistical life years. Project C benefits the group of 1000 older individuals, reducing their risk of death by 4/1000, generating a gain in life expectancy of statistical life years, or preventing 4 statistical fatalities.
Age-independent values
Suppose that the VPF is set at £1.8 million and that population average, appropriately discounted, remaining life expectancy is 30 years. Based on the argument set out in the Technical Appendix it then follows that the VOLY would be set equal to £1,800,000/30 = £60,000.
If we apply the age-independent VPF to policies A and B, each would be valued at £1.8 million and the policymakers would be indifferent between them. If instead we apply the age-independent VOLY to the policies, Policy A would be valued at £600,000 and Policy B would be valued at £2,400,000, with Policy B clearly preferred. For project C, applying a constant VOLY would mean it was valued at £240,000 (the same as project B) but if a constant VPF is applied it would be valued at £7,200,000.
Table 1: Appraising projects using age-independent VPF and VOLY
| Project | Discounted remaining LE of affected group (years) | Reduction in hazard rate | Statistical fatalities prevented | Statistical life years (SLYs) (or QALYs) gained | Value assuming constant VPF = £1.8 million | Value assuming constant VOLY = £60,000 |
|---|---|---|---|---|---|---|
| A | 10 | 0.001 | 1 | 0.01 SLY | £1.8 million | £600,000 |
| B | 40 | 0.001 | 1 | 0.04 SLY | £1.8 million | £2.4 million |
| C | 10 | 0.004 | 4 | 0.04 SLY | £7.2 million | £2.4 million |
Using the constant VPF the preference ordering of projects would be C>A=B. Using the constant VOLY it would be B=C>A. This illustrates the inconsistency in implications. The projects are outlined in Table 1.
Consider an additional Project D offering a gain in QALYs of 0.02 to each group. Valuing this at the constant VOLY rate of £60,000, the value of this policy would be 0.02∙1000∙£60,000 = £1,200,000 for each group. Clearly, the group of older individuals would prefer Policy D over Policy A (since it delivers 0.02 QALYs instead of 0.01 statistical life years). But if the constant VOLY is used to value project D and the constant VPF is used to value project A, then A would be prioritised over D, contrary to the preferences of the affected group. This demonstrates that not only are the policy implications internally inconsistent but they have the potential to misallocate resources.
Age-dependent values
Finally, consider a case where the VPF and VOLY are allowed to vary with age. Suppose the older group report a VPF of £1.2 million with a VOLY of £120,000. Suppose the younger group report a VPF of £2 million with a VOLY of £50,000. The recalculated values are presented in Table 2. Note the consistency within and between projects.
Table 2: Appraising projects using age-dependent VPF and VOLY
| Project | Discounted remaining LE of affected group (years) | Reduction in hazard rate | Statistical fatalities prevented | Statistical life years (or QALYs) gained | Value assuming age dependent VPF | Value assuming age dependent VOLY |
|---|---|---|---|---|---|---|
| A | 10 | 0.001 | 1 | 0.01 SLY | £1.2 million | £1.2 million |
| B | 40 | 0.001 | 1 | 0.04 SLY | £2 million | £2 million |
| C | 10 | 0.004 | 4 | 0.04 SLY | £4.8 million | £4.8 million |
The additional project D would be valued at £2,400,000 for the older group and £1,000,000 for the younger. For the older group it would (correctly) be prioritised over project A and for the younger group it would (correctly) be passed over in favour of Policy B, regardless of whether the VPF or VOLY was used to value the policies. Clearly, therefore, the use of an age-independent VPF and an age-independent VOLY (or WTP-QALY) is likely to lead to suboptimal allocation of public sector funding and if this potential problem is to be avoided it will be necessary to allow the VOLY and/or the VPF to vary with age. For example, if it is decided that the VPF must be held constant, then the VOLY will need to be increased at an appropriate rate with age, whereas a constant VOLY would require that the VPF should be a decreasing function of age.
Our conceptual framework allows each of the VPF, VOLY and WTP-QALY to be estimated in the special case of changes in life expectancy generated by one-period changes in the risk of dying (in the standard gamble). It does not, however, resolve the conceptual incompatibility for policy of an age-independent VPF and an age-independent VOLY or WTP-QALY referred to here.
There are policy applications where the VPF, the VOLY, or the WTP-QALY are currently deemed most appropriate. For example, the WTP-QALY can account for the relative value of changes in quality and duration of life, the VPF is appropriate for valuing one-period marginal fatality risk reductions, and the VOLY handles ongoing changes in risks of fatality that generate changes in life expectancy.
If a constant VPF and a constant VOLY are used despite their fundamental incompatibility, this would imply an over-valuation of older members of the population compared to younger ones when the constant VPF is employed, and would imply over-valuation of younger members of the population relative to older ones when the constant VOLY is employed. To ascertain the magnitudes of these distortions, it will be necessary to estimate age-dependent values as benchmark against which the results of applying age-independent values can be compared. This necessitates a large enough sample of respondents to elicit age-specific estimates of the VOLY, VPF and WTP-QALY.
To further explore the effects of age on the VOLY, it would be interesting to ask respondents to value risk reductions with different lead times, disentangling the effects of age at the time of the survey and age at the time of the risk reduction. Furthermore, attitudes to age and age-consistency in values could be explored in qualitative research. We consider these to be useful possible extensions of the current proposal, although not necessary for the operationalisation of the framework.
4.4. Discounting for delay
RQIV outlined the different roles of discounting in the VOLY framework on 2 levels: the personal discount rate governing individuals’ valuations; and the social discount rate applied in policy when valuing future benefits.
Regarding personal discount rates, if individuals discount the utility associated with living through the future years and decades that make up their life expectancy, discounting will be inherent in the VPF and the VOLY. Earlier in this report, and in the Technical Appendix, we demonstrated the importance of the personal utility discount rate in our framework. We argue that the VOLY should be calculated on the basis of discounted remaining life expectancy, since, discounting is important in interpreting the TTO and SG responses, which are central to the empirical framework we propose. In the context of the VOLY, the personal discount rate brings additional considerations compared to the VPF, because the personal discount rate may influence preferences for gains in life expectancy generated in different ways, for example by one-off versus ongoing changes in fatality risk.
We recommend that any future empirical work should acknowledge the role of the personal discount rate in determining stated preference responses in the VPF or VOLY context, even when the risk reduction is immediate and one-period in nature. Studies should measure and control for individual discounting, eliciting estimates of individuals’ time preferences as part of a large study. At the least, researchers should explore the robustness of their VOLY estimates to different discount rate assumptions.
Methods for eliciting and controlling for personal discounting are available. If we assume that the discount rate is portable between contexts, simple approximations can be made by eliciting time preferences through choices between smaller money amounts sooner versus larger ones to be received later. However, since the rate of discounting for money may not be the same as the rate of discounting for future utility, more sophisticated approaches may need to be adopted. Research along these lines was presented in McDonald et al. (2017) and further development of these approaches in the VOLY context is currently being underway[footnote 26]. Specifically, that project aims to develop methods for directly eliciting effective discount rates from choices between fatality risk reductions, and to ascertain the role of discounting in explaining preferences for different types of VOLYs. An alternative approach would be to directly elicit discounted remaining life expectancy in the survey. This approach would entail asking respondents to engage in standard gambles between outcomes that would apply for the rest of one’s life. Specifically, they would be asked to consider a health state set to last for 1 year then return to normal health and imagine a treatment where, if the treatment is successful, it would allow the avoidance of the temporary health state, whilst if it is unsuccessful the temporary health state would persist for the rest of one’s life. The probability of treatment failure that would render the participant indifferent between the temporary illness and the gamble can be shown to reveal subjective discounted life expectancy. The benefit of such an approach is that it eliminates the need to find out specific estimates of discount rates for future utility. The drawback is that it does not provide information about the way that discounting manifests itself, nor on the functional form of discounting. The preferred approach would depend on the scope of any primary research, with more information about discounting preferred to less given sufficient scope and sample size for its meaningful analysis.
Regarding the policy application of a social discount rate to future gains in life expectancy, there is ongoing debate about the appropriate rate at which society (and hence government) ought to discount the future utility of generations alive today, and the utility of future generations. The literature review in RQIV outlined key elements of this debate and provided an overview of public opinion on the matter from a variety of perspectives, but ultimately the choice of discounting approach for application in assessment and appraisal of policy rests with the policymakers.
An important pitfall to avoid is to ‘double discount’ future utility. This could occur in situations where social discounting is applied to VOLY estimates for changes in risk within the lifetime of the current generation, since the VOLY estimates would already incorporate discounting at the individual’s personal rate. 2 alternative solutions exist: first, to respect personal discount rates and not apply any social discounting; and second, to ‘re-inflate’ individual valuations to their undiscounted value and then apply the social discount rate instead. The latter approach requires estimates of the personal discount rate an individual level. The decision about which approach should be taken rests on whether consistency in discounting is perceived to be more or less important than respecting individuals’ personal discount rates. Note that this problem relates to discounting within the current generation: discounting of the utility of future generations is subject to a largely separate debate outlined in RQIV and applicable much more broadly than the current context.
4.5. Dread and anxiety
The conceptual framework, preferred empirical approach, and the underpinning theoretical framework are based on the fact that gains in life expectancy can only be generated by perturbations in the survival function. The key underlying assumption is that the societal value of a reduction in fatality risk is a monetary estimate of the value of the gain in the total expected utility that would be enjoyed as a result of the risk reduction. However, it has been observed that individuals may not perceive hazard rate reduction in the same way as a gain in life expectancy, even though they are theoretically interchangeable. For instance, people may dread the prospect of sudden fatality (although existing evidence suggests there is no strong preference for reducing immediate risks (Nielsen et al. 2010; McDonald et al., 2016). People may value avoiding the grief that their loved ones would suffer in the event of their fatality, and they may feel that safety has a value per se (for example, through reduced anxiety or fear) instead of as a route to additional lifetime utility.
Nevertheless, if the underlying expected utility model is appropriately set up then it will include (if necessary) a very high disutility associated with the prospect of immediate death to reflect the dread effects etc. referred to. This will then mean that the implied VOLY associated with a gain in life expectancy resulting from a reduction in the hazard rate for the coming year will be very much larger than the VOLY for later year hazard rate reductions. As such, standard theory (see Jones-Lee et al., (2015)) could be extended to accommodate dread effects such as those described here.
Having said this, policies that generate gains in life expectancy do so by changing the probability of living to enjoy future periods. As such, we suggest that a conceptual framework such as the one we have proposed is a valuable approach to underpin policy evaluation of the value of fatality risk reduction. Nevertheless, care must be taken in the empirical estimation of the value function in Figure 1 to ensure that concerns like those we described do not unduly influence the values elicited. It may be appropriate to establish weights that could be used to amend the VOLY in circumstances where the safety improvements bring salient additional benefits, if empirical research supported their inclusion.
4.6. Behavioural biases and heuristics
Any empirical estimation of values for changes in survival probabilities, whether via the chained approach or not, must address the possibility that preferences do not conform to the standard Expected Utility Theory model. In RQIV we dealt with a range of behavioural biases that might impact stated preference values. These included probability weighting, whereby individuals over-weight low risks and underweight high ones (relevant especially in Standard Gamble elicitation), loss aversion (relevant especially when considering Willingness to Accept for losses in life expectancy), preference imprecision (relevant when chaining responses, if the preference imprecision leads to systematically higher or lower responses) and non-standard discounting, such as hyperbolic discounting. More fundamentally, if preferences are not well defined over the outcomes being valued, then responses may not be meaningful. Further to these, we discussed a range of well-documented survey response biases such as anchoring on previous cues or responses, or selecting midpoints of lists of options.
It is impossible to design empirical preference estimation techniques that wholly avoid such behavioural biases and heuristics. However, many issues can be minimised through careful survey design, piloting, comprehension questions and debrief. The proposed empirical framework helps to avoid some of the problems by breaking the elicitation of value into manageable stages such that extremes of probability need not be included, and by focusing on the domain of gains in life expectancy. In the future, even more sophisticated methods could be developed, such as correcting responses for the distortions introduced by, for example, probability weighting or loss aversion, by measuring the relevant preference parameters and weighting the responses accordingly.
Contextual features of elicitation scenarios such as the type of injury or fatality risk, may also influence responses to elicitation tasks, and as such any future research should recognise and, ideally, control for the influence of the specific contextual features of the elicitation scenario so that the estimated VOLY would be as free from contextual effects as possible. Alternatively, a generic VOLY could be proposed since this would maximise transferability across policy domains.
5. Conclusions
- the values currently recommended in the Green Book for monetarising life and health impacts – the VPF, the value of a SLY (or VOLY) and QALY – are based on a very small sample-survey of the UK public carried out in the 1990s
- in addition, these 3 measures are applied in ways that reflect difference in foci and traditions across UK government Departments, which allows for flexibility in approach. However, there is a danger that inconsistencies in how life and health is valued across different departments may arise
- consistency across policy is therefore highly desirable but this would require a new approach, one in which the 3 values could be brought together under a unifying conceptual framework and, if possible, empirically derived from a common source, reflecting the same underlying preferences over health and safety
- a conceptual framework has been set out in this report and empirical methods identified that would achieve this requirement, providing a significant advance on past studies by and hence would generate a VOLY that has a clear conceptual link to the value of a QALY and a VPF
- from a theoretical perspective, the one-period framework on which the proposed method is based is underpinned by recent theoretical work on discounting that establishes the conditions under which the values elicited from single and/or multi-period risk reductions can be expected to be equal. As such, there appears to be no imminent need for further theoretical development either prior to or during any new primary empirical research
- from an empirical perspective, a future study should be grounded in theory and reflect the fact that gains in life expectancy can only be generated by reducing fatality risks
- methods exist to operationalise the framework presented. In principle, they can be deployed in a new primary study but this should be subject to some further investigations and improvements. This suggests an in-depth and intensive approach to piloting since concerns have been raised that the chaining process amplifies the effect of people’s imprecise preferences on valuations, thereby increasing the number of outliers
- hence, any new study should incorporate existing methodological advances since 2011 – or develop new ones – to reduce the number of outlier observations excluded from the data. Appropriate econometric techniques for the analysis of skewed data should be applied
- any new quantitative primary study would benefit greatly from a parallel qualitative work. This could focus on methodological issues concerning the cognitive underpinning of responses to the component parts. It could also be used to explore broader issues such as peoples’ views on how their quantitative responses are used in by policymakers to value fatalities avoided, life expectancy gains and quality-adjusted life years and/or whether there are any contexts in which it might be acceptable for the value of a life year to vary
- conceptually either the VPF or the VOLY (or both) must be age dependent in order for their implications for resource allocation to be consistent. Therefore, any survey should be sufficiently large to be broadly representative of the UK population and designed so that the calculation of age-dependant VOLYs can be estimated in order to further understand the relationship between age and the valuation of life expectancy gains and of the VPF. Wider public policy considerations may lead to a policy decision to apply a constant VOLY and a constant VPF
- it is clear that what can be generated from a new study depends on how it is resourced. To make any new primary study worthwhile, it is useful to think of what appears most crucial for policy and, if provided, whether its findings would be translatable into a robust updating of the Green Book
- thus, we present some example options, organised into Tiers, in the Appendix whereby each Tier builds on and includes the previous Tier. With the exception of Tier 1, these should be considered as descriptive, rather than prescriptive. Tier 1 might be thought of as the ‘minimum’ that would be required for policy values reflective of the aforementioned criteria i.e. a methodologically rigorous, conceptually underpinned policy values. Tier 2 would extend this to incorporate a key issue that resonates with current policy interest but one that could also provide the foundations for more sophisticated evidence-based policymaking in the future. Finally, Tier 3 might be considered as primarily advancing academic inquiry into methodological and/or cross-cutting policy issues and, for all practicable purposes, may be better described as a suite of related studies
References
Alberini, A. & Markandya, A. (2006). Willingness to pay to reduce mortality risks: evidence from a 3-country contingent valuation study. Environmental and Resource Economics, 33(2), 251-264.
Alberini, A., Loomes, G.,Scasny, M. & Bateman I. (2010), Valuation of Environment-Related Health Risks for Children, OECD Publishing, Paris. https://doi.org/10.1787/9789264038042-en.
Alolayan, M.A., Evans, J.S. & Hammitt, J.K., (2017). Valuing Mortality Risk in Kuwait: Stated-Preference with a New Consistency Test. Environmental and Resource Economics 66(4), 629-646.
Attema, A. E., Edelaar-Peeters, Y., Versteegh, M. M. & Stolk, E. A. (2013). Time trade-off: one methodology, different methods. European Journal of Health Economics, 14, 53-64.
Baker, R., Bartczak, A., Chilton, S. & Metcalf, H. (2014a). Did people “buy” what was “sold”? A qualitative evaluation of a contingent valuation survey information set for gains in life expectancy. Journal of Environmental Management, 133, 94-103.
Baker, R., Bateman, I., Donaldson, C., Jones-Lee, M., Lanscar, E., Loomes, G., Mason, H., Odejar, M., Pinto-Prades, J.-L., Robinson, A., Ryan, M., Shackley, P., Smith, R., Sugden, R. & Wildman, J. (2010). Weighting and valuing quality adjusted life years using stated preference methods: preliminary results from the Social Value of a QALY project. Health Technology Assessment, 14 (27), 1-162.
Baker, R. & Robinson, A. (2004). Responses to standard gambles: are preferences ‘well constructed’? Health Economics,13, 37-48.
Baker, R., Thompson, C. & Mannion, R. (2006). Q methodology in health economics. Journal of Health Services Research and Policy, 11, 38-45.
Baker, R., Wildman, J., Mason, H. & Donaldson, C. (2014b). Q-ing for health – A new approach to eliciting the public’s views on health care resource allocation. Health Economics, 23, 283-297.
Balmford, B., Bateman, I.J., Bolt, K., Day, B. & Ferrini, S. (2019). The value of statistical life for adults and children: Comparisons of the contingent valuation and chained approaches. Resource and Energy Economics 57, 68-84.
Beattie, J., Covey, J., Dolan, P.,Hopkins, L., Jones-Lee, M., Loomes, G., Pidgeon, N., Spencer, A. & Robinson, A. (1998). On the contingent valuation of safety and the Safety of contingent valuation: part 1 -caveat investigator. Journal of Risk and Uncertainty, 17, 1, 5-26.
Bleichrodt, H. (2001). Probability weighting in choice under risk: an empirical test. Journal of Risk and Uncertainty, 23(2), 185-198.
Braun, C., Rehdanz, K. & Schmidt, U. (2016). Validity of Willingness to Pay Measures under Preference Uncertainty. PLoS ONE 11(4), e0154078-e0154078.
Brazier, J., Ratcliffe, J., Salomon, J. A. & Tsuchiya, A. (2017). Measuring and Valuing Health Benefits for Economic Evaluation, Oxford, Oxford University Press, 287-296.
Butler, D. & Loomes G. (2007). Imprecision as an Account of the Preference Reversal Phenomenon,. The American Economic Review, 97, 277-297.
Carthy, T., Chilton, S., Covey, J., Hopkins, L., Jones-Lee, M., Loomes, G., Pidgeon, N. & Spencer, A. (1998). On the contingent valuation of safety and the safety of contingent valuation: Part 2-The CV/SG “chained” approach. Journal of Risk and Uncertainty, 17, 187-213.
Champ, P. A. & Bishop, R. C. (2001). Donation Payment Mechanisms and Contingent Valuation: An Empirical Study of Hypothetical Bias. Environmental & Resource Economics, 19, 383-402.
Chilton, S., Jones-Lee, M., McDonald, R., & Metcalf, H (2012). Does the WTA/WTP ratio diminish as the severity of a health complaint is reduced? Testing for smoothness of the underlying utility of wealth function, Journal of Risk and Uncertainty,45(1), 1-24.
Chilton, S., Covey, J., Jones-Lee, M., Loomes, G. A & Metcalf, H. (2004). Valuation of health benefits associated with reductions in air pollution. DEFRA London.
Chilton, S. M. & Hutchinson, W. G. (2003). A qualitative examination of how respondents in a contingent valuation study rationalise their WTP responses to an increase in the quantity of the environmental good. Journal of Economic Psychology, 24, 65-75.
Chilton, S. & Spencer, A. (2001). Empirical evidence of inconsistency in standard gamble choices under direct and indirect elicitation methods, Swiss Journal of Economics and Statistics, 137(1), 65-86.
Coast, J. (ed.) 2017. Qualitative Methods for Health Economics, London: Rowman and Littlefield International Cummings, R. G. & Taylor, L. O. (1999). Unbiased Value Estimates for Environmental Goods: A Cheap Talk Design for the Contingent Valuation Method. The American Economic Review, 89, 649-665.
Devlin, N. J., Shah K. K., Feng, Y., Mulhern, B. & Van Hout, B. (2018). Valuing health-related quality of life: An EQ-5D-5L value set for England. Health Economics 27(1), 7-22.
Dolan, P., Metcalfe, R., Munro, V. & Christensen, M.C., (2008). Valuing lives and life years: anomalies, implications, and an alternative. Health Economics, Policy and Law, 3(3), 277-300.
Donaldson, C., Baker, R., Mason, H., Pennington, M., Bell, S., Lancsar, E., Jones-Lee, M., Wildman, J., Robinson, A., Bacon, P. & Olsen, J.A. (2010). European value of a quality adjusted life year. Final publishable report.
Dubourg, W.R. Jones-Lee, M.W. & Loomes, G. (1997). Imprecise preferences and survey design in contingent valuation. Economica, 64, 681-702.
Escobar, O. & Elstub, S. (2017). Forms of Mini-Publics: An introduction to deliberative innovations in democratic practice. Research and Development Note 4, New Democracy Foundation.
EuroQoL Group (1990). EuroQol – a new facility for the measurement of health-related quality of life. Health Policy 16(3), 199-208.
Franklin, D. (2015). Derivation of the monetary value of a QALY or SLY.
Grisolía, J.M., Longo, A., Hutchinson, G. & Kee, F. (2018). Comparing mortality risk reduction, life expectancy gains, and probability of achieving full life span, as alternatives for presenting CVD mortality risk reduction: A discrete choice study of framing risk and health behaviour change. Social Science & Medicine 211, 164-174.
Hammitt, J. (2002). QALYs vs WTP. Risk Analysis 22 (5), 985-1001.
Hammitt, J.K. & Haninger, K. (2010). Valuing fatal risks to children and adults: Effects of disease, latency, and risk aversion, Journal of Risk and Uncertainty 40, 57–83.
Hammitt, J. & Tuncel, T. (2015). Preferences for life expectancy gains: sooner or later? Journal of Risk and Uncertainty, 51(1), 79-101.
Hammitt, J.K.& Haninger, K (2017). Valuing nonfatal health risk as a function of illness severity and duration: Benefit transfer using QALYs, Journal of Environmental Economics and Management 82, 17-38.
Hammitt, J. Geng, F., Guo, X. & Nielsen, C.P. (2019). Valuing mortality risk in China: Comparing stated-preference estimates from 2005 and 2016. Journal of Risk and Uncertainty, in press.
HM Treasury (2018). The Green Book: appraisal and evaluation in central government. HM Treasury, London.
Johnston, R. J., Boyle, K. J., Adamowicz, W., Bennett, J., Brouwer, R., Cameron, T. A., Hanemann, W. M., Hanley, N., Ryan, M., Scarpa, R., Tourangeau, R. & Vossler, C. A. (2017). Contemporary Guidance for Stated Preference Studies. 4, 319-405.
Jones-Lee, M.W., Hammerton, M. & Philips, P.R. (1985). The value of safety: Results of a national sample survey. The Economic Journal 95, 49 -72.
Jones-Lee, M., Chilton, S., Metcalf, H. & Nielsen, J.S (2015). Valuing gains in life expectancy: Clarifying some ambiguities. Journal of Risk and Uncertainty; 51 (1), 1 -21.
Jones-Lee, M.W., Loomes, G. & Philips, P.R. (1995). Valuing the prevention of non-fatal road injuries: contingent valuation vs standard gambles. Oxford Economic Papers, 47, 676-695.
Lindhjem, H. & Navrud, S. (2011). Are Internet surveys an alternative to face-to-face interviews in contingent valuation? Ecological Economics, 70, 1628-1637.
Llewelyn-Thomas, H., Sutherland, H. J., Tibshirani, R., Ciampi, A., Till, J. E. & Boyd, N. F. (1982). The measurement of patients’ values in medicine. Medical Decision Making, 2(4), pp. 449-462.
Mason, H., Baker R.M. & Donaldson C (2008) Willingness to Pay for a QALY: past, present and the future. Expert Reviews of Pharmacoeconomics and Outcomes Research 8, 575-582.
Mason, H., Jones‐Lee, M. & Donaldson, C. (2009). Modelling the monetary value of a QALY: a new approach based on UK data. Health Economics, 18(8), 933-950.
McDonald, R., Chilton. S., Jones-Lee, M. & Metcalf, H. (2016). Dread and latency impacts on a VSL for cancer risk reductions. Journal of Risk and Uncertainty, 52(2), 137-161.
Mitchell, R.C. & Carson R.T. (1989). Using surveys to value public goods: the contingent valuation method. Resources for the Future, Washington, DC.
National Institute for Health and Care Excellence (NICE). NICE Process and Methods Guides. Guide to the Methods of Technology Appraisal 2013 (PMG 9). London.
Nielsen, J.S., Chilton, S.M., Metcalf, H. & Jones-Lee, M.W. (2010). How would you like your gain in life expectancy to be delivered? An experimental approach, Journal of Risk and Uncertainty, 41(3), 195-218.
Nielsen, J.S. (2011). Use of the Internet for willingness-to-pay surveys A comparison of face-to-face and web-based interviews. Resource and Energy Economics 33, 119–129.
Nielsen J.S., Chilton S. & Metcalf H. (2019). Improving the risk-risk trade-off method for use in safety project appraisal responses. Environmental Economics and Policy Studies, 21(1), 61-86.
Ogwulu, C.B., Jackson, L.J., Kinghorn, P. & Roberts, T.E. (2017). A Systematic Review of the Techniques Used to Value Temporary Health States. Value Health, 20(8), 1180-1197.
Oliver, A. (2003). The internal consistency of the standard gamble: tests after adjusting for prospect theory. Journal of Health Economics, 22(4), 659-674.
Robinson, A., Gyrd-Hansen, D., Bacon, P., Baker, R., Pennington, M. & Team (2013). Estimating a WTP-based value of a QALY: The ‘chained’ approach. Social Science & Medicine, 92, 92-104.
Rutten-Van Mölken, M. P., Bakker, C.H., Van Doorslaer, E. K. & Van Der Linden, S. (1995). Methodological issues of patient utility measurement: Experience from 2 clinical trials. Medical Care, 33(9), 922-37.
Ryen, L. & Svensson, M. (2015). The willingness to pay for a Quality Adjusted Life Year: a review of the empirical literature. Health Economics 24(10): 1289-1301.
Spackman M., Evans A., Jones-Lee M., Loomes, G., Holder, S., Webb H. & Sugden. R. (2011). Updating the VPF and VPIs: Phase 1: Final Report Department for Transport. London: NERA Economic Consulting.
Stoniute, J., Mott, D.J. & Shen, J. (2018). Challenges in Valuing Temporary Health States for Economic Evaluation: A Review of Empirical Applications of the Chained Time Trade-Off Method. Value Health, 21(5), 605-611.
The EuroQoL Group (1990). EuroQol – a new facility for the measurement of health-related quality of life. Health Policy 16(3), 199-208.
Torrance, G. (1986). Measurement of health state utilities for economic appraisal. Journal of Health Economics, 5, 1-30.
Tversky, A. & Kahneman, D. (1974). Judgement under uncertainty: heuristic and biases. Science 185(4157), 1124–1131.
Wolff., J & Orr, S. (2009). Cross-Sector Weighting and Valuing of QALYs and VPFs. A Report for the Inter-Departmental Group for the Valuation of Life and Health. Final Report 8(09).
Technical appendix: Estimating the WTP-based VOLY using the chained approach
By definition, an individual’s remaining life expectancy, E , is given by:
Equation 1
E = (1 - p1) + (1 - p1)(1 - p2) + (1 - p1)(1 - p2)(1 - p3) +…
where pt is the “hazard rate” for year t, i.e. the probability of death during year t conditional on survival to the beginning of the year. For the sake of simplicity, the specification of E in equation (1) assumes that if death is to occur during year t, then it does so at the beginning of the year.
From equation (1) it follows that the magnitude of the increase in life expectancy resulting from a reduction in the hazard rate for any particular year will be proportional to the magnitude of the reduction in the hazard rate concerned. In addition, it is clear that under any reasonable assumptions concerning the determinants of the typical individual’s remaining lifetime expected utility, the magnitude of the increase in the latter resulting from a reduction in the hazard rate for any given year will also be proportional to the size of the hazard rate reduction. It therefore follows that the magnitude of the gain in lifetime expected utility will be proportional to the magnitude of the increase in life expectancy. Given diminishing marginal utility of wealth, it is therefore clear that while the individual’s willingness to pay, WTP, for a gain of ΔE in life expectancy will be an increasing function of the gain, it will increase at a decreasing rate i.e. the function WTP = f(∆E) will be increasing but strictly concave. Thus, to put it simply, if a gain ∆E in life expectancy produces an increase ∆U in lifetime expected utility, then a gain of 2∆E in life expectancy will produce a gain of 2∆U in lifetime expected utility. But given diminishing marginal utility of wealth, the reduction in the individual’s wealth required to offset the gain of 2∆U in lifetime expected utility (i.e. the individual’s WTP for the gain of 2∆E in life expectancy) will be less than twice the reduction in wealth required to offset the gain of ∆U in lifetime expected utility (i.e. the individual’s WTP for the gain ∆E in life expectancy). The graph of the function WTP = f(∆E) relating the individual’s WTP to his/her gain in life expectancy will therefore take the following form:
Figure A1: Relationship between WTP and gains in life expectancy (LE)
Line graph showing 4 quadrants with an x axis of WTP and y axis of gain in LE. The two lines on the graph both cut through the centre of the quadrant: a diagonal dashed line going up from left to right and a solid curved line.
It should be noted that the negative WTP corresponding to negative gains in life expectancy in the graph reflects the individual’s required compensation i.e. his/her willingness to accept, WTA, for reductions in life expectancy. Given that the graph is constructed so as to pass smoothly through the origin, it is obviously based on the assumption that the individual’s preferences display no “reference point” effect reflecting loss-aversion. If, in fact, the individual’s preferences did display such an effect, then while the graph would still pass continuously through the origin, it would display a clear “kink” as it did so. However, given that the argument presented below in Section 1 will focus exclusively on WTP for genuine gains in life expectancy and will involve no reliance on the nature and magnitude of WTA for reductions in life expectancy, the possibility of loss-aversion and the resultant kink at the origin of the graph will be irrelevant. In particular, the gradient of the chain-dotted tangent line to the graph at the origin should be treated as the individual’s marginal rate of substitution of wealth for a gain (rather than a loss) in life expectancy. However, the way in which the argument developed below in Section 1 might be adjusted to accommodate willingness to accept compensation for decreases in life expectancy and hence provide a basis for estimation of a VOLY that is applicable to losses – rather than gains – in life expectancy, will be discussed below in Section 4.1.
Clearly, if it were possible to obtain an empirical estimate of the parameters of the function WTP = f(∆E) for an individual (or a group of individuals) then it would be a straightforward matter to use the function as the basis for deriving an estimate of the VOLY for the individual (or the group of individuals) for both marginal and non-marginal gains in life expectancy. Thus, for example, if we denote the ith individuals marginal rate of substitution of wealth for a gain in life expectancy (i.e. the gradient of the graph of WTP = f(∆E) at the origin) by mi, then summed across a large group of n individuals, aggregate willingness to pay for individual gains of 1/n of a year of life expectancy would be equal to ∑mi (1/n) = (1/n)∑mi which is simply the arithmetic mean of mi for the group concerned. But if each of the n individuals enjoys a marginal gain of 1/n of a year of life expectancy then aggregated across the group these gains sum to one year, so that aggregate willingness to pay can naturally be regarded as the Value of a Statistical Life Year or VOSLY. It therefore follows that the VOSLY for the group affected is given by the arithmetic mean of mi taken across the group.
If, by contrast, the gains in life expectancy enjoyed by individuals in the affected group were to be non-marginal – say 12 individuals each enjoying a one month gain in life expectancy – then it might be judged to be inappropriate to base the valuation on affected individuals’ marginal rates of substitution and to proceed instead on the basis of WTP for ∆E = 1/12, obtained from the estimated WTP = f(∆E) functions for the individuals concerned. Aggregated across the 12 affected individuals, a one month gain in life expectancy per person would sum to one year, so that total willingness to pay for the group could naturally be treated as the VOLY for the affected group for the non-marginal gains in life expectancy. Clearly, total willingness to pay for the group would be 12 times the arithmetic mean of each affected individual’s WTP for the one month gain which would, in turn, be equal to the arithmetic mean of the ratio WTP/∆E with ∆E set equal to 1/12.
In order to derive the VOLY for non-marginal gains in life expectancy for a “representative group” of affected individuals it might therefore be argued that it would be appropriate to set the VOLY equal to the population mean of the ratio WTP/∆E for the relevant non-marginal gain of ∆E per person in life expectancy. But the question of whether or not it would be appropriate to employ different VOLYs for marginal and non-marginal individual gains in life expectancy would, of course, be a matter of judgement for the public sector decision-making agency concerned.
Up to this point the argument has focused on gains in life expectancy – and the resultant gains in lifetime expected utility and hence willingness to pay – generated by a reduction in the hazard rate for a given year. However, it is entirely possible that the gain in lifetime expected utility (and hence willingness to pay) generated by a given gain in life expectancy may depend not only on the magnitude of the gain in life expectancy but also on the precise nature of the perturbation in the vector of future hazard rates that gives rise to the gain in life expectancy. If this is in fact the case then care must be taken to make the necessary adjustments to the estimated WTP = f(∆E) function to take account of any significant difference between the hazard rate reductions generating the life expectancy gain being valued and the hazard rate reductions underpinning the estimated WTP = f(∆E) function.
1. Empirical estimation of the WTP = f(∆E) function
But all of this having been said, the fundamental question is then how, in practice, the underlying WTP = f(ΔE) function might best be estimated at both the individual and group level? Focusing on estimation at the individual level, it is clear that this would require the implementation of a carefully structured representative sample survey. In order to avoid the conceptual and cognitive problems involved in asking survey respondents to place a direct value on gains in life expectancy[footnote 27], it would seem more appropriate to employ some variant of the so-called “chained” approach. This approach aims to break the valuation task down into 2 stages, each of which is designed to be more manageable for respondents from a conceptual point of view than direct valuation.
In particular, at the first stage of the chained approach the respondent is asked to specify his/her maximum WTP for a quick and complete cure for a non-fatal injury or illness of modest severity, with the symptoms and duration of the injury or illness clearly specified. At the second stage, the respondent is then presented with a Standard Gamble (SG) or Time-Trade-Off (TTO) question designed to determine the loss of life expectancy in normal (or full) health[footnote 28] that the respondent would regard as being equally as bad as suffering the non-fatal injury or illness. While an individual’s response to a TTO question provides a direct indication of the loss of life expectancy in full health that the respondent regards as being equally as bad as suffering the non-fatal injury/illness, in the case of an SG question the loss of life expectancy can be derived directly from the maximum probability of treatment failure that the respondent would be prepared to accept in a treatment which, if successful, would result in an immediate and complete cure for the injury/illness, but if unsuccessful would result in immediate death. In particular, if the individual’s maximum acceptable probability of treatment failure is π (so that the individual would be prepared to accept an increase of π in his/her first year hazard rate by undergoing the treatment), then it follows from the definition of remaining life expectancy that undergoing the treatment would involve a loss of life expectancy of πE/(1-p1) which, with p1 small (as will typically be the case for anyone below the age of 80), is effectively equal to πE.
Now suppose that at the first stage the respondent states that his/her maximum willingness to pay for a quick and complete cure for the injury/illness is £V and at the second stage he/she provides a response which implies that the illness/injury is equally as bad as losing ∆E years of life expectancy in normal health, thereby indicating that a quick and complete cure for the injury/illness yields the same gain in lifetime expected utility as a gain of ∆E years of life expectancy in normal health. It can then reasonably be concluded that since the individual’s maximum willingness to pay for a quick and complete cure is £V, then his/her maximum willingness to pay for a gain of ∆E years of life expectancy in normal health would also be £V[footnote 29]. In this way, the individual’s responses to the WTP and SG (or TTO) questions can be “chained together” to obtain an estimate of his/her WTP for a specific gain in life expectancy. By presenting the individual with WTP and SG (or TTO) questions for a number of different severities of non-fatal injury or illness it would then be possible to estimate the parameters of his/her WTP = f(∆E) function.
In order to obtain an empirical estimate of the parameters of an individual’s WTP = f(∆E) function from his/her responses to a set of WTP and SG(or TTO) questions it would clearly be necessary to specify a priori an hypothesis concerning the structural form of the function. Following the argument developed above, it is clear that the function would need to be strictly increasing, strictly concave and such that f(0) = 0. In addition, given that for the typical individual, budget constraints would place an upper-bound on the amount that he/she would be able (and hence willing) to pay for a gain in life expectancy – however large the gain – then it would seem appropriate to require that the function should be bounded-above.
Denoting WTP by V, one of the simplest functions satisfying the required properties would take the following form:
Equation 2
V = ∆E/(a + b∆E), a,b > 0.
Differentiating with respect to ∆E , it therefore follows that:
Equation 3
dV/d∆E = a/(a +b∆E)2
From equations (2) and (3) it is clear that ∆E = 0 => V = 0; that V is a strictly increasing and strictly concave function of ∆E and also that as ∆E ∞ so V 1/b, i.e. V is bounded above by 1/b. The function therefore satisfies the basic conditions set out above.
In order to obtain an empirical estimate of the parameters of the function using simple regression analysis, it would seem appropriate to make the following simple rearrangement:
Equation 4
∆E/V = a + b∆E. (4)
A straightforward bivariate linear regression analysis of ∆E/V on ∆E would then provide the required estimates of the parameters a and b. Following the argument developed above, the VOLY for marginal individual gains in life expectancy would then be given by the population mean of the derivative, dV/d∆E, evaluated at ∆E = 0 which, from equation (3), would be equal to 1/a, while the VOLY for non-marginal individual gains would be given by the population mean of V/∆E which, from equation (4), would be given by 1/(a + b∆E).
In fact, a version of the chained approach was employed by Donald Franklin in his 2015 paper “Derivation of the monetary value of a QALY or SLY” to obtain estimates of the population average WTP to avoid the QALY losses resulting from 2 non-fatal injuries. In particular, using the sample mean WTP responses reported in Carthy et al. (1999) for a quick and complete cure for injury W (2 or 3 days in hospital; slight or moderate pain; full recovery after 3 or 4 months) and injury X (2 weeks in hospital; some ongoing pain/discomfort; full recovery after 18 months) updated to 2014 prices, i.e. £3,193 for W and £9,689 for X, and the population average QALY losses associated with the injuries, i.e. 0.037 for W and 0.2 for X, Franklin estimates the VOLY for the non-marginal QALY gain associated with a cure for injury Was £3193/0.037 = £86,297 and the VOLY for the non-marginal QALY gain associated with a cure for injury X as £9689/0.2 = £48,445.
As already noted, the QALY gains used in Franklin’s calculations are, strictly speaking, indications of the gain in life expectancy in full or perfect health that the average individual would regard as being equally as desirable as a quick and complete cure for the non-fatal injury concerned and it is clearly possible that this might differ somewhat from the gain in life expectancy in the average individual’s normal (and therefore possibly less than perfect) health that he/she would regard as being equally as desirable as a quick and complete cure for the non-fatal injury[footnote 30]. While this possible difference is clearly a matter that requires careful consideration, the potential problem will be set aside for the time being and the implications of assuming that the QALY gains can be treated as gains in life expectancy in normal health will be explored.
Thus, if we treat Franklin’s WTP = £3,193 for ∆E = 0.037 and WTP = £9,689 for ∆E = 0.2 as constituting 2 observations from the “population average” WTP = f(∆E) function, then assuming that the function takes the form specified above in equation (2), it follows that a = 0.0954 x 10⁻⁴ and b = 0.5552 x 10⁻⁴. It therefore follows that the VOLY for marginal gains in life expectancy (i.e. 1/a) is £104,822, while the VOLY for non-marginal gains of one week per person (i.e. 1/(a + b[1/52])) is £94,271 and the VOLY for non-marginal gains of one month per person (i.e. 1/(a + b[1/12]) is £71,293. Using the estimated WTP = f(∆E) function to mirror Franklin’s calculation of the VOLY implied by the non-marginal gain of 0.2 years per person (i.e. 1/(a + b[1/0.2])) yields a figure of £48,440 which, given that Franklin’s estimate is £48,445, is rather reassuring! In turn, the estimated WTP = f(∆E) function allows the calculation of the non-marginal gain in life expectancy per person that would imply a VOLY equal to Franklin’s recommended figure for policy purposes of £60,000, which would be the gain, ∆E , such that 1/(a + b∆E) = 60,000. Solving for ∆E yields the result ∆E = 0.1284, i.e. a gain of roughly 47 days per person.
2. Discounting and the relationship between responses to TTO and SG questions
However, this estimate of the parameters of the “population average” WTP = f(∆E) function has relied on the assumption that the QALY losses used by Franklin can be treated as losses of life expectancy in normal health and, as already noted, this may involve some degree of error given that the TTO questions used to estimate the QALY losses are framed in terms of losses of life expectancy in full or perfect health rather than “normal” health.
But an arguably more significant difficulty involved in relating the estimated WTP = f(∆E) function derived from QALY losses and the corresponding estimate of the function based on responses to a standard gamble (SG) question arises as a result of the fact that, in modelling the typical individual’s response to both TTO and SG questions one should, strictly speaking, apply a personal discount rate to the stream of the individual’s future annual utilities when calculating his/her remaining lifetime expected utility. Thus, suppose that in response to a TTO question an individual indicates that spending T years in full health would be equally as desirable as spending 10 years with a particular illness or injury. Then denoting the utility of spending one year in full health by U and the utility of spending one year with the injury/illness by H, then under the TTO approach it is typically inferred that 10H = TU so that H/U = T/10 and hence that the QALY associated with one year suffering the illness is T/10. But if the individual actually applies a non-zero personal discount rate to his/her stream of future annual utilities then, strictly speaking, the appropriate discount factor should be applied to both T and 10 in computing the ratio H/U. However, given the relatively short durations involved and personal annual discount rates in the region of 6% , then for other than very serious illnesses or injuries yielding very small values of T in response to the TTO question, the error involved in setting H/U = T/10 will not be large[footnote 31]. But in the case of an SG question that asks for the maximum increase, π , in the risk of immediate death that the respondent would be prepared accept in a treatment which, if successful, would cure the injury/illness, it would appear to be essential to take account of discounting of future utilities. Thus, suppose that the individual is asked to assume that, if untreated, the injury/illness will last for one year and he/she indicates that the maximum risk of treatment failure (resulting in immediate death) that he/she will accept is π. Then denoting his/her remaining discounted life expectancy (computed using his/her personal discount rate) by Ê and setting the utility of death at zero, it follows that:
Equation 5
H + (Ê- 1)U = (1 - π)ÊU (5)
and hence, from equation (5), that:
Equation 6
H/U = (1 – πÊ). (6)
It is therefore clear that if the individual’s answer, T , to the TTO and, π , to the SG questions are both rational then T and π will be such that :
Equation 7
T/10 = (1 - πÊ). (7)
The loss of life expectancy equivalent to suffering the illness/injury for one year implied by the response to the SG question (i.e. πÊ) will be equal to the loss of life expectancy equivalent to suffering the illness/injury for one year implied by the response to the TTO question (i.e. 1 –T/10) only if the loss of life expectancy derived from the response to the SG question is computed on a discounted basis using the appropriate personal rate of time preference. The intuitive explanation for this that if reductions in the stream of an individual’s expected future annual utilities is to produce the same loss of lifetime expected utility as suffering the injury/illness for the coming year, then the reductions in the stream of expected future utilities must be subjected to discounting at the individual’s personal rate of time preference. This, in turn, clearly requires that the reductions in life expectancy that give rise to the reductions in expected future annual utilities must also be appropriately discounted.
It should also be noted that since equation (7) implies that the loss of life expectancy derived from the response TTO question is equal to πÊ, then the loss inferred from the TTO question will necessarily be the loss of discounted life expectancy equivalent to the injury/illness concerned. This having been said it should be added that, strictly speaking, precise equality between the loss of life expectancy implied by the TTO response and the loss implied by the SG response would also require that the TTO response should be adjusted to take account of discounting, but as already noted, the error involved in failing to make this adjustment will be substantial only in the case of more serious illnesses or injuries.
3. Comparison of the Franklin TTO-based VOLY estimates with estimates based on SG responses
In order to compare the VOLY estimates derived using Franklin’s version of the chained approach (which employed the TTO-based estimates of the QALYs associated with injuries W and X to derive the corresponding equivalent losses of discounted remaining life expectancy) with the VOLY estimates derived under the chained approach using the responses to the SG questions from the Carthy et al. (1999) study, it will be assumed a) that average remaining life expectancy is 40 years which, applying a discount rate of 6%, converts to 15 discounted life years, and b) that the appropriate central-tendency measures of the Carthy et al. (1999) SG responses are the median probabilities[footnote 32]. Based on these assumptions, the changes, π, in the hazard rate for the coming year that are equivalent to injuries W and X are 0.0021 and 0.011 respectively which, with discounted remaining life expectancy set at 15 years, yields equivalent gains, ∆E, in discounted life expectancy of 0.0315 for W and 0.165 for X, which do not differ greatly from Franklin’s TTO-based QALY loss figures of 0.037 for W and 0.2 for X. Using the Carthy et al. (1999) SG-based ∆E figures yields estimates of the parameters of the V = f(∆E) function specified above in equation (2) of a = 0.0818 x 10⁻⁴ and b = 0.5367 x 10⁻⁴, which are similar to those derived using Franklin’s QALY loss figures. Using these parameter estimates, the implied VOLY for marginal gains in discounted life expectancy is £122,249, while the VOLYs for non-marginal gains in discounted life expectancy of one week per person and one month per person are, respectively, £108,554 and £79,032, which are not grossly dissimilar to the Franklin figures of £104,822, £94,272 and £71,293. In the case of the VOLY for a non-marginal gain in discounted life expectancy of 47 days per person (which, under Franklin’s approach, implied his recommended VOLY of £60,000), the VOLY implied by the Carthy et al. (1999) SG-based parameters is £66,265. Of course, the clear similarity between the VOLY estimates derived using the Franklin TTO-based QALY losses and those obtained using the Carthy et al. (1999) SG results does depend on the use of the latter to derive the implied changes in discounted life expectancy. If, instead, the Carthy et al. (1999) SG results were used to derive the implied changes in undiscounted life expectancy then this would mean that all of the implied VOLY estimates derived above would effectively be multiplied by a factor of 15/ 40, which would imply that the VOLY figures for gains in discounted life expectancy would have to be reduced by over 60% in order to convert them to VOLYs for gains in undiscounted life expectancy.
All of this having been said, it should be emphasised that the SG questions used in the Carthy et al. (1999) study effectively required respondents to specify the increase in the risk of immediate death that would be equally as undesirable as suffering the injury concerned, with the duration of the health impairments resulting from the injury being only 3 or 4 months in the case of injury W and 18 months in the case of injury X. If, by contrast, the SG question is framed in terms of suffering the symptoms of an injury or illness every year for the rest of life (as in, for example, the study reported in Baker et al. (2010)), then it follows from expected-utility theory that the increase, δ, in the probability of immediate death that a respondent would regard as being equally as undesirable as suffering the symptoms of the injury or illness for the rest of his/her life would be such that:
Equation 8
ÊH = (1 – δ)ÊU (8)
where, as above, Ê denotes discounted remaining life expectancy, H denotes the utility of one year spent suffering the injury/illness and U denotes the utility of one year in full health. It therefore follows from equation (8) that H/U = 1 - δ, and hence 1 – (H/U) = δ, so that the loss of discounted life expectancy that the respondent regards as being equivalent to suffering one year of the injury/illness (i.e. 1 – (H/U)) is equal to the increase, δ , in the probability of death specified by the respondent in answer to the “ suffer the symptoms of the injury/illness every year for the rest of life” version of the SG question.
4. Some remaining issues
In addition to the points discussed so far, there remain 3 potentially important issues that have been mentioned in passing, but not discussed in detail. In particular, these are a) the derivation of a VOLY (or set of VOLYs) that would be applicable to losses, rather than gains, in life expectancy; b) the extent to which it might be necessary to adjust the VOLY estimated on the basis of gains in life expectancy generated by reductions in the hazard rate for the coming year in order to derive a VOLY that is applicable to gains in life expectancy generated by other types of perturbation in the vector of future hazard rates, such as a constant ongoing or proportional reduction in all of an individual’s future hazard rates; and c) the possibility that a VOLY estimated using WTP to avoid the TTO-based QALY loss resulting from a given injury/ illness might differ from the VOLY estimated using WTP to avoid the loss of life expectancy equivalent to the injury/illness derived from the response to an SG question, given that TTO questions are typically framed in terms of “full health”, whereas SG questions are framed in terms of the possibility of a return to “normal health”.
4.1. Estimating a VOLY for losses of life expectancy
In order to derive a VOLY that is applicable to a loss, rather than gain, of life expectancy, there are 2 obvious possible procedures. The first would be simply to rely on the WTP = f(∆E) function estimated from observed willingness to pay responses for gains in life expectancy and use the estimated function to derive the negative WTP (i.e. willingness to accept compensation (WTA)) for negative values of ∆E (i.e. losses of remaining life expectancy). This approach would obviously rely on the implicit assumption that the underlying WTP = f(∆E) function passes smoothly through the origin and that there is therefore no “reference point” effect reflecting loss-aversion. The alternative approach would be to estimate a separate WTP = f(∆E) function relating negative values of WTP (i.e. WTA) to negative values of ∆E (i.e. losses of remaining life expectancy) on the basis of observations concerning the sums that individuals indicate they would be prepared to accept as compensation for suffering specified injuries or illnesses.
If we actually apply the first approach and use the estimated parameters of f(∆E) derived above from the Carthy et al. (1999) mean WTP responses for injuries W and X, together with Franklin’s TTO-based QALY losses, then the implied mean WTA for injury W is £4,940 which is less than 25% of the mean WTA response for injury W reported in Carthy et al. (1999) updated to 2014 prices (i.e.£22,022). In addition, with the function f(∆E) taking the form specified above in equation (2) it follows that as ∆E - a/b, then WTP - ∞ , so that no sum, however large, would compensate for a loss of remaining life expectancy equal to or in excess of a/b. The “maximum acceptable” loss of life expectancy can therefore be treated as a/b which, based on the parameters of f(∆E) estimated above, is equal to (0.0954 x 10⁻⁴) / (0.5552 x 10⁻⁴) = 0.1718. Thus, according to this result, no sum – however large – should be acceptable as compensation for a loss of life expectancy equal to or in excess of 0.1718 years which, given that injury X involves a QALY loss of 0.2, sits somewhat uncomfortably with Carthy et al.’s (1999) finding that the mean WTA for injury X (updated to 2014 prices) was only £62,177. Clearly, therefore, if we take the Carthy et al. (1999) mean WTA results as a true reflection of the typical individual’s willingness to accept compensation for losses of remaining life expectancy, then it would appear to be necessary to estimate a separate f(∆E) function (possibly with a specification that differs from that given above in equation (2)) in order to derive VOLY estimates for losses, rather than gains, in remaining life expectancy.
4.2. Different types of perturbation in the vector of future hazard rates
Turning to the question of how the VOLY might be affected by the nature of the perturbation in the vector of future hazard rates that generates a given gain in remaining life expectancy, it is clear that if a given gain in an individual’s undiscounted life expectancy is generated by a reduction in one (or some) of his/her later hazard rates, then the gain in expected utility resulting from the hazard rate reduction will be subject to discounting at the individual’s personal rate of time preference. The resultant gain in discounted expected utility will therefore be less than the gain in discounted expected utility resulting from the same gain in undiscounted life expectancy generated by a reduction in an earlier hazard rate. The individual’s willingness to pay for the gain in undiscounted life expectancy generated by the later hazard rate reduction will therefore be less than his/her willingness to pay for the same gain in undiscounted life expectancy generated by a reduction in an earlier hazard rate. The magnitude of the VOLY applicable to gains in undiscounted life expectancy will therefore clearly depend on the precise nature of the perturbation in the vector of future hazard rates that generates the gains concerned. However, as shown in Jones-Lee et al. (2015), if gains in life expectancy are computed on a discounted basis using the personal rate of time preference, then under reasonable assumptions concerning the pattern of anticipated future annual utilities, the VOLY will be completely independent of the nature of the hazard rate reductions that give rise to the gain in discounted life expectancy. This, together with the argument developed above concerning the appropriate interpretation of TTO-based QALY losses and SG results, clearly provides a rather persuasive case in favour of defining the VOLY on the basis of gains in discounted life expectancy.
4.3. The “full health” vs “normal health” distinction
This then leaves the question of how to deal with the “full health” vs “normal health” distinction. It is clearly necessary to take account of this distinction if there is to be complete compatibility between VOLY estimates derived from TTO-based QALY losses and those obtained from the results of an SG-based study. In fact, the most straightforward indication of the implications of the distinction would appear to be provided by the results of a study reported in Mason et al. (2009). In particular, since a gain, ∆E , in life expectancy in full health would naturally be regarded by the typical individual as being more desirable than the same gain in life expectancy in normal health (which, for most people, will inevitably involve at least some health impairments at some stages in life), it can reasonably be expected that the VOLY estimated on the basis of WTP for a gain, ∆E , in life expectancy in normal health will be less than the figure that would emerge if the gain, ∆E , was adjusted to produce the equally desirable smaller gain in life expectancy in full health. By applying these downward adjustments to the implied gains in life expectancy using the UK population norms for EQ-5D QALY weights reported in Kind et al. (1999), Mason et al. (2009) find that the VOLY based on WTP for a gain in life expectancy in normal health is roughly 20% smaller than the figure which emerges following the downward adjustment to produce the equivalent gain in life expectancy in full health.
Thus, given the “full health” vs “normal health” distinction, if VOLY estimates are derived under the chained approach using SG-based gains in life expectancy (rather than TTO-based QALY gains), and these estimates are to be used to value QALY gains, then the VOLY estimates will not only need to be defined in terms of appropriately discounted life expectancy as argued above in Section 2, but will also require upward adjustment by about 20% in order to accommodate the “full health” vs ”normal health” distinction. By contrast, it is clear that if instead the chained approach is applied in the manner employed by Franklin (2015) using TTO-based QALY gains, then the resultant VOLY estimates will be directly applicable to the valuation of QALY gains.
Finally, it has to be admitted that the empirical estimation of the willingness to pay for gains in life expectancy function, WTP = f(∆E) , using the chained approach set out above is purely illustrative and has, of necessity, been based on just 2 different severities of non-fatal injury. The estimation has also used sample mean values for WTP, population mean figures for avoided QALY losses and sample medians for SG responses, rather than individual responses. Ideally, a full-scale study using the chained approach would be based on a larger number of severities of non-fatal injury or illness (for practical reasons, perhaps 3 or 4). In addition, given the potential problems associated with averaging and aggregation inherent in the chained approach – see, for example, Baker et al. (2010), Chapter 6 – it would seem appropriate to estimate the underlying WTP = f(∆E) function at both an aggregate and individual level and, when doing so at the aggregate level, to employ sample medians as well as means. In this way it should be possible to identify and allow for the potentially distortional effects of dubious “outlier” responses.
References for technical appendix
Baker, R. Bateman, I., Donaldson, C., Jones-Lee, M., Lancsar, E., Loomes, G., Mason, H., Odejar, M., Pinto Prades, J.L., Robinson, A., Ryan, M., Shackley, P., Smith, R., Sugden R. & Wildman, J. (2010). Weighing and valuing quality-adjusted life-years using stated preference methods: preliminary results from the Social Value of a QALY Project. Health Technology Assessment; 14 (27).
Carthy,T., Chilton,S., Covey, J., Hopkins, L., Jones-Lee, M., Loomes, G., Pidgeon, N. & Spencer, A. (1999). On the contingent valuation of safety and the safety of contingent valuation: Part 2 – the CV/SG “chained” approach. Journal of Risk and Uncertainty; 17 (3), 187 – 213.
Franklin, D. (2015). Derivation of the monetary value of a QALY or SLY.
Jones-Lee, M., Chilton, S., Metcalf, H. & Nielsen, J.S. (2015). Valuing gains in life expectancy: Clarifying some ambiguities. Journal of Risk and Uncertainty; 51 (1), 1 -21.
Kind, P., Hardman, G. & Macran, S. (1999). UK population norms for EQ-5D. Discussion Paper 172 , Centre for Health Economics, University of York.
Mason, H., Jones-Lee, M. & Donaldson, C. (2009). Modelling the monetary value of a QALY: A new approach based on UK data. Health Economics; 18, 933-950.
Appendix: Alternative options for new primary research study
All tiers
Underpinned by some common features:
- a generic ‘VOLY’
- intensive piloting
- an accommodation of the central role of time discounting by measuring respondents’ personal rate of time preference
- split-sampling. The nature of this cannot be identified a priori since it depends on the issue being investigated. For example, some methodological issues can be investigated using a within-sample approach, while others cannot. Triangulation or additional significant empirical investigations will almost certainly require a between-sample design. This means it is impossible to be indicative about sample sizes for Tiers 2 and 3 since this will be dependent on the issue or issues investigated. But broadly speaking, a new issue or a between sample design would require doubling the sample size
Tier 1
- a quantitative survey to estimate VPF, VOLY and WTP-QALY. It should be sufficiently large to further understand the relationship between the different measures. For the purposes of illustration assuming a sample size in the range 1,000-2,000, at the lower end a VOLY could be estimated controlling for the effect of age; at the higher end robust statistical analysis would enable the calculation of age-dependent VOLYs to establish if and how the value of the 3 measures changes with age
- a qualitative study focussed on the cognitive underpinning of responses to the component parts to improve the robustness of the quantitative data
Depending on how many health states were to be valued on the valuation curve; piloting may establish the need for a split sample approach. If so, this would increase the sample size needed to estimate a VOLY controlling for age.
Tier 2
As Tier 1 but extended to investigate a key issue such as:
- theoretically, equivalence in VOLY values has been established if life expectancy is discounted but empirical differences may arise for other reasons. Thus, a relative risk approach could be deployed to explore empirically if and/or how the values change when elicited under a multi-period framework
- explore what people think about how such data is used to value mortality risks and whether there are some circumstances in which it might be acceptable for the value of a life year to vary
Tier 3
As Tier 2 (assuming one key issue investigated):
- the other key issue
And one or more of:
- the impact of a behavioural bias or anomaly on responses
- a full triangulation exercise using a method that is demonstrably equivalent to or superior to the proposed method
- a systematic examination of different contextual effects
With respect to the last 3 possibilities, these are all analogous to how the VPF has been investigated over a number of years as opposed to being incorporated into an initial study primarily focussed on establishing and developing the value elicitation mechanism per se. Whilst it may be possible to explore them all simultaneously it may not even be desirable. Whilst some lessons are transferable from the VPF and WTP-QALY literature there are likely to be new issues relating to the VOLY that arise in the context of the new primary study that would be more useful to investigate in the future.
Annexes
- Annexe I: RQI: What are the relevant published estimates of the Value of a Life Year, and what are their strengths and weaknesses?
- Annexe II: RQII: What are the main methodological issues in deriving a Value of a Life Year and what approaches exist in literature for addressing these?
- Annexe III: RQIII: Can a Value of a Life Year be derived which is compatible with a Quality-Adjusted Life Year framework?
- Annexe IV: RQIV Is it possible to derive a context-free Value of a Life Year for application across different policy contexts?
- Annexe V: RQV: What is the relationship between the Value of a Life Year and the Value of a Prevented Fatality?
-
When applied in other evaluation contexts (mainly in health), QALYs are not monetised. ↩
-
To distinguish it from non-monetised measures of a QALY. ↩
-
Statement Of Service Requirements For The Provision Of A Scoping Study On The Valuation Of Risks To Life And Health: The Monetary Value Of A Life Year (VOLY). ↩
-
The purpose of this framework is not to identify categories of practical application for which the VOLY (as distinct from the VPF or WTP-QALY) is to be preferred. ↩
-
This would require the (future) development of a preference-based framework establishing how a VOLY elicited under the assumptions of expected utility theory maps to that elicited under the assumptions of SWB, which is beyond the scope of this report. ↩
-
An additional assumption is that more recent, UK-based studies would be more likely to represent current preferences than other studies, particularly if they also employed methodological advances in elicitation procedures developed since the early studies in the 1990s. ↩
-
Restricted to 21 papers reporting WTP-QALY estimates calculated from primary research studies. ↩
-
As the CBA framework sums values across the relevant population we follow this convention and present the basic presentation of the VOLY on the aggregate level which is also in line with the UK definition of VPF, see the discussion in Jones-Lee et al. (1985). ↩
-
For this discussion we focus on marginal utility of wealth. See RQV for a discussion of whether health status impacts on the marginal utility of income (consumption). ↩
-
Under the assumption that, at the origin, the function is well-behaved (continuous and twice differentiable) so that, at the origin, WTP is equal to willingness-to-accept (WTA). If, instead, preferences were reference-dependent, the function would be ‘kinked’ at the origin and marginal WTA would be greater than marginal WTP. However, evidence that does exist in the context of non-serious health states, suggests that there is no strong evidence available to reject the hypothesis of ‘smooth’ preferences (Chilton et al., 2012). ↩
-
We have chosen to present the procedures to arrive at aggregated values rather than describing the utility functions underlying the individual decisions. ↩
-
Note that aversion to immediate risk can be accommodated within this framework (see Section 4 of this report and RQV).Extending this framework to willingness-to-accept (WTA) for losses in life expectancy is considered in the Technical Appendix. ↩
-
Note that to illustrate, we use one year. This simplifies the equations included in Figure 1. However, the method can be adapted to use longer or shorter durations as well, where the latter would reduce any scope insensitivity arising due to budget constraints. ↩
-
See Carthy et al. (1999) for rational for and outline of its development. ↩
-
Note that the health state utility values could also be elicited in a new primary study (see Section 3). ↩
-
See Appendix in RQIII for a full description of SG and TTO approaches. ↩
-
Full health might be considered as perfect health, as defined by the particular health utility measurement scale applied, for example for EQ-5D it is (1,1,1,1,1) (see RQIII). ↩
-
The 6% rate used in this example is in line with much of the empirical literature (see RQIV for details). However, we recommend the elicitation of personal rates of time preference on an individual level in any new empirical research. ↩
-
Note that the framework does not preclude other stated preference approaches to elicit the WTP component of the ‘chained method’. ↩
-
Anchoring and adjustment’ refer to situations in which ‘people make estimates by starting from an initial value, which may be suggested by the formulation of the problem, and then adjust that value to yield the final answer’ (Mitchell and Carson 1989, p. 115). ↩
-
Note that while information on respondent’s income should be obtained as a matter of course in the demographics section of a survey, this cannot be used to estimate this impact. The main purpose of this variable is to test the economic consistency of WTP i.e. WTP should increase with income. ↩
-
Although this is consistent with what we would expect, theory has nothing to say about the magnitude of this effect and whether this might be expected to vary across domains. ↩
-
Having said that, Balmford et al. (2019) reported that the child VPF (relative to a parental VPF) elicited using a chained approach was much larger than might be expected based on the literature. They speculated that this might be due to double counting whereby a parent is both WTP a larger amount and take smaller risk of a bad outcome for their child relative to themselves. By chaining these preferences together the ‘premium’ is included twice. It is an open question as to whether ‘certainty’ effect dominates or not the double counting effect, if present. ↩
-
In addition, this issue could be further investigated in the context of exploring the impact of different interim health states to arrive at a particular point on the valuation function. ↩
-
The type of risk reduction for example, one-period or ongoing could be considered a contextual feature in the broader sense. While we base the proposed framework around a one-period risk reduction, to estimate other VOLY types would require additional questions in an empirical survey. ↩
-
ESRC Grant number ES/R005893/1 ‘Discounting for delay and the value of a life year lost to air pollution’ 2018–2020. ↩
-
The most obvious potential problem involved in asking respondents to place a direct value on a gain in life expectancy is that many people will understandably – but nonetheless mistakenly – interpret a gain in life expectancy as an “add-on” to survival time at the end of life. If the gain is only relatively small, then it would not be surprising if, treated as a marginal extension to survival time at the end of life, it was regarded by the respondent as being of little, if any, significance. ↩
-
Strictly speaking, TTO questions are framed in such a way as to indicate the loss of life expectancy in full or perfect health (rather than “normal” health) that the respondent would regard as being equally as bad as the non-fatal injury or illness. The implications of the possibility that the respondent may not be in full health will be examined below in Section 4.3. ↩
-
Strictly speaking, the chained approach provides a respondent’s WTP to avoid a small increase in the risk of immediate death and hence his/her WTP to avoid a small decrease in life expectancy. As such, this is therefore the respondent’s equivalent variation (EV) in wealth for the decrease in life expectancy, rather than his/her compensating variation (CV) for an increase in life expectancy. But by definition, an individual’s EV for a reduction in remaining life expectancy from E to E - x will necessarily be equal to his/her CV for a gain in life expectancy from E - x to E. Given that x will typically be very small in relation to E (for example, a matter of a few weeks or months relative to several years), it seems entirely reasonable to assume that the individual’s CV for a small gain in life expectancy from E - x to E will differ very little from his/her CV for the same small gain in life expectancy from E to E + x. On these grounds, the individual’s WTP response can reasonably be treated as a reliable indication of his/her CV for a gain, x, in life expectancy from its current level, E. ↩
-
In fact, the typical TTO question effectively asks the respondent to specify the time in full or perfect health that he/she would regard as being equally desirable as spending 10 years suffering the health impairment being valued. If the response is T years, then spending one year with the impairment is treated as being equivalent to spending T/10 years in full or perfect health so that the QALY associated with the impairment is set equal to T/10. This, in turn, can be taken to imply that spending one year with the impairment is equivalent to losing 1- (T/10) years in full or perfect health. However, if the respondent is already in less than full or perfect health then his/her indication that T years in full or perfect health would be equally as desirable as spending 10 years suffering the health impairment is actually an indication that suffering the health impairment in addition to whatever other health limitation he/she is subject to is equivalent losing 1- (T/10) years in full or perfect health. Arguably therefore, the QALY loss estimated using the TTO approach will, If anything, somewhat overstate the loss of life expectancy in full or perfect health that is equivalent to suffering the health impairment concerned. ↩
-
Thus, for example, at a personal annual discount rate of 6%, ten years spent suffering an illness/injury with annual utility H would yield a total discounted utility of 7.3601H. If T years in full health, yielding an annual utility U, were to afford the same discounted utility as ten years suffering the illness/injury, then denoting the present value of an annuity of T years discounted at an annual rate of 6% by Td , it would necessarily be the case that Td U = 7.3601H and hence the response to the TTO question would be such that Td = 7.3601 H/U. Suppose, then, that in fact H/U = 0.8. At a personal annual discount rate of 6% the response to the TTO question would be such that Td = 5.8881 which, at an annual discount rate of 6%, corresponds to a value of T of roughly 7.5. The individual’s response to the TTO question would therefore be that 7.5 years in full health would be equivalent to spending ten years suffering the injury/illness. If the effect of discounting was ignored and the H/U ratio taken to be 7.5/10 = 0.75, then this would clearly involve an underestimate of the true ratio (i.e. 0.8) of about 6%. If, by contrast, the illness/injury was more serious with H/U = 0.2, then at a personal annual discount rate of 6% the response to the TTO question would be such that Td = 1.47 which corresponds to a value of T of about 1.6. Interpreting this as implying a H/U ratio of 0.16 would therefore involve an underestimate of about 20%. ↩
-
Given that the mean SG responses in the Carthy et al. (1999) study are up to 4 times larger than the medians, this clearly reflects the impact of some upper-tail outliers, so that the medians would appear to be the more appropriate central tendency measures in making a comparison with the implications of the TTO-based results. ↩