UK defence and security export statistics for 2019
Published 6 October 2020

© Crown copyright 2020
This publication is licensed under the terms of the Open Government Licence v3.0 except where otherwise stated. To view this licence, visit nationalarchives.gov.uk/doc/open-government-licence/version/3 or write to the Information Policy Team, The National Archives, Kew, London TW9 4DU, or email: psi@nationalarchives.gov.uk.
Where we have identified any third party copyright information you will need to obtain permission from the copyright holders concerned.
This publication is available at https://www.gov.uk/government/statistics/uk-defence-and-security-export-statistics-for-2019/uk-defence-and-security-export-statistics-for-2019
Introduction
This statistical release comprises UK defence and security export performance data and analysis. The release principally focuses on 2019 data but includes historic data for context and trend analysis purposes.
UK defence export information is based upon data provided by UK companies via UK Defence and Security Exports voluntary survey of defence export contracts. Rest of the world data is derived from open source reporting of other countries’ defence export contracts.
Security sector data is compiled by Frost & Sullivan and counts sales of security equipment and services.
This is the seventh year that UK Defence and Security Exports (formerly DIT DSO) has published defence and security export figures as ‘Official Statistics’. This release has been compiled in conjunction with the DIT Statistics team, whose technical advice and support is acknowledged here.
Our defence statistics relate to exports to overseas Ministries of Defence and associated Armed Services.
The Defence Exports methodology has changed slightly this year, with effect from exports in 2019, we now count collaborative exports (such as Typhoon aircraft exports to partner nations such as Germany, Italy & Spain). UK Defence & Security Exports estimates that this accounts for over £600 million in UK Defence exports in 2019
Our security figures relate to sales. 2019 Security data is provided by a contractor called Frost & Sullivan, under a 3 year rolling contract to UK Defence and Security Exports. We have also included earlier data provided by Westlands Advisory.
Separate methodology papers for the defence and security statistics accompany this release on the gov.uk website.
All the information collected on the defence and security markets is vital to our understanding of the shape of the market and trends. It helps UK Defence and Security Exports target support to the defence and security industry.
Summary
On a rolling 10 year basis, the UK remains the second largest global defence exporter after the USA.
In 2019, the UK won defence orders worth £11 billion, compared to the previous year (£14 billion) and illustrative of the volatile nature of the global export market for defence.
The UK share of the global defence export market was estimated at 16% in 2019. The UK’s largest defence export markets were the Middle East, Europe and North America.
In 2019, the value of UK Security export sales was £7.2 billion, an increase from 2018 (£5.2 billion), lifting the UK to 3rd place (from 4th in 2018) in the rankings.
The UK’s largest security export markets were Europe, North America and Asia-Pacific.
Defence statistics
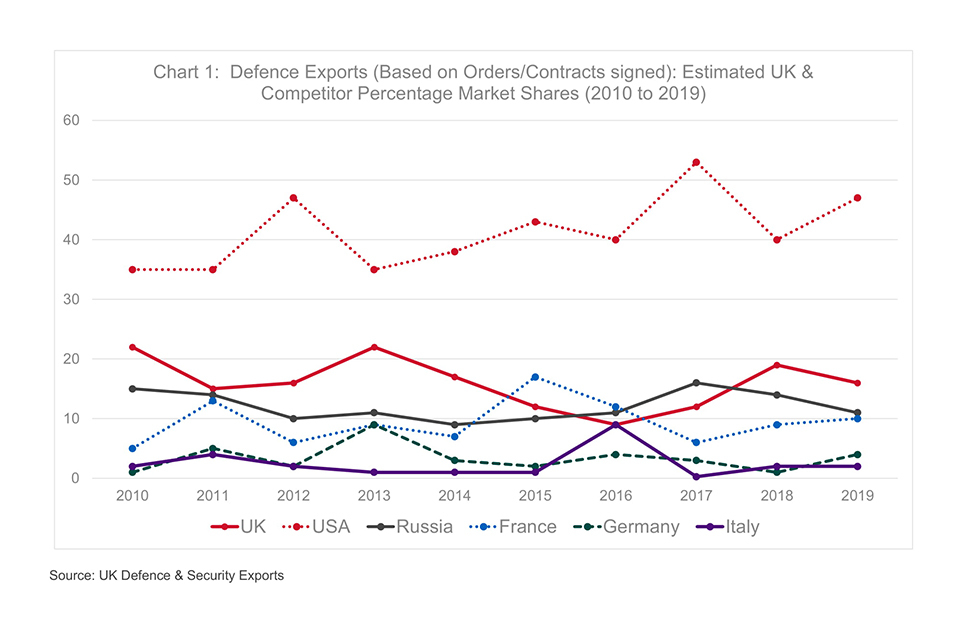
Chart 1: Defence exports: estimated UK & competitor percentage market shares (2010 to 2019)
Source: UK Defence & Security Exports
Chart 1 highlights UK and Competitor estimated defence export market-shares for the past decade, providing a good barometer of the competitiveness of the leading exporters in the global market.
The most obvious point to note is that the USA has annually achieved the highest estimated percentage of the global defence export market between 2010 and 2019. Our European competitors have consistently had a lower percentage share than USA.
The UK and France with their similar sized industries and equipment portfolios for export, have historically vied with Russia for 2nd or 3rd place, trying to close the gap with the USA.
In 2019, the USA achieved market-share, estimated at 47% (reflecting strong sales across all sectors), UK 16%, Russia 11% and France 10%.
Italy has traditionally enjoyed a relatively consistent level of defence exports. In 2016, the country rose to the sixth largest defence exporter for the period, partially as a result of a large naval contract, and in 2019, AgustaWestland secured helicopter deals with Egypt and Israel totalling over $1 billion.
Germany saw its estimated market-share peak at 9% in 2013 but in 2017, it did secure a big naval contract that helped its overall ranking. In 2019, it secured a major contract with Egypt for Meko A-200 Frigates worth $1.68 billion.
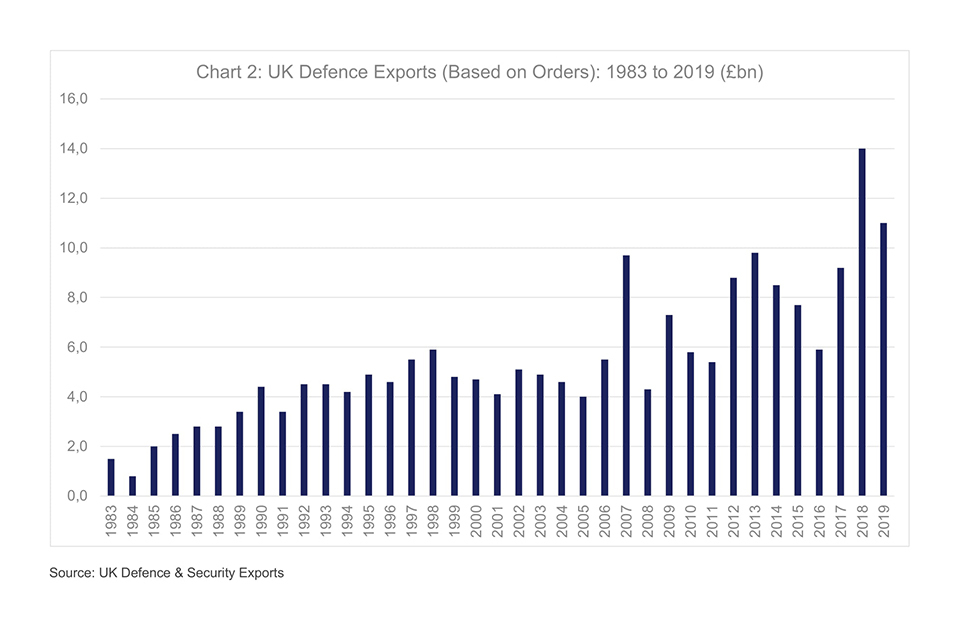
Chart 2: Annual value of UK defence exports 1983 to 2019 (£ billion)
Source: UK Defence & Security Exports
Chart 2 shows annual totals (in actual prices) for UK defence exports, with the variable nature clearly visible, an upward trend in value, 2018 as the best year ever and 2019 in second place.
It should be noted that the Defence Exports methodology has changed slightly this year, with effect from exports in 2019, we now count collaborative exports (e.g. Typhoon aircraft exports to partner nations such as Germany, Italy & Spain).UK Defence & Security Exports estimates that this accounts for an additional £600M in UK Defence exports in 2019. (We have not adjusted previous years figures).
The UK is one of the world’s highest defence exporters, averaging second place in the global rankings on a rolling ten-year basis (2010 to 2019), making it Europe’s leading defence exporter in the period.
Despite no major platform orders in 2019, core business remained strong. Aerospace remains the dominant sector for the UK, Middle East was the biggest market and the inclusion of collaborative projects in the statistics for the first time, increased exports to Europe.
As we reported previously, the UK has won significant defence orders during the past decade, including:
- Typhoon aircraft to Kuwait
- Typhoon aircraft and Brimstone missiles to Qatar
- Hawk & Typhoon aircraft to Oman
- Typhoon aircraft to Saudi Arabia
- Hawk aircraft to India
- helicopters to Norway and South Korea
- Trent 700 aircraft engines to France
- offshore patrol vessels (OPVs) to Brazil
- F-35 work and bridging to USA
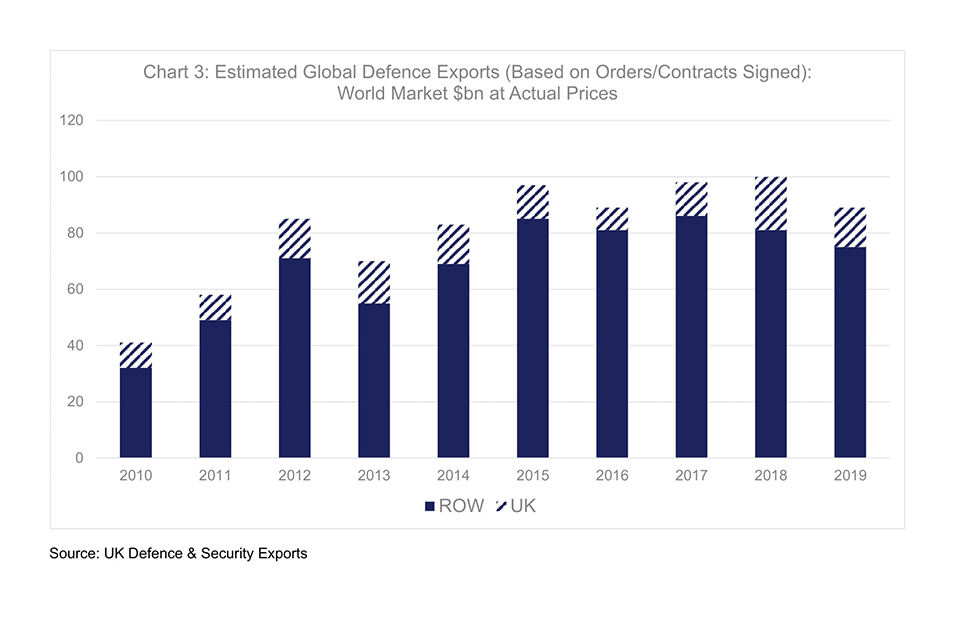
Chart 3: Estimated global defence exports (based on orders/contracts signed): world market $ billion at actual prices
Source: UK Defence & Security Exports
As we reported previously, year-on-year, the global defence export market experiences peaks and troughs in response to fluctuations in defence spending levels, threat perception and national requirements.
The global defence export market is estimated to have decreased from $100 billion in 2018 (the highest year ever) to around $89 billion in 2019.
Selected major global defence export deals in 2019 included:
- Russia - Lease of 6 x Akula submarines to India ($3.3 billion)
- USA to Saudi Arabia - Multi Mission Surface Combatant ships (MMSC) ($1.95 billion)
- Brazil to Portugal – 5 x Embraer KC-390 multi-mission airlifters ($932 million)
- Russia to Malaysia - Su-30MKM fighter aircraft refurbishment ($540 million)
- USA to Norway – 4 x P-8A aircraft ($595 million)
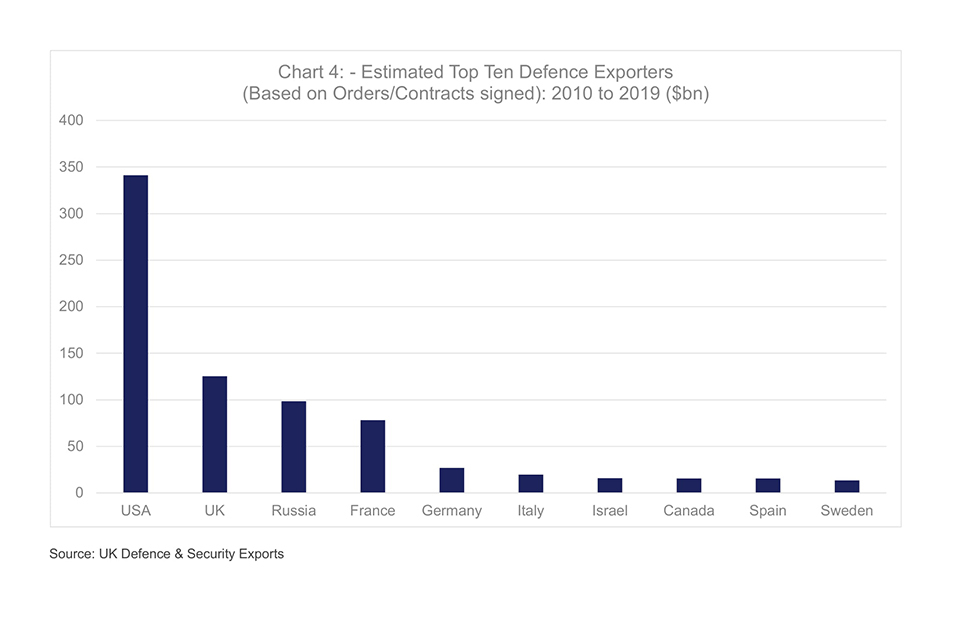
Chart 4: Estimated top ten defence exporters (based on orders/contracts signed): 2010 to 2019 ($ billion)
Source: UK Defence & Security Exports
Chart 4 shows that for the most recent ten-year period (including 2019 performance), the UK is the second largest defence exporter globally.
The UK is also Europe’s leading defence exporter ahead of Russia (3rd) and France (4th).
The USA is the world’s pre-eminent defence exporter, having secured more than double the exports (by value) of second-placed UK during the ten-year period.
There are no Latin American or African countries in the top 10 global defence exporters list, and the Middle East is represented by just one nation, Israel, ranked 8th.
Chart 5: Estimated value of defence import procurement by region 2010 to 2019, including the split between UK and rest of the world exports to each region ($ billion)
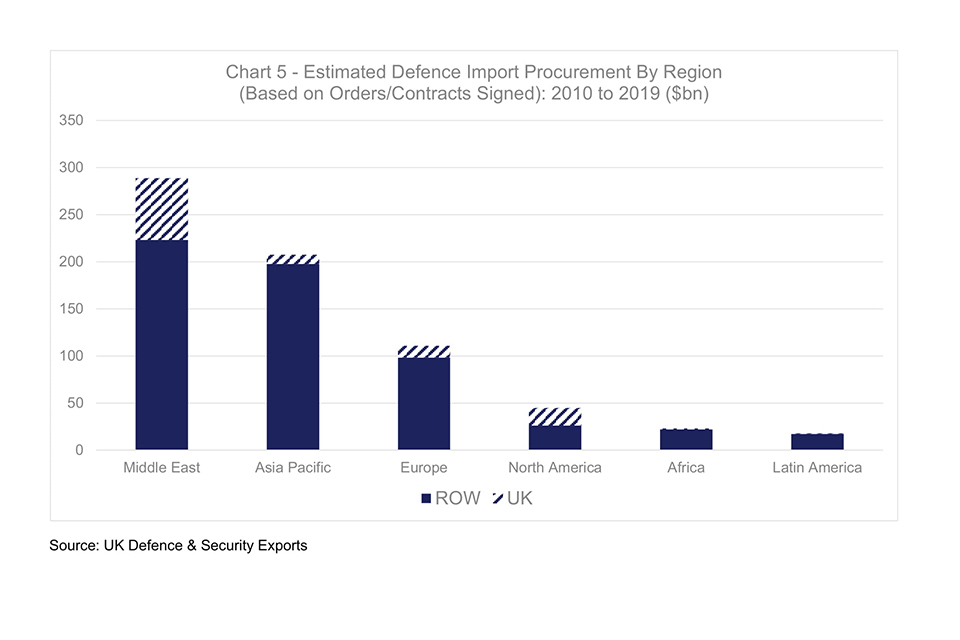
Source: UK Defence & Security Exports
As can be seen from this 2010 to 2019 regional importers chart, the Middle East is the largest regional importer of defence equipment & services, the same as reported last year. Saudi Arabia, Qatar, UAE & Egypt are major national importers, whilst the UK, USA and France are the major suppliers to the region.
The Asia-Pacific region has seen increased defence import activity in recent years, particularly in the aerospace and naval sectors. The UK has won major defence business in the region, including in 2013, when AgustaWestland won an AW159 helicopter contract with South Korea.
Europe is the third biggest regional importer, with the USA and local European industries strong.
Chart 6: Estimated top ten defence importer nations (based on orders/contracts signed): 2010 to 2019 ($ billion)
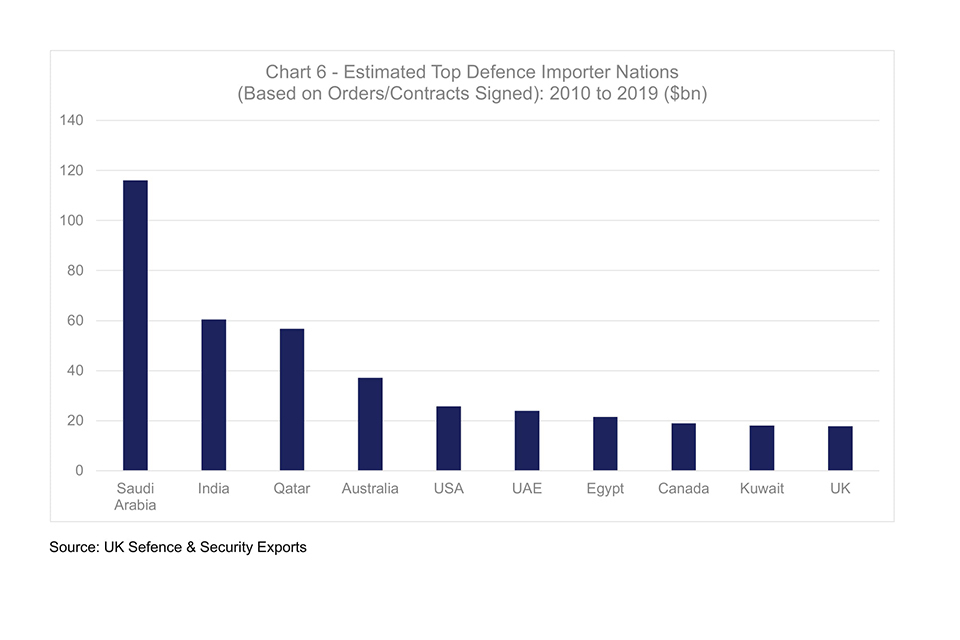
Source: UK Defence & Security Exports
The leading 6 global importers (Saudi Arabia, India, Qatar, Australia, USA and UAE) are the same rank as for the period 2009 to 2018.
The UK was the 10th biggest defence importer in the period.
The Middle East dominated global defence imports in the 2010 to 2019 period, with Saudi Arabia the world’s biggest importer.
Chart 7: Estimated total UK defence exports (based on orders/contracts signed) by region 2010 to 2019
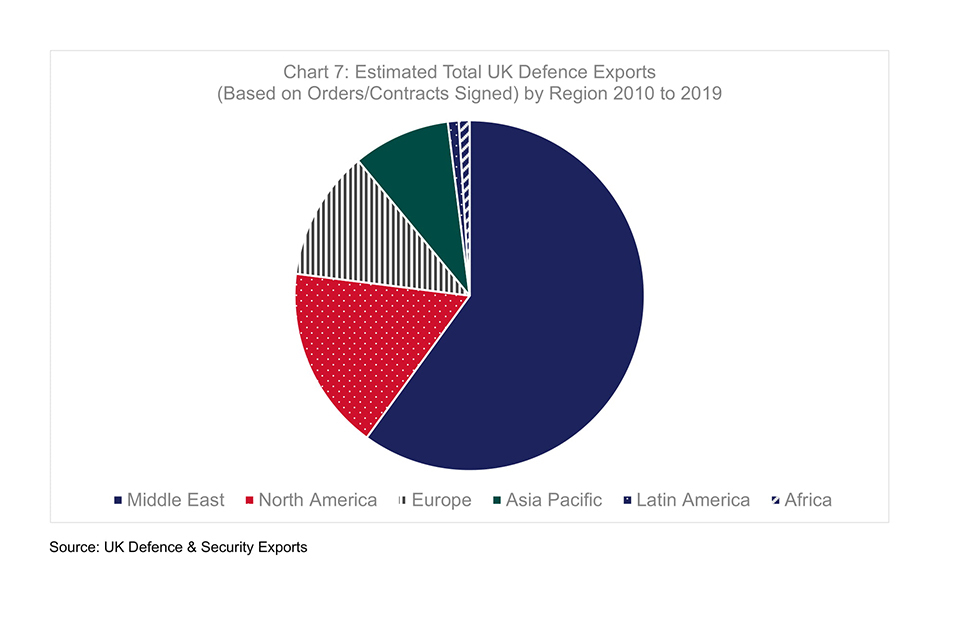
Source: UK Defence & Security Exports
Chart 7 shows UK defence exports by region based on total 2010 to 2019 figures, the segments highlighting regional percentages.
The Middle East remains the dominant UK export destination reflecting the continued importance of the market to the UK (and note, to our competitors too), and confirming the high levels of defence expenditure made by this region. Despite oil price volatility, most countries in the region were able to sustain defence expenditure levels.
North America was the second highest region for UK defence exporters, accounting for almost one fifth of total UK defence exports by customer destination. Europe and the Asia-Pacific were the next most important regional markets for the UK in this period.
Chart 8: Estimated percentage share of UK defence exports by region for the periods 2018 and 2019
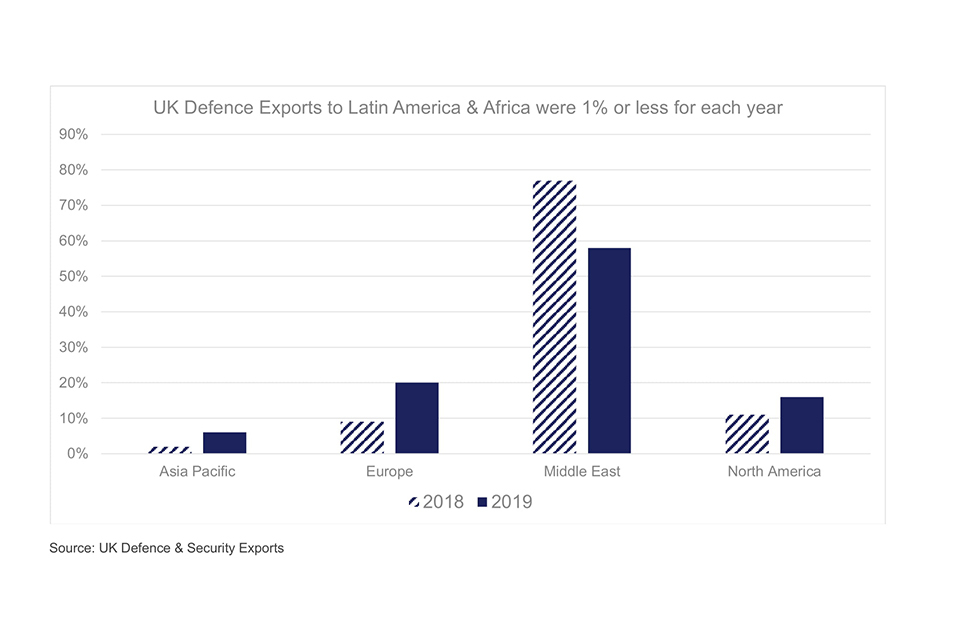
UK Defence Exports to Latin America & Africa were 1% or less for each year
Source: UK Defence & Security Exports
UK defence exports were greatest by value in the Middle East region for both years.
Exports to Europe in 2019 accounted for 20% of total defence exports (up from 9% in 2018) , displacing North America (16%) as the second best market. (collaborative exports to Typhoon aircraft partners in 2019 explains this rise in exports to Europe).
The Asia-Pacific region, previously 2% in 2018, rose to 6% in 2019.
UK defence exports to Latin America & Africa were around 1% in 2019.
Chart 9: UK and global defence export market (based on orders/contracts signed) by sector 2010 to 2019
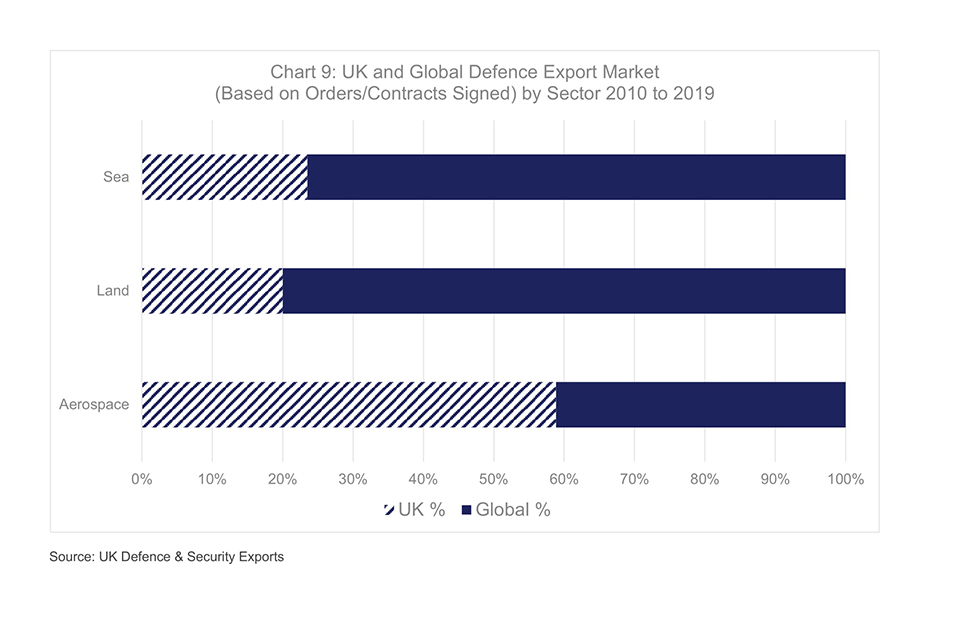
Source: UK Defence & Security Exports
Chart 9 depicts Global and UK defence export performance by sector across the 2010 to 2019 period based on orders/contracts signed.
As is evident from the top bar (the global % position), the aerospace sector by value accounted for almost two thirds of all defence exports. This is unsurprising given the fact that high value combat aircraft, transport aircraft, trainer aircraft and attack and transport helicopters reside in this domain. The Land sector accounted for almost a quarter of all defence exports globally. The sea sector is the lowest sector globally by value.
The UK is dependent (around 90%) on its aerospace sector, including platforms, equipment and support. As a leader in air sector technology and capability, it is exploiting its expertise. This strength is vital to securing the high value export opportunities in growth markets where securing air superiority is, and is likely to remain, a key priority for nearly all nations.
Chart 10: UK and global defence export market (based on orders/contracts signed) by sector 2019

Source: UK Defence & Security Exports
The aerospace sector by value in 2019 accounted for over half of all defence exports globally; it was 64% in 2018.
The lower bar highlights the continuing significance of aerospace to the UK, still the biggest sector by value, equating to 88% (96% in 2018) of total UK defence exports.
Chart 11: UK Security Exports 2016 to 2019 (£ million)
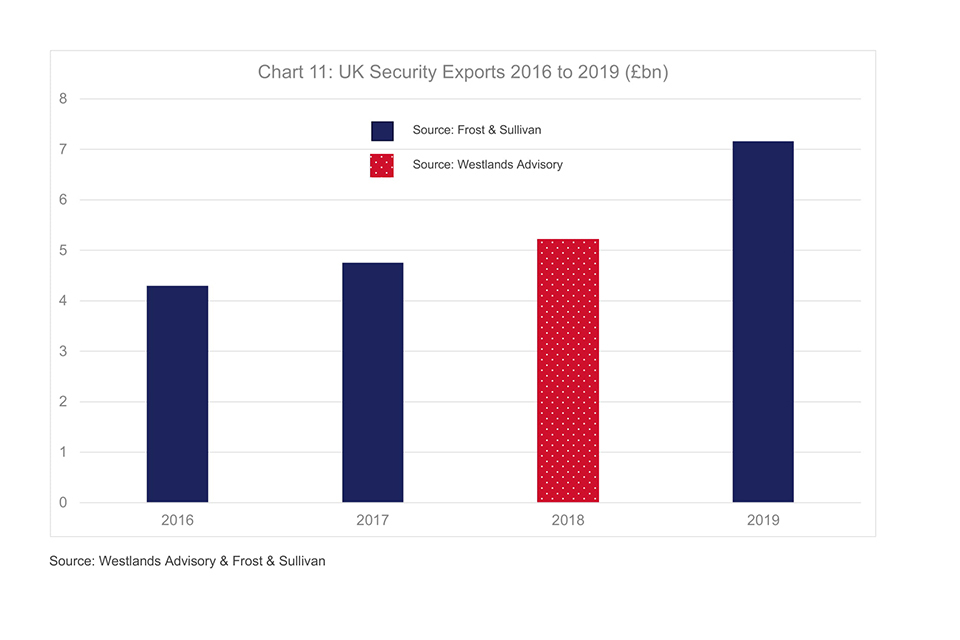
Information on UK security exports is provided by Frost & Sullivan (F&S) under a 3-year contract to supply UK Defence & Security with data for calendar years 2019, 2020 & 2021. The company’s methodology is provided in a separate document published on the gov.uk website with this release. F&S also provided the data for 2016 & 2017 with Westlands Advisory providing information for calendar year 2018.
According to F&S’s analysis, UK security companies achieved another increased set of export results in 2019.
UK Security exports in 2019 were £7.2 billion, up from £5.2 billion in 2018.
A substantial proportion of the increase in security exports in 2019 can be attributed to the new registration of UK subsidiaries of US companies (such as McAfee Security UK Ltd) and the channelling of a proportion of their global revenues through their UK accounts or the better reporting of the proportion of overall turnover that represented exports.
Chart 12: UK security export destinations by region (based on sales) for 2019
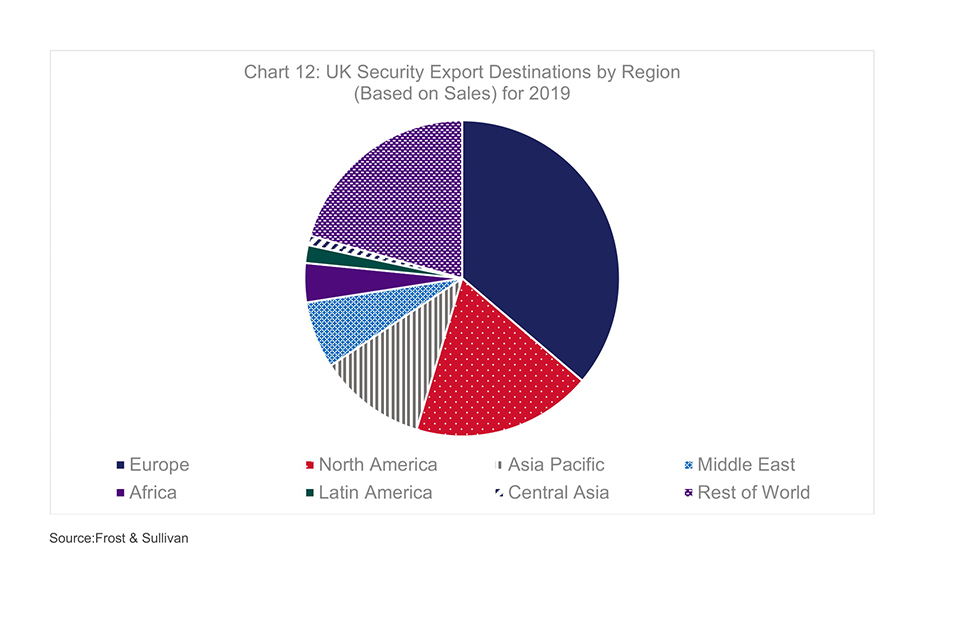
Source: Frost & Sullivan
Europe is the largest exports market (£2.59 billion) for the UK’s security industry. Despite North America taking the second spot, Asia Pacific (£0.82 billion) is a notable market to focus on.
Though the reported data leaves a significant amount of the market categorised under ‘Rest of World’ (RoW) (£1.48 billion), key exports markets for the UK Security industry outside of Europe are dominated by North America and Asia Pacific
Rest of the World refers to those contracts where we know they happened, but the company did not report their destination. As last year’s provider of data (Westlands Advisory) did not use ‘RoW’, comparisons with last year’s data cannot be made (such as Europe down from 49% to 36%).
Chart 13: UK security exports by technology segments 2019 (£ million)
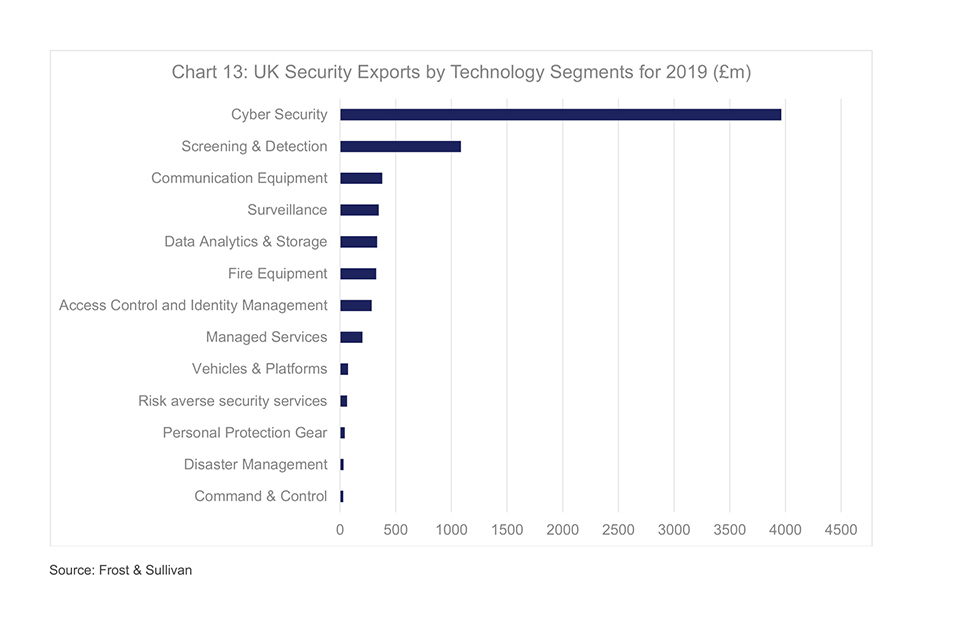
Source: Frost & Sullivan
The UK cyber security industry is reported to have gained 44% in number of companies from 2018 to 2019. The significant growth and dominant share of Cyber Security as a % of total UK security exports in 2019 (£3.96 billion), can be attributed to the new registration of UK subsidiaries of US companies (see note at Chart 14).
Screening and detection, a leading capability area for the UK, and surveillance make up the top 3.
Chart 14: UK cyber exports 2016 to 2019 (£ Billion)
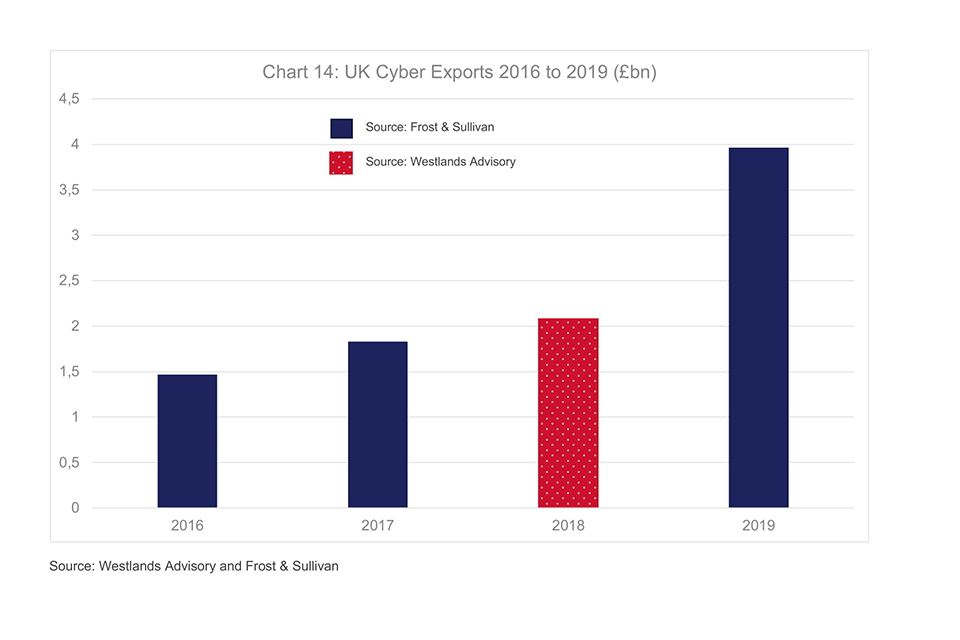
Cyber security remains the largest UK HMG Security sub-sector and has grown by 90% from 2018
It should be noted that part of the increase in cyber security exports can be attributed to the new registration of UK subsidiaries of US companies (such as McAfee Security UK Ltd) and the channelling of a proportion of their global revenues through their UK accounts or the better reporting of the proportion of overall turnover that represented exports.
Chart 15: UK cyber security exports by region 2019 (%)
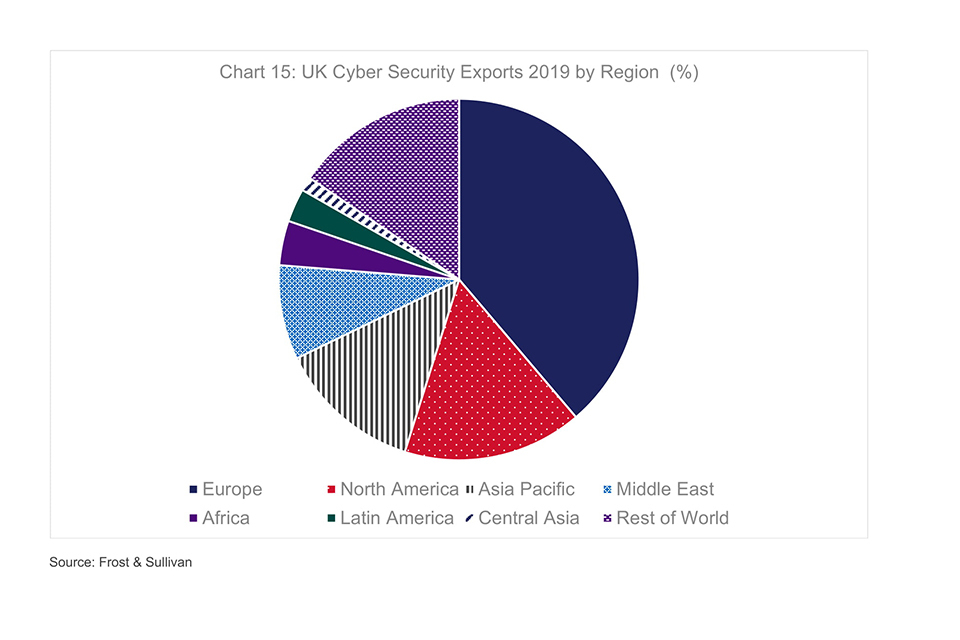
Source: Frost & Sullivan
An assessment of the export regions shows Europe with a substantial share of exports and is over double the next largest region. Europe will remain very important for cyber security exports in the future.
Whilst UK brands are strong in the USA, these are usually USA registered companies with operations in country and so do not count as export sales.
Chart 16: Global security exports by country 2019 ($ Billion)
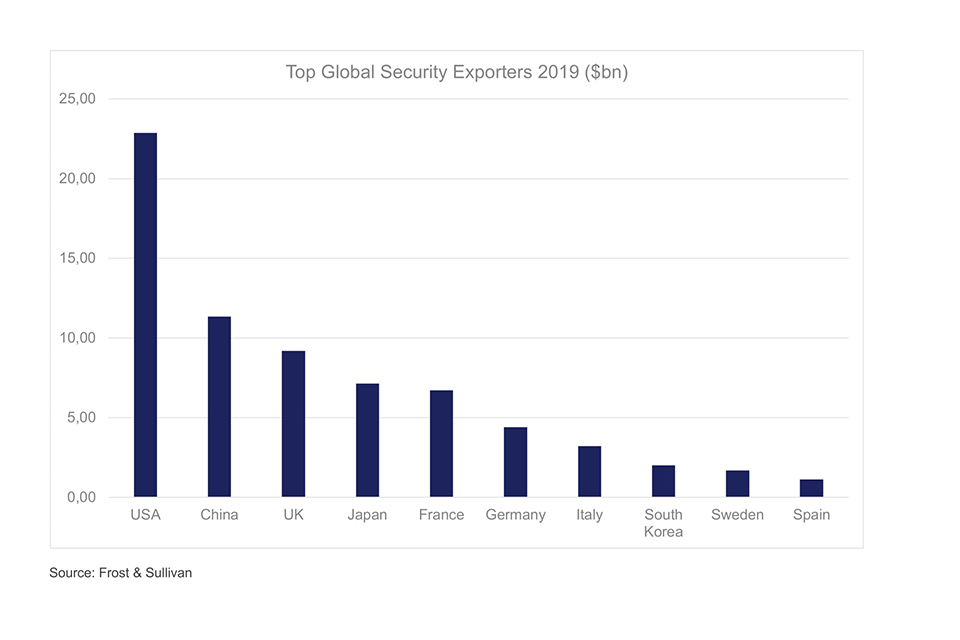
Source: Frost & Sullivan
In 2019, the top 10 exporting countries accounted for a third of the $213 billion global security market. While the 10 countries with the highest global security exports has remained unchanged since 2018, there has been some movement in the ranks. Since 2018, the UK has climbed from fourth to third place, with growth led by an increase in cyber security revenues across both domestic and export markets. Italy also performed strongly, climbing two ranks to the seventh biggest exporter in global security.
Notes
This UK Defence and Security Exports statistical release contains UK defence and security export performance data and analysis. UK defence figures are derived from a survey of UK defence companies to capture new orders data. Rest of the World figures are derived from open source reporting and capture competitor contracts signed. Security export data is based on sales. It is not advisable to combine the defence and security export figures as they are recorded via a different methodology and report on a different metric (orders/contracts vs sales).
Where ‘$’ values are expressed for rest of the world activity or global totals, these are presented in U.S. dollars for consistency. Figures quoted are actual prices, not adjusted for inflation.
All figures are subject to revisions due to definitional and methodological changes that will be notified to users via the gov.uk website.
Regular users of our data will be aware that KMatrix provided security export data to UK Defence & Security Exports (formerly as DSO) under a multi-year contract that expired in 2016. Frost & Sullivan was awarded a 2-year contract to supply security export data covering the 2016 and 2017 calendar years. More recently, Westlands Advisory was awarded the contract to provide the 2018 security export statistics and Frost & Sullivan has again provided figures for 2019.