The road not taken: drivers of course selection (HTML)
Published 30 March 2021

© Crown copyright 2021
This publication is licensed under the terms of the Open Government Licence v3.0 except where otherwise stated. To view this licence, visit nationalarchives.gov.uk/doc/open-government-licence/version/3 or write to the Information Policy Team, The National Archives, Kew, London TW9 4DU, or email: psi@nationalarchives.gov.uk.
Where we have identified any third party copyright information you will need to obtain permission from the copyright holders concerned.
This publication is available at https://www.gov.uk/government/publications/the-road-not-taken-drivers-of-course-selection/the-road-not-taken-drivers-of-course-selection-html
The road not taken: the drivers of course selection
The determinants and consequences of post-16 education choices
Research report
March 2021
Executive summary
It’s more important than ever to consider how students from all backgrounds can access high-quality academic and technical education, due to the severe disruption to their schooling and the level of economic shock experienced during the pandemic.
A crucial point to consider is what happens when young people reach the age of 16. This is when students make decisions about their education and choose what type of course to follow, as well as the level and subjects that they would like to study. These choices are pivotal as they can strongly influence their future educational opportunities, employment prospects and even how much they will go on to earn.
This report uses a mixed-methods approach to investigate the socio-economic differences in post-16 choices, factors driving these differences and the likely social mobility consequences of picking the most popular options. We have achieved this by using administrative data linking the education and earnings of young people who took post-16 qualifications in the mid-2000s.
In addition, to better understand the key behaviours driving the choices, we undertook in-depth interviews with senior leaders, curriculum managers, teachers and learners from 5 learning providers. This has been supplemented by a review of relevant literature and survey evidence.
Definitions and data
Academic qualifications/routes: For this report, we have focused exclusively on A levels.
Technical qualifications/routes: We have focused on vocational or specialised applied learning such as BTECs and apprenticeships (a very broad range of qualifications).
High-/low-earning courses: We grouped academic and technical routes by subject and level and ranked them by average earnings among young people who took that pathway. This allows us to see which courses are in the top 50% and 25% of earnings amongst students, and how this varies by socio-economic background. For brevity’s sake, we often refer to “x% of courses” to mean “x% of students on courses.”
Socio-economic disadvantage: We created an index of socio-economic disadvantage by combining individual measures of disadvantage and other area-based indicators.
Time frame: We focused on young people who took their post-16 qualifications between 2002 and 2007. This allowed us to follow them into the labour market and observe their earnings as they started their prime earning phase in their late 20s. We also examined socio-economic differences among more recent cohorts. The patterns are very similar.
Key findings
The highest earning routes are A levels or a combination of A levels and technical courses
Academic courses are associated with the highest earnings. 80% of A level courses are ranked in the top 25% of earnings. This partly reflects the fact that academic courses often facilitate access to higher education.
Courses combining academic and technical qualifications are relatively high-earning too, with 70% of students ending up in jobs ranked in the top 50% of earnings.
Technical qualifications are mostly associated with low earnings. 62% of classroom-based technical qualifications and 40% of apprenticeships are in the bottom 25% of earnings.
The small number of high-earning technical routes are mostly taken by men
The technical qualifications with highest earnings potential are Level 3, particularly Level 3 apprenticeships.
Men are more likely to take courses in higher-earning subject areas, such as engineering, construction and planning. Women are more likely to study subjects associated with low earnings, such as retail, commerce, health, care and public services.
Young people from disadvantaged backgrounds are more likely to choose low-earning courses (particularly women)
The most privileged men are 28 percentage points more likely to take a course in the top 25% of earnings than men in the most deprived group; the equivalent gap for women is 31 percentage points.
Men and women with ‘just above average’ levels of deprivation are 20–25 percentage points less likely to take a course in the top 25% of earnings than the most affluent group.
About 50% of disadvantaged women take low-earning courses ranked in the bottom 25% of earnings, which compares with about 31% of disadvantaged men.
Women are 10 percentage points more likely than men to choose the courses in technical education that pay the least well.
Some disadvantaged groups are more likely to choose low earning courses
Prior attainment mostly explains why young people choose the highest-earning courses. However some groups are more likely to choose the lowest paying routes, regardless of their achievements.
High achieving disadvantaged students are less likely to choose the higher-earning academic routes than students from privileged backgrounds.
Disadvantaged women with middle and low levels of prior attainment are more likely to choose low-earning technical courses than women from privileged backgrounds.
Course choices explain more of the earnings inequalities for women than for men
Disadvantage has persistent effects on early-career earnings, even after controlling for prior attainment. Men’s choice of subject or course does not make this any worse. However, there is a further ‘earnings penalty’ for disadvantaged women of around 4 to 5 percentage points linked to their subject and course choices.
Those choosing low-earning courses including disadvantaged Black Caribbean students and disadvantaged White British women
Only 27% of women and 22% of men from disadvantaged Black Caribbean backgrounds took courses in the top 50% of earnings.
Only 24% women and 33% men from disadvantaged White British backgrounds took courses in the top 50% of earnings.
There are significant gaps in the provision of careers guidance
Only 3 in 5 young people report receiving any career guidance before the age of 16. Learners and providers also feel that much less information is provided about technical routes than academic routes. This is despite the implementation in 2018 of the ‘Baker Clause’, which stipulates that all schools must allow colleges and training providers access to all pupils in years 8–13 to discuss non-academic routes.
Young people taking higher-level courses are usually better informed about education pathways and other opportunities open to them.
Disadvantaged young people are more likely to be disappointed by their choices
Interest and enjoyment are important motivations for many students choosing courses. Higher-achieving learners are typically more able to pick a course they enjoy. Low-achieving learners frequently find some choice replaced by mandatory, corrective content so they enjoy less freedom.
Aspirations are generally high. However young people from disadvantaged backgrounds are more likely to experience disappointment because of low attainment at the end of their course. As a result, they are more likely to find themselves on low-earning routes that they hadn’t intended to take.
Gender norms remain pervasive
There are strong gender disparities in subjects such as engineering, IT, beauty and childcare. Teachers say that this replicates the gender bias present in the various industries. They also note that course choice can be strongly influenced by a student’s role models.
Geography and the availability of courses play an important role
The cost of travel and how long it takes to get somewhere can influence a learner’s choice of provider and course. This is particularly the case for apprentices who need to travel to both their place of study and work.
Disadvantaged students are more likely to take higher level courses (for example, Level 3 courses) in areas such as London where there is a wide availability of school sixth forms. They are much less likely to take these higher-earning courses in places such as the north-west and north-east of England, where there is the lowest availability of school sixth forms.
Policy implications
Focus on educational inequalities up to 16 and target specific disadvantaged groups
Prior educational attainment has a large impact on choices, so it’s important to reduce inequalities before children reach 16. Educational progress is likely to be more restricted for students whose attainment was poor throughout school.
Specific groups are being penalised by their choices and could benefit from extra careers guidance and support. Beneficiaries could include disadvantaged women with low or average prior attainment; disadvantaged Black Caribbeans; and disadvantaged White British women.
Better guidance is needed on technical routes before the age of 16, particularly for disadvantaged pupils
Welcome steps are being made to improve careers guidance. There has been widespread implementation of the Gatsby principles which are a series of benchmarks created by the Gatsby Charitable Foundation and adopted as part of the government’s career strategy for schools and colleges. Local careers hubs have also been established.
The white paper, ‘Skills for jobs: lifelong learning for opportunity and growth’, proposes toughening the so-called ‘Baker Clause’ which should improve students’ knowledge of non- academic routes. The white paper, published in January 2021, also proposes presenting more data on the returns for different qualifications.
The challenges faced by disadvantaged pupils still need to be addressed. It is crucial that the government provides the necessary targeted resources to support them.
Interventions need to be trialled to target the key drivers of behaviour
It would be valuable to explore the impact of gender norms and role models. Trials could also explore parental influences and the benefits of work experience for technical occupations.
Look at how to promote progression, and combine academic and technical courses
The recent white paper focuses on the potential strengths of new T levels (2 year courses which are equivalent to 3 A levels). These courses have been developed in collaboration with employers and businesses and combine classroom learning with ‘on-the-job’ experience. They should enable more young people to gain Level 4 and 5 technical qualifications. Research shows that students combining technical and academic qualifications have relatively high earnings as the skills gained are valued in the labour market. Another benefit is that students can switch between routes as they establish what suits them best.
It’s very positive that more young people will be able to progress to Level 4 and 5. However, promoting social mobility will also require supporting students from Level 2 to Level 3, so that they can then move on to the higher technical qualifications. Targeted support and flexible provisions for disadvantaged young people is crucial to avoid future educational inequalities opening up at Levels 4 and 5.
16-year-olds with low attainment often require compulsory learning to fix knowledge gaps in core maths, English and IT. Corrective learning should be contextualised with vocational subjects to provide interest.
Help with travel and easy availability of higher-level courses can encourage take-up
Disadvantaged students who are mid-attaining are more likely to take Level 3 qualifications if they can study at a local school sixth form.
Disadvantaged pupils can be discouraged from taking certain courses or apprenticeships if it’s expensive for them to get there. Help with travel costs can remove this barrier.
1. Introduction
It’s more important than ever to consider how students from all backgrounds can access high-quality academic and technical education, due to the severe disruption to their schooling and the level of economic shock experienced during the pandemic.
At the age of 16, young people make critical decisions about their education. They can choose between academic routes, technical courses, a blended approach or an apprenticeship. They can select what level of course to take, including Level 3 (A level equivalent) and Level 2 (GCSE equivalent) or below. They can choose whether to study in school sixth forms, sixth form colleges, further education colleges or with other providers. They must also decide what to study. Often these choices are bundled together, with sixth forms more likely to offer A levels and further education colleges more likely to offer technical courses.
The choices that students make are influenced by what’s on offer in their area and heavily shaped by their prior educational attainment, with A levels or Level 3 courses only available to them if they’ve got good GCSE results.
The path they take could determine the educational opportunities available to them at the end of the course, their employment prospects and even their future earnings. The choices also have the potential to impact on social mobility.
Existing evidence shows that young people from disadvantaged backgrounds are more likely to study at further education colleges and choose lower-level courses.[footnote 1] Clear evidence has also emerged of differences in earnings that are linked to the subject taken at higher education level, as well as vocational courses and apprenticeships.[footnote 2]
There is burgeoning evidence that young people from poorer families often ‘under-match’ on university choices (do not apply for competitive universities that they are academically qualified for). Important explanations given for this phenomenon include the effects of local availability and school or neighbourhood contexts.[footnote 3]
This report investigates the drivers of socio-economic differences in post-16 course choices and their likely social mobility consequences. We do this through a mixed-methods approach. This combines new quantitative analysis of linked education-employment administrative data; qualitative analysis; case studies based on in-depth discussions with providers and learners; and a review of relevant literature, survey data and policy options.
In section 2, we start by using linked data to analyse the courses associated with the highest levels of earnings in the labour market. This includes the broad route (academic, technical, apprenticeship or a combination), level of study and subject(s) studied. This provides a typology of whether courses are high- or low-earning, with courses split into one of 4 earnings groups.
In section 3, we detail the socio-economic differences in young people’s likelihood of taking high- and low-earning courses. We focus mostly on technical and apprenticeship courses, given that young people from disadvantaged backgrounds are more likely to take these courses. We analyse how much of these socio-economic differences can be explained by prior attainment and pupil characteristics and how much can be explained through post-16 choices. We also detail the likely social mobility implications of post-16 choices by examining differences in early- career earnings (when individuals are aged 25–30).
In section 4, we examine the behavioural factors driving post-16 choices. This includes differences in capabilities, such as prior attainment and knowledge; geographical availability of different courses, information and careers guidance; and aspirations and motivations. The analysis draws on detailed interviews and testimony from a range of learners and providers.
In the final section, we discuss the policy implications of this report’s findings. This includes examining the best ways to tackle inequalities, including assessing the design of the educational system and careers guidance for young people, as well as reflections on the recent white paper on further education and skills.[footnote 4]
Throughout the report, we also draw on a literature review of the factors shaping aspirations and motivations to take technical courses, which is published as a separate annex.
2. Methodology: defining high- and low-earning courses
To investigate the social mobility implications of course choices, we have analysed new administrative data linking the education and earnings records of young people over time. This enables us to assess the socio-economic differences, the factors driving these differences and their implications for earnings in the labour market.
In this section, we outline the data and explain how we use it to address our research questions. We focus on our methods for categorising the education options into 4 groups based on their earnings potential.
Key findings
Academic course routes are associated with the highest earnings; 80% of A level-focused course routes are in the top 25% of earnings.
Course routes combining academic and technical qualifications are relatively high-earning too, with 70% in the top 50% of earnings.
Technical qualifications are mostly associated with low earnings, with 62% of classroom- based technical qualifications and 40% of apprenticeships in the bottom 25% of earnings.
The small number of technical qualifications with higher earnings potential are at Level 3, particularly Level 3 apprenticeships.
Women from low socio-economic backgrounds are much more likely to take technical subjects associated with low earnings, such as retail, commerce, health, care and public services. Men are much more likely to take higher-earning subjects, such as engineering, construction and planning.
Data and sample selection
We use data on the choices and earnings of individuals who completed their GCSEs in England between 2001/02 and 2004/05. We necessarily focus on these older cohorts so that we can track their actual earnings up to age 30. To ensure that this analysis is still relevant today, we also show what the socio-economic differences in post-16 course choices would look like for more recent cohorts, if the earnings potential of different courses were unchanged over time.
This sample includes about 2.5 million young people over 4 years; or about 600,000 to 650,000 per year (see Appendix Table A1 for full details).
Education and earnings information
We use the Longitudinal Education Outcomes (LEO) dataset, which provides us with information on background characteristics,[footnote 5] post-16 education choices and labour market earnings of individuals. This dataset links 3 sources of data:
-
The National Pupil Database (NPD), which contains information on pupil characteristics (such as eligibility for free school meals and ethnicity) and on school achievement from Key Stage 1 (KS1) through to Key Stage 4 (KS4) and Key Stage 5 (KS5) where applicable
-
Individualised Learner Record (ILR) data collected by publicly funded colleges, training organisations, local authorities and other further education (FE) providers, which includes technical education records
-
Her Majesty’s Revenue and Customs (HMRC) earnings data between 2010/11 and 2016/17, which provides a measure of annual employment earnings (from PAYE records) for ages 25 to 30;[footnote 6] earnings data is missing for individuals who are not in employment, and we do not observe hours worked in the data
The sample used in analysis
In our analysis, we focus on students who continued into post-16 education after completing their GCSEs. An individual must have either KS5 NPD records and/or ILR data as well as earnings data to be included in our analysis sample. The final sample is about 70% of the original GCSE cohort (see Appendix Table A2 for further details).[footnote 7]
Categorising post-16 course choices
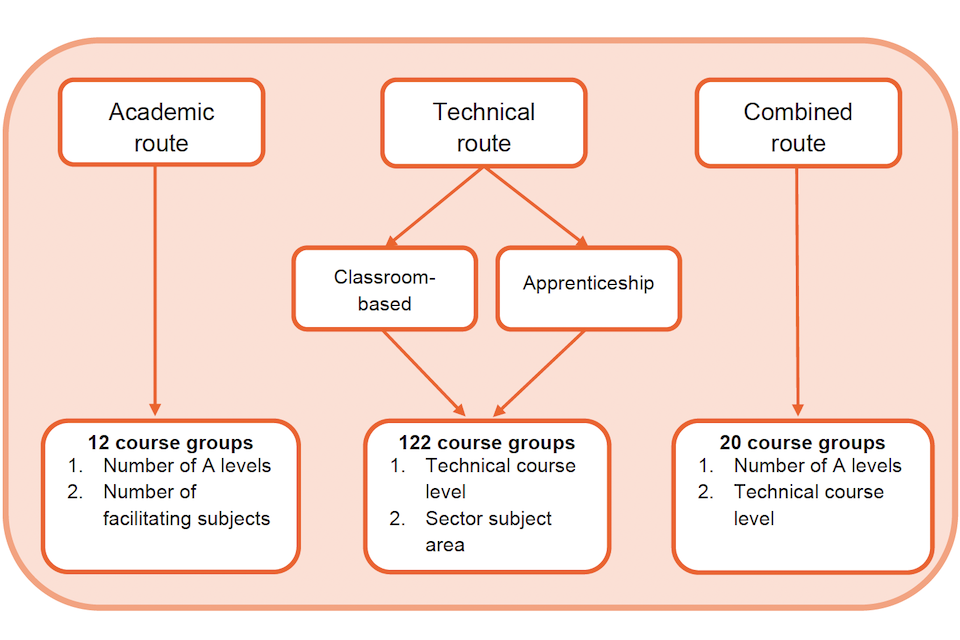
At age 16, young people can make countless educational choices. They can study academic or technical qualifications in a range of subjects and at various levels. To effectively analyse these choices, we have classified all possible post-16 educational choices into a finite number of course groups using the following set of criteria (Figure 2.1 illustrates the course groups we define):
First, we classify each individual’s post-16 educational choices into one of 3 routes:
- academic route: A levels
- technical route: classroom-based technical qualifications or an apprenticeship
- combined route: a combination of academic and technical qualifications
We further classify each of these 3 routes based on the following rules.
For the academic route, we define 12 distinct course groups using a combination of the number of A levels studied and the number of these A levels that are in facilitating subjects:[footnote 8]
- we group the number of A levels into 1, 2, 3, and 4 or more
- the number of facilitating subjects is sorted into 0, 1, and 2 or more
For the technical route, we separate apprenticeships and classroom-based courses and then create 61 course groups for each of these routes based on the course level and subject area studied:
- we group each course into Level 0, Level 1, Level 2, Level 3, and Level 4 and above
- we classify each course above Level 0 into one of 15 Ofqual-defined subject areas[footnote 9]
For the combined route, we define 20 course groups by the number of A levels and the highest level of technical course studied:
- we group the number of A levels into 1, 2, 3, and 4 or more
- we group each technical course into Level 0, Level 1, Level 2, Level 3, and Level 4 and above
In Figure 2.1 we illustrate this categorisation of post-16 choices into course groups. We provide a full list of the course groups and the number of individuals in each group in Appendix Table A3.
We focus on courses taken up to Level 3 to focus attention on options generally taken by young people between ages 16 and 18. However, the earnings associated with each of these course choices will clearly also be determined by the extent to which they allow young people to progress to different types and higher levels of qualifications.
A potential issue with these criteria is which course to focus on for individuals who study multiple technical courses. In such instances, we focus on the highest-level technical course that the individual begins between the ages of 16 and 20. Furthermore, for individuals who have taken multiple courses at their highest level, we give precedence to apprenticeships over classroom-based courses, and then to the first course started after the individual turned 16.
Figure 2.1: Post-16 education course groups
Categorising course groups by earnings
The criteria, set out above, classify each potential set of post-16 choices into one of 154 course groups. However, it is necessary to further categorise these groups to make our analysis tractable.
We categorised each of the post-16 education course groups illustrated in Figure 2.1 based on their earnings potential. Specifically, we calculated average earnings between the ages of 25 and 30 for individuals in each course group and then categorised course groups with similar earnings potential. In total, we defined 4 earnings categories.
In Table 2.1 we show the interquartile range of the earnings associated with each of the 4 earnings groups. We set the earnings thresholds so that each group contains roughly 25% of the individuals in our sample.
Table 2.1 shows that there are large differences between our defined earnings groups. While individuals who select a course in the low earnings groups have annual average earnings of
£11,200 between the ages of 25 and 30, those who take a course in the high-earnings groups have annual average earnings of £25,500.
The earnings categories are defined with men and women considered together. This allows us to examine gender differences in the likelihood of young people taking post-16 courses associated with high and low earnings.
Table 2.1: Interquartile range of average annual earnings between the ages of 25 and 30 for each earnings group
| Earnings group | 25th percentile | Median | 75th percentile |
|---|---|---|---|
| Low | £10,100 | £11,200 | £12,100 |
| Middle-lower | £15,000 | £16,700 | £17,300 |
| Middle-upper | £19,200 | £21,100 | £21,600 |
| High | £23,800 | £25,500 | £26,600 |
Notes and sources: Authors’ calculations using linked data from NPD, ILR and HMRC earnings data. Sample of young people taking GCSEs between 2002 and 2005. Figures are rounded to the nearest hundred.
Low and high-earnings course groups
There is a great deal of variation in the earnings associated with different educational routes. In Figure 2.2 we show the share of learners in each earnings group from the main post-16 educational routes.
First, the left-most bar in Figure 2.2 shows that individuals are roughly evenly spread across the 4 earnings groups. The share is not exactly 25% across groups as some course groups can be quite large. As one might expect, there is not an even share of individuals in each earnings group across the different routes. Students in the A level and combined routes are far more likely to be in higher earnings groups. Almost 80% of students on the A level route are in the highest earnings group, and nearly 100% of individuals on this route are in the top 2 (high and middle-upper) earnings groups. The high earnings associated with A level routes will partly reflect the fact that academic courses facilitate access to higher education.
Almost 70% of students taking courses in the combined route are in these top 2 earnings groups. In contrast, the majority of individuals who have taken technical qualifications (either classroom-based or apprenticeships) are in the 2 lowest earnings groups (middle-lower and low). Almost 62% of students on the classroom-based route and 40% of apprentices are in the bottom earnings group.
Figure 2.2: Percentage of learners taking post-16 courses in each earnings group by education route
| Earnings group | All learners | Academic | Technical classroom | Apprenticeship | Combined |
|---|---|---|---|---|---|
| High | 26% | 79% | - | 14% | 24% |
| Middle upper | 23% | 20% | - | 12% | 46% |
| Middle lower | 27% | - | 35% | 33% | 30% |
| Low | 24% | - | 62% | 40% | - |
Notes and sources: Authors’ calculations using linked data from NPD, ILR and HMRC earnings data. Sample of young people taking GCSEs between 2002 and 2005. All cell sizes are greater than 1,000.
While technical routes are on average associated with lower earnings, there are certain technical courses that do lead to high earnings. In Figure 2.3, we divide technical routes by their level and show the share of students in each earnings group.
Figure 2.3 shows that higher-level technical students are more likely to be in higher earnings groups. While all classroom-based students at Level 2 and below are in the bottom 2 earnings groups, 9% of students taking classroom-based courses at Level 3 and above are in the top 2 earnings groups. Furthermore, while only 17% of apprentices at Level 2 and below are in the top 2 earnings groups, 43% of apprentices at Level 3 and above are in the highest earnings group.
Figure 2.3: Learners taking technical post-16 courses in each earnings group
| Earnings group | Level 2 and below classroom | Level 3 and above classroom | Level 2 and below apprentice | Level 3 and above apprentice |
|---|---|---|---|---|
| High | - | - | - | 43% |
| Middle upper | - | 8% | 17% | 3% |
| Middle lower | 33% | 38% | 36% | 27% |
| Low | 67% | 53% | 47% | 27% |
Notes and sources: Authors’ calculations using linked data from NPD, ILR and HMRC earnings data. Sample of young people taking GCSEs between 2002 and 2005. All cell sizes are greater than 1,000.
There are also significant gender differences in the numbers of students taking different technical courses, with men far more likely to take technical courses associated with high earnings. This is demonstrated in Figures 2.4 and 2.5, which provide a breakdown of the number of men and women studying technical courses by subject area.
Figure 2.4 tells us that women tend to take low-earnings classroom-based courses in subject areas such as retail and commercial enterprise, health, public services and care. Men take the few classroom-based technical courses that are relatively high-earning, such as engineering and manufacturing; and construction and planning (at Level 3 and above).
Figure 2.5 demonstrates that women are also much more likely to undertake low-earning apprenticeships in subject areas such as retail and commercial enterprise, as well as health, public services and care. The high-earnings apprenticeships – especially in engineering and manufacturing – are overwhelmingly taken by men.
This chimes with other recent evidence showing that girls are much less likely to take post-16 courses in science, technology, engineering and mathematics (STEM) subjects.[footnote 10]
Figure 2.4: Classroom-based learners studying each subject area by gender
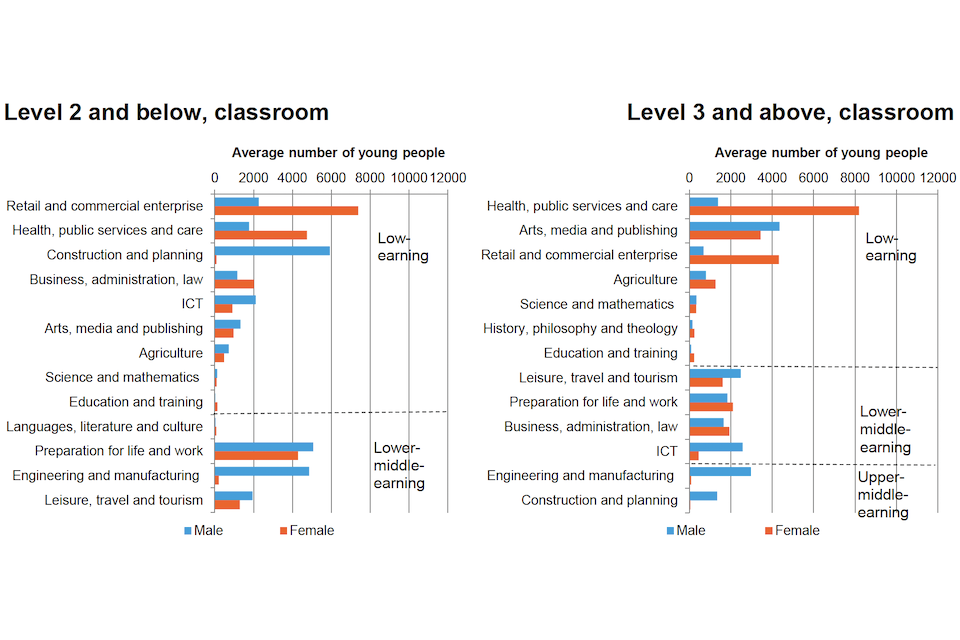
Figure 2.5: Apprentice learners studying each subject area by gender
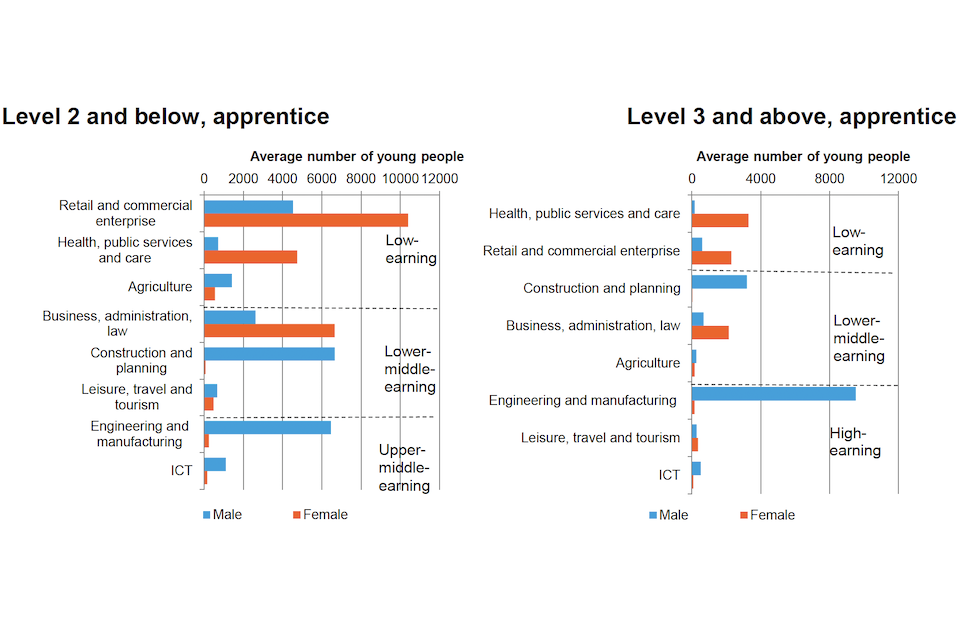
Notes and sources: Authors’ calculations using linked data from NPD, ILR and HMRC earnings data. Sample of young people taking GCSEs between 2002 and 2005. All cell sizes are greater than 50, with figures showing the average number of students across years. Three subject groupings were removed from Figure 2.5 due to low sample sizes, to prevent secondary disclosure.
3. Socio-economic differences in course choices
In this section, we look at which post-16 choices are socially graded and the role they may play in shaping social mobility. We use an index of socio-economic background, which combines individual eligibility for free school meals and area-level characteristics (see box below).
Key findings
The most privileged men are 28 percentage points more likely to take a course in the top 25% of earnings than men in the most deprived group; the socio-economic gap is 31 percentage points for women.
Students with ‘just above average’ levels of deprivation are 20–25 percentage points less likely to take a course in the top 25% of earnings.
About 50% of disadvantaged women take low-earning courses in the bottom 25% of earnings, which compares with about 31% of men from similarly disadvantaged backgrounds.
Among those taking technical qualifications, women are 10 percentage points more likely to take courses in the lowest earnings group.
While prior attainment is the most likely predictor for taking higher-earning courses, some specific groups are less likely to take them, even if they are high achieving:
- disadvantaged students, with high levels of prior attainment, are less likely to take higher-earning academic routes
- disadvantaged women, with low/middle levels of prior attainment, are more likely to take low-earning technical courses
Disadvantage has persistent effects on early-career earnings, even after controlling for detailed measures of prior attainment. Very little of these inequalities can be explained by subject or course choices for men. However, about 4 to 5 percentage points of the earnings penalty for disadvantaged women reflects their post-16 subject and course choices.
Only 27% of women and 22% of men from disadvantaged Black Caribbean backgrounds took higher-earning courses in the top 50% of earnings.
Disadvantaged White British women are much less likely to take higher-earning courses than men from the same background (24% vs 33%).
Disadvantaged women in London are over 10 percentage points more likely to take high- earning courses than disadvantaged women in all other regions of England. Disadvantaged women in the north-east and north-west are the least likely to take high-earning courses. The same patterns hold for men, but the differences are much less pronounced.
These regional disparities are likely to be linked to the differing availability of courses and institutions, with school sixth forms much more common in London.
Measuring socio-economic status
A central component of our analysis is investigating socio-economic differences in education and earnings, which requires us to have a measure of socio-economic status. We have calculated a measure of each individual’s socio-economic background during their time in secondary school using information on a range of individual- and local-area-level measures of deprivation:
- eligibility for free school meals during their time at school
- the Income Deprivation Affecting Children Index (IDACI)[footnote 11] score in the local area
- local measures of housing tenure – the share of people that own their homes
- local measures of adult education levels – the share of adults with no qualifications
- the occupational share of adults in the local area
We have performed a principal-components analysis using information on these variables, which produces a socio-economic score for each person. In later analysis we assign individuals into 5 groups from the most-deprived quintile to the least-deprived quintile based on their socio-economic score. We are unable to calculate socio-economic scores for individuals who attended an independent school; instead we include independent school students in our analysis as a separate socio-economic group. This group attending independent schools is likely to be more advantaged and privileged than the most-advantaged quintile attending state-funded schools.
Overall socio-economic differences
Men and women from advantaged socio-economic backgrounds are more likely to take high- earning courses than those from disadvantaged backgrounds. About 38% of men and women from the most advantaged backgrounds (quintile 1) took high-earning (top 25%) courses. This compares with 10% of men from the most disadvantaged backgrounds (quintile 5) and just 7% of disadvantaged women. This creates a socio-economic gap of 28 percentage points for men in the likelihood of taking a high-earning course, and an even larger gap of 31 percentage points for women.
It is also clear that socio-economic differences extend well beyond the most disadvantaged group. For example, men and women in the most advantaged group are still more than twice as likely to take high-earning courses than the second most disadvantaged group, those with just above average levels of deprivation.
If we look at the top 50% earning courses (high and upper-middle combined), there is a socio- economic gap of 47 percentage points for women and a 37 percentage points gap for men.
The gender and socio-economic divides become even starker if we look at the share of men and women taking low-earning courses (bottom 25%). Women are much more likely to take low-earning courses than men if they’re from disadvantaged backgrounds (50% vs 31%). There is also a gradual effect of socio-economic background. Men and women from average socio-economic backgrounds are more likely to take low-earning courses than those from the most advantaged group, as are those with below-average socio-economic background scores.
In contrast, men and women from independent schools are much more likely to take high- earning courses. About two-thirds of men and women from independent schools take high- earning courses, which is about 30 percentage points greater than the proportion of men and women from the most advantaged backgrounds in state-funded schools (quintile 1). This results from a greater focus on A levels and other academic qualifications in independent schools.
Figure 3.1: Percentage of learners taking post-16 courses in each earnings group by socio-economic status (private school + quintiles)
Men:
| Earnings group | Private school | Quintile 1 | Quintile 2 | Quintile 3 | Quintile 4 | Quintile 5 |
|---|---|---|---|---|---|---|
| High | 68% | 38% | 29% | 23% | 17% | 10% |
| Middle upper | 20% | 28% | 26% | 25% | 22% | 19% |
| Middle lower | 9% | 23% | 30% | 34% | 38% | 40% |
| Low | 4% | 10% | 14% | 18% | 24% | 31% |
Women:
| Earnings group | Private school | Quintile 1 | Quintile 2 | Quintile 3 | Quintile 4 | Quintile 5 |
|---|---|---|---|---|---|---|
| High | 67% | 39% | 28% | 21% | 14% | 7% |
| Middle upper | 22% | 29% | 27% | 24% | 20% | 15% |
| Middle lower | 6% | 16% | 21% | 25% | 27% | 27% |
| Low | 5% | 16% | 24% | 31% | 39% | 50% |
Notes and sources: Authors’ calculations using linked data from NPD, ILR and HMRC earnings data. Sample of young people taking GCSEs between 2002 and 2005. All cell sizes are greater than 1,000.
Socio-economic differences within technical routes
Figure 3.2 shows the share of men and women taking technical qualifications in the different earnings groups by socio-economic background. A much greater share of technical courses are in lower earnings groups: over 80% of learners on technical routes are taking low- or middle-to low-earning courses.
There are, however, still socio-economic and gender differences. About 58% of the most disadvantaged men (quintile 5) taking technical courses are on low-earning courses – that’s about 13 percentage points more than the most advantaged men doing so. Among women, 67% of the most disadvantaged women on technical routes are taking low-earning courses, which is 9 percentage points more than among women in quintile 1. There is also a gradual effect of socio- economic disadvantage increasing the likelihood of taking low-earning technical courses. Across all groups, women on technical routes are about 10 percentage points more likely to take low-earning courses than men (see Figure 3.2).
Higher-earning technical courses tend to be Level 3 classroom courses and apprenticeships, particularly those in the areas of construction and engineering. Given that these areas are male- dominated, it is not surprising to see such larger gender divides. Women are much more likely to take technical courses in care, public service and retail, which tend to be low-earning.
Figure 3.2: Percentage of learners taking technical post-16 courses in each earnings group by socio-economic status (private school + quintiles)
Men:
| Earnings group | Private school | Quintile 1 | Quintile 2 | Quintile 3 | Quintile 4 | Quintile 5 |
|---|---|---|---|---|---|---|
| High | 4% | 9% | 9% | 8% | 6% | 4% |
| Middle upper | 6% | 7% | 8% | 8% | 7% | 7% |
| Middle lower | 41% | 39% | 37% | 36% | 34% | 32% |
| Low | 49% | 45% | 46% | 48% | 52% | 58% |
Women:
| Earnings group | Private school | Quintile 1 | Quintile 2 | Quintile 3 | Quintile 4 | Quintile 5 |
|---|---|---|---|---|---|---|
| High | - | - | - | - | - | - |
| Middle upper | 3% | 4% | 4% | 3% | 3% | 2% |
| Middle lower | 41% | 38% | 36% | 35% | 33% | 30% |
| Low | 55% | 58% | 60% | 61% | 64% | 67% |
Notes and sources: Authors’ calculations using linked data from NPD, ILR and HMRC earnings data. Sample of young people taking GCSEs between 2002 and 2005. All cell sizes are greater than 50.
Differences for more recent cohorts
The main analysis focuses on individuals who took their GCSEs and made their post-16 choices during the mid-2000s, so that we can track their earnings up to the age of 30. As a check on the relevance of this, we also looked at a more recent cohort (students taking GCSEs between 2009 and 2012, versus 2002 to 2005 for our main cohort).
Generally speaking, the socio-economic differences in post-16 choices are extremely similar for both cohorts. This assumes that courses that are high- and low-earning have remained similar over time.
Figure 3.3 shows that the share of men and women in each quintile taking higher-earning courses fell by about one to 3 percentage points in independent schools and across quintiles 1–4. There is a slight rise of one percentage point in quintile 5 (for women).
Appendix Figure A1 shows the full splits by each earnings group for the most recent cohorts.
Figure 3.3: Percentage of students taking post-16 courses in the top 50% of earnings groups by socio-economic status (private school + quintiles)
| Earnings group | Private school | Quintile 1 | Quintile 2 | Quintile 3 | Quintile 4 | Quintile 5 |
|---|---|---|---|---|---|---|
| Men (2002 to 2004) | 87% | 67% | 55% | 48% | 39% | 29% |
| Men (2009 to 2012) | 85% | 65% | 53% | 45% | 37% | 29% |
| Women (2002 to 2004) | 88% | 68% | 55% | 45% | 34% | 22% |
| Women (2009 to 2012) | 86% | 66% | 52% | 43% | 33% | 23% |
Notes and sources: Authors’ calculations using linked data from NPD, ILR and HMRC earnings data. Sample of young people taking GCSEs between 2002 and 2005, and from 2009 to 2012. All cell sizes are greater than 1,000.
Explanations for socio-economic differences
As Figure 3.3 shows, the likelihood of someone taking a post-16 course associated with high future earnings depends on which socio-economic group they are in. The higher the socio- economic group, the greater the chance of high earnings. This is partly because students from well-off backgrounds are more likely to choose A levels, which are more strongly linked with well paid careers. There is a huge disparity between groups and these differences are most pronounced for women.
The effects are smaller, but still notable, among those taking technical qualifications. There is also a larger gender split, with women 10 percentage points more likely to take courses in the lowest earnings group.
After controlling for prior attainment and pupil characteristics,[footnote 12] the likelihood of taking a course in the top 50% for earnings varies by 7 percentage points for men and 12 percentage points for women (comparing the most disadvantaged group with the most advantaged group). Similar results can be seen for the likelihood of taking courses in the top 25% for earnings (see Appendix Figure A2 for further details). In both cases, prior attainment can explain about 70% to 80% of the socio-economic gap (Appendix Figure A3).
Individuals from disadvantaged backgrounds are more likely to take courses associated with lower earnings even after accounting for lower prior attainment. This is particularly the case for women. The chances of them choosing a course in the top 50% vary by 12 percentage points across quintiles (compared with a 7 percentage points for men).
Figure 3.4: Socio-economic differences in the propensity to take high-earning courses (top 50%) before and after controls
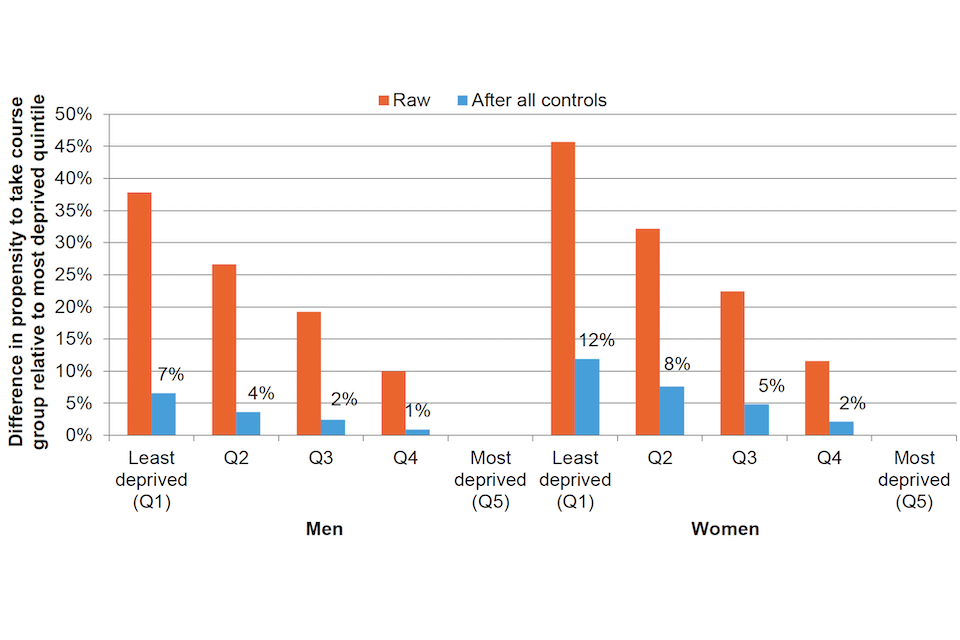
Notes and sources: Authors’ calculations using linked data from NPD, ILR and HMRC earnings data. Sample of young people taking GCSEs between 2002 and 2005.
Figure 3.5 shows that an individual’s broad choice of route is most likely to determine the later financial outcome (academic or combined as opposed to technical or apprenticeship). There is a socio-economic gap of 8 to 9 percentage points with the combined route.
Figure 3.5: Socio-economic gap in the propensity to take post-16 courses in the top 50% of earnings (shown separately for men and women)
The socio-economic gap is defined as the difference in percentage points between the most and least deprived groups. The figures below are shown before and after controls.
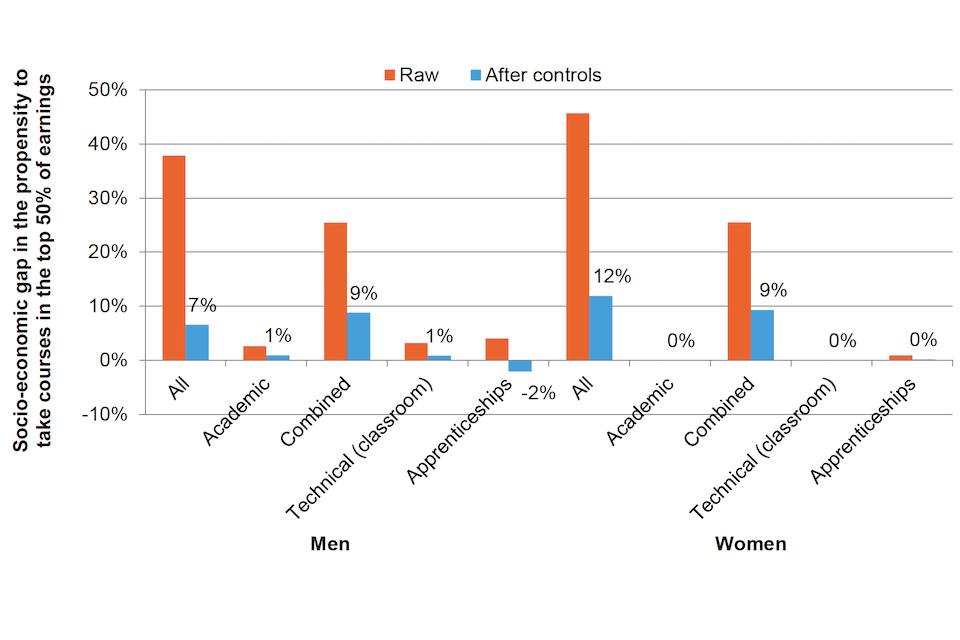
Notes and sources: Authors’ calculations using linked data from NPD, ILR and HMRC earnings data. Sample of young people taking GCSEs between 2002 and 2005.
The above analysis looks at men and women of all levels of prior attainment.
We have also examined differences within groups for students with similar levels of prior attainment. The men and women have been divided into 3 equally sized groups based on their GCSE results (high, middle and low prior attainment). We have then looked at the propensity to take academic and combined courses in the top 25% for earnings for the high- and middle-attainment groups (Figure 3.6), and at the propensity to take technical and apprenticeship courses in the top 75% for earnings for the low- and middle-attainment groups (Figure 3.7).
Disadvantaged men and women with high levels of prior attainment are less likely to take high- earning courses, and this is largely down to their choice of broad route – that is, their lower likelihood of taking an A level-focused route. As Figure 3.6 shows, there are significant socio-economic gaps of about 11 to 13 percentage points in the likelihood of taking a high-earning (top 25%) course between men and women with high levels of GCSE attainment, even after accounting for detailed measures of prior attainment and pupil characteristics. These gaps are generally much lower (less than 5 percentage points) within the academic and combined routes. They are also much smaller within the middle-attainment group.
Figure 3.6: The socio-economic gap in propensity to take post-16 courses in the top 25% of earnings
The socio-economic gap is defined as the difference in percentage points between the most and least deprived groups. The figures below are shown before and after controls.
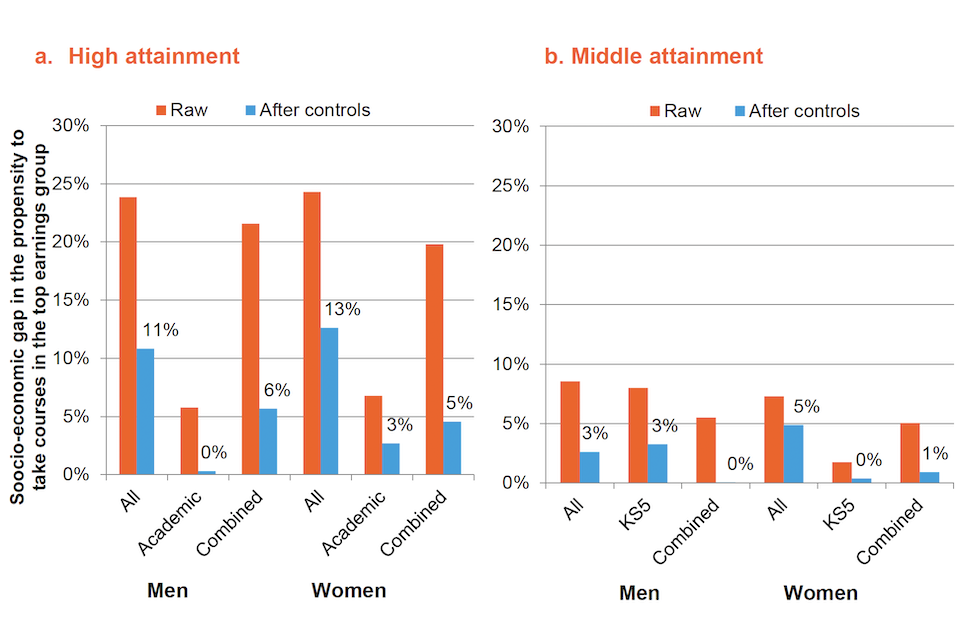
Notes and sources: Authors’ calculations using linked data from NPD, ILR and HMRC earnings data. Sample of young people taking GCSEs between 2002 and 2005.
Figure 3.7 shows the socio-economic disparities in courses linked to the top 75% for earnings – you can see the overall figures and breakdowns within the technical and apprenticeship course routes. For men, there are relatively small socio-economic gaps after controlling for prior attainment (around 3 to 4 percentage points for the middle- and low-attainment groups).
For disadvantaged women, the socio-economic gaps are much larger, even after controlling for prior attainment. Overall, these women are 6 to 9 percentage points less likely to take a course in the top 75% for earnings. If they study classroom-based technical courses, they are 5 percentage points less likely to take a course in the top 75% for earnings. For instance, as we saw in section 2, they’re more likely to choose low-earning courses in retail, commerce, public services and care. Within the apprenticeship route, if they have low or middle attainment, they’re actually more likely to take courses in the top 75% for earnings – but it’s a very small group in practice.
Figure 3.7: The socio-economic gap in propensity to take post-16 courses in the top 75% of earnings
The socio-economic gap is defined as the difference in percentage points between the most and least deprived groups. The figures below are shown before and after controls.
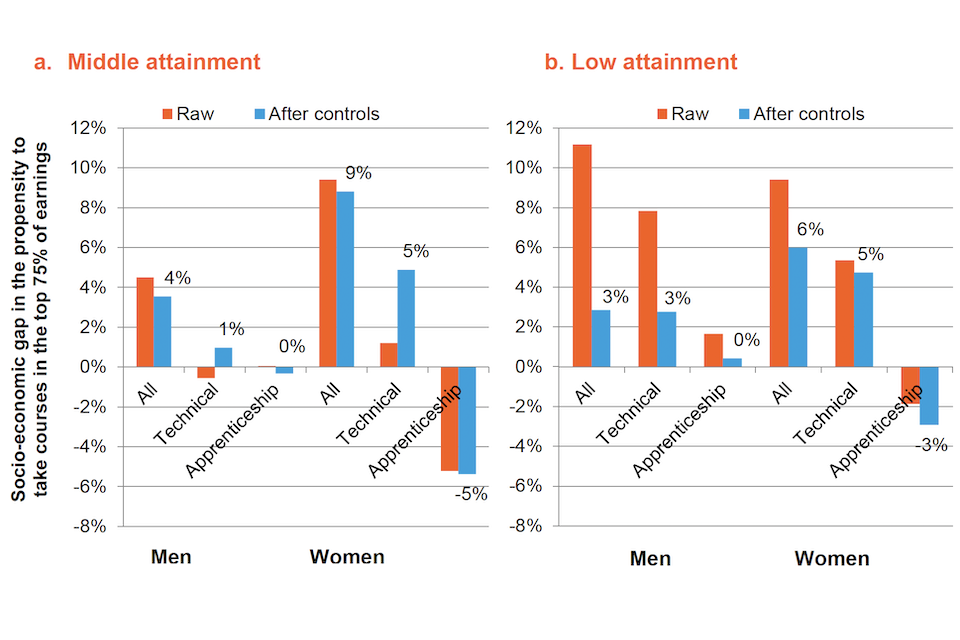
Notes and sources: Authors’ calculations using linked data from NPD, ILR and HMRC earnings data. Sample of young people taking GCSEs between 2002 and 2005.
Social mobility implications
We have estimated the relative role that course choices play in explaining the differences in early-career earnings for men and women. This is so that we can quantify the potential social mobility consequences.
We treat men in the least deprived quintile as our reference group and compare earnings with those of men and women from other socio-economic backgrounds. This allows us to examine the joint role played by socio-economic background and gender.[footnote 13] It is important to note that we are looking at earnings among those in employment, not wage rates per hour, and any differences could reflect differences in both the wages and hours worked.
As expected, men in the most deprived quintile earn substantially less than men in the least deprived quintile (30% less in raw terms). This reduces substantially to 6% after accounting for differences in prior attainment and pupil characteristics. Controlling for detailed course choices has little further effect. It therefore seems to be the case that differences in prior attainment explain the vast majority of the socio-economic differences in early-career earnings among men, though the outstanding 6% can’t be accounted for by prior attainment or subject/course choices.
Figure 3.8: Difference in earnings relative to the least deprived men at age 26, with and without controls
| Socio-economic status | Raw differences | Plus controls for pupil characteristics | Plus controls for detailed course route |
|---|---|---|---|
| Most deprived males | Minus 30% | Minus 11% | Minus 47% |
| Least deprived females | Minus 6% | Minus 15% | Minus 33% |
| Most deprived females | Minus 6% | Minus 12% | Minus 28% |
Notes and sources: Authors’ calculations using linked data from NPD, IPR and HMRC earnings data. Sample of young people taking GCSEs between 2002 and 2005. Figures show the estimated percentage differences between each group and the least deprived quintile of men. Full details in Appendix Tables A4 and A5.
In raw terms, figure 3.8 shows that women in the least deprived group earn 11% less than men from similar backgrounds. This increases to 15% when we account for the higher levels of prior attainment. It’s down to 12% once we control for detailed course groups, such as level and subject.
The most deprived women earn substantially less than the least deprived men. Even after adding controls for lower levels of prior attainment, there’s a 33% difference. That reduces to 28% once we control for detailed course choices by level and subject.
The effects of socio-economic background are also much more impactful for women than they are for men. Addressing these barriers early on could have significant impacts on their future earning potential and close the gender pay gap.
Among the least deprived group, women earn about 12% less than men. Amongst the most deprived group, this increases to 22%.[footnote 14]
These effects aren’t influenced by employment rates, as our focus is on individuals who are earning money. They could, however, be partially driven by different choices on hours of work. Unfortunately, a lack of data on hours worked means that we cannot estimate the size of any such effect.
Conclusion
The evidence shows that prior attainment plays a dominant role in explaining socio-economic differences in earnings, particularly for men. However, even when attainment is accounted for, clear differences remain, with women from deprived backgrounds being the most negatively impacted. Detailed post-16 choices have minimal impact on men’s earnings. However for deprived women, the choice made could explain 4% of the 47% earnings gap with the least deprived group. That 4% may seem small but it could still result in notable social mobility consequences.
Ethnic and regional differences
There are strong differences in post-16 choices by ethnicity. Figure 3.9 shows the variations among ethnic groups for students in the 2 most disadvantaged quintiles taking courses in the top 50% for earnings (also Appendix Figure A4).
Disadvantaged men and women from Chinese and Indian backgrounds are the most likely to take higher-earning courses (over 50% take courses in the top 50% for earnings). In contrast, disadvantaged men and women from Black Caribbean backgrounds are among the least likely to take higher earnings courses (about 27% of the women and 22% of the men).
Differences were smaller among other ethnic groups, with about 35% to 40% of disadvantaged men and 40% to 50% of disadvantaged women taking higher-earning courses. There are, however, some notable gender differences. Over 50% of disadvantaged women from Black African backgrounds took higher-earnings courses, compared with 39% of the disadvantaged men. In almost all cases, disadvantaged women were more likely than men to take higher- earning courses. However, women from White British backgrounds were less likely (24%) to take higher-earning courses than men from White British backgrounds (33%). This has an impact on the overall figures.
Differences by region are much smaller than by socio-economic background or by ethnicity (full differences are shown in Appendix Figure A5). The share of disadvantaged women taking high- earning courses is highest in London and lowest in in the north-east and north-west. There are similar patterns for men, though the disparity is smaller. These regional patterns seem likely to be driven by differing socio-economic structures and potentially local availability. For example, London has the largest share of school sixth forms and ready access to high-earning academic qualifications, while the north-east and north-west of England have the lowest share of school sixth forms.[footnote 15]
Figure 3.9: Percentage of men and women in the most disadvantaged 40% taking post-16 courses in the top 50% of earnings, by ethnicity
| Ethnic group | Men | Women |
|---|---|---|
| Chinese | 64% | 73% |
| Indian | 52% | 62% |
| Black African | 39% | 53% |
| Bangladeshi | 38% | 48% |
| White Other | 37% | 39% |
| Pakistani | 36% | 43% |
| Other | 34% | 31% |
| White British | 33% | 24% |
| Black Caribbean | 22% | 27% |
Notes and sources: Authors’ calculations using linked data from NPD, ILR and HMRC earnings data. Sample of young people taking GCSEs between 2002 and 2005. All cell sizes are greater than 50.
Figure 3.10: Percentage of men and women in the most disadvantaged 40% group taking post-16 courses in the top 50% of earnings by region
| Home region at age 16 | Men | Women |
|---|---|---|
| Inner London | 36% | 42% |
| Outer London | 38% | 40% |
| East Midlands | 36% | 29% |
| East of England | 34% | 28% |
| West Midlands | 33% | 28% |
| South East | 33% | 27% |
| South West | 34% | 25% |
| Yorkshire and the Humber | 33% | 25% |
| North West | 33% | 25% |
| North East | 32% | 23% |
Notes and sources: Authors’ calculations using linked data from NPD, ILR and HMRC earnings data. Sample of young people taking GCSEs between 2002 and 2005. All cell sizes are greater than 1,000.
4. The drivers of post-16 education choices
This chapter uses interviews with providers and learners to describe the wider behavioural drivers affecting course decisions (see the box below for a description of the overall approach).
Key findings
Young people taking higher-level courses are usually better informed about the education pathways and opportunities open to them compared with those taking lower-level courses.
Only 3 in 5 young people say they received careers guidance before the age of 16, suggesting a major gap in current provision. Lack of knowledge at age 16 about related education and career pathways can inhibit the learners’ course choice.
FE colleges and providers play an important role in shaping choices and go to significant lengths to improve knowledge, through outreach materials, taster sessions and an initially varied curriculum.
Higher-achieving learners are more likely than others to be able to access the course they enjoy and are often better able to articulate their career goals. The choices available to lower-achieving learners are limited by requirements to address gaps in their knowledge of core subjects critical to post-16 courses.
Gender roles remain a pervasive influence on learners’ course selections and there is a lack of role models on learners’ course choices.
Apprentices value the financial stability this route provides.
Public transport links and the cost of travel can influence learners’ choice of provider and courses, particularly for apprentices. If they are able to, providers should subsidise public transport costs for learners to increase access to their courses.
Behavioural approach:
We conducted in-depth interviews with senior leaders, teachers and learners from 5 learning providers – 4 general further education colleges (GFECs) and one independent training provider (ITP) – plus a senior leader from an additional ITP and one employer. The COVID-19 pandemic meant that only half of the anticipated interviews were completed. The findings have been analysed using the COM-B behavioural framework of Michie, Atkins and West (2014). Full details of the fieldwork approach can be found in Appendix B.
Capabilities
Prior skills and knowledge of progression routes are critical factors in learners’ course selection decisions. In this section, we discuss the role played by prior attainment, learners’ knowledge of how to navigate the system, and how providers seek to influence and inform choices.
Role of prior attainment
The quantitative analysis shows that prior attainment is the key determinant of learners’ course selection, influencing the level and type of course chosen, as well as the provider. Learners’ prior achievement in English and maths was considered by many staff, and learners, as critical to their course choice. Learners without at least a GCSE grade 4 in English and maths typically retake these exams in order to access Level 3 courses.[footnote 16] Government policy has also been targeting shortfalls in English and maths for some time and directed the FE sector to support learner attainment in these subjects.
Similarly, some learners said they chose a particular provider or lower-level technical course by default as a result of lower achievement. These learners said that their low GCSE English and maths grades meant they could not take academic subjects at sixth forms and so they became apprentices or directly entered Level 2 or 3 technical courses instead.
Knowledge of system, opportunities and pathways
Knowledge of available options, and the related education and career pathways, is an important factor in course choice. Learners’ prior attainment levels, access to careers advice, the quality or availability of advice from family contacts, and prior experience are perceived as key to the decision making. Many staff interviewed for the study, particularly in FE colleges, commented that some learners had not acquired the skills or knowledge to determine the suitability of courses based on their abilities, interests and careers aspirations.
Lower-level courses or courses applicable for a variety of occupations, such as ‘business’, are sometimes considered by the staff to attract learners who are uncertain about their education or career. Learners with lower achievement are more likely to be channelled towards these courses because they are accessible and keep learners’ options open. However the students are more likely to drop out or change course.
Learners on higher-level and more technical courses were viewed by some staff to be better informed about progression routes, often because they had a clearer idea of their future direction.
“Anyone below Level 2 has poor information with regard to their next steps and why they’re going on to a programme. With Level 3 and above, especially with science and engineering, they’re a little bit more informed about what they want, with almost a destination in mind.” (GFEC, senior manager)
Sources of information
Learners gain information and knowledge of the post-16 education system from a variety of sources: careers guidance at school before age 16; their own research and experience; and active efforts by providers.
Role of careers guidance at school:
Many staff believe that learners’ lack of knowledge stems from insufficient access to careers guidance prior to enrolling post-16. The survey evidence shows that only 61% of young people aged 13 or 14 report having received any careers advice (see accompanying literature review, Table 3). At age 14 or 15, a similar proportion (59%) received support from a careers adviser coming into their school. Similar levels of careers guidance were reported by students of all backgrounds.
Learners’ own research and experience:
Some learners undertook their own research about onward academic and career progression routes before selecting their first course post-16. For example, research by some learners identified that business and travel courses offered a breadth of career options. Other learners reviewed providers’ websites to identify and understand the courses offered, or attended providers’ open days and consulted prospectuses. As a result, they said they felt more informed about their options and this influenced their choices.
Other sources of knowledge noted by interviewees include prior experience in an industry or understanding gained through developing a skill relevant to a vocation, such as:
- previous employment or part-time jobs
- learners with a talent or hobby-based skill, such as IT or creative arts
Other research also notes the effect that wider media and celebrity can have in influencing educational choices.[footnote 17]
Active efforts by providers:
Providers undertake a wide range of activities to increase learners’ knowledge and hence improve course decision-making. For example:
-
providing promotional materials and hosting events to inform learners about available courses and associated career pathways – staff interviewees were particularly positive about the role played by alumni and employers.
- offering multiple taster sessions to improve prospective learners’ knowledge of course options and progression routes
- working with schools to inform learners and parents/guardians about potential courses and resulting career options[footnote 18]
- providing personal interactions in combination with promotional materials – some learners said they would not have considered taking up their courses without face-to-face contact and discussion with post-16 teachers
- offering pre-course interviews to potential learners – staff said that these help learners to choose courses that reflect their skills, interests and aspirations
- offering tasters of the lower-level courses with wide-ranging curriculums so that learners can explore the different subjects
“A lot of learners aren’t sure what they want to do, particularly at the lower levels, so it’s important to give them a broad exposure, to enable them to progress and specialise as they go. For example, at 16, at Level 2, you might not really know what ‘events management’ is. But if you get a taster of it, within your first year, you can then progress through the course.” (ITP, senior leader)
Case study: Stanmore College – supporting and advising learners to follow non-academic career routes
This is a relatively small general FE college in north west London with 3,000 learners aged 16+. It offers a broad range of non-trade-based vocational qualifications (business studies and engineering) from Levels 1 to 6. They offer all new students a taster day ‘so they get a good flavour of what they might enjoy.’
Senior leaders believe that a key strength is giving learners a second chance. A leader said: ‘It gives them a second opportunity to do better than they did at school where some had a pretty poor experience’. The staff describe how important it is to help nurture and develop learners.
The college takes a ‘rounded approach’ to education, helping students to identify their own interests and career paths. They would like young people to be informed about the vocational pathways available, ‘much much earlier’, so that they can make informed course choices post-16.
Summary of capabilities
Interviewees emphasised that young people taking higher-level courses are usually better informed about the education pathways and opportunities open to them compared with those taking lower-level courses. The latter are more likely to take generic courses. Providers also go to significant lengths to improve knowledge, through outreach materials and taster sessions.
Motivations
Our literature review shows that aspirations to continue in education or training are high, with 80% to 90% of young people wishing to continue in education. There is, however, a clear socio- economic gradient, as 94% of young people from professional backgrounds aspire to stay in education compared with 82% of those from disadvantaged backgrounds.
There are also large socio-economic differences in specific pathway aspirations. Just over three-quarters (77%) of young people from professional backgrounds express a desire to progress to a sixth form, compared with half (50%) of young people from disadvantaged backgrounds. Young people from more disadvantaged backgrounds are much more likely to prefer a course at an FE college.
The qualitative evidence shows that a wide range of motivational factors influence learners’ course selections. Learners often articulated a reason for selecting their course based on their aspirations, likes and interests, emotive experiences, and career goals.
Interests and past emotive experiences
Using interests in decision-making:
Prior interest in and enjoyment of a subject were recognised by staff as important drivers for learners’ course choices. Learners also frequently articulated at interview how their course selection was driven by their love or enjoyment of a subject. This emotive reaction covered a range of courses, from automotive to travel and business, across all educational levels.
“I think the primary driver for a lot of learners is interest and passion in that subject area… for a lot of learners, within the creative sector, it’s something that they’ve got an existing interest in anyway and it’s the chance to take it to the next level.” (ITP, senior leader)
Several learners demonstrated a strong passion for subjects in which they had developed prior skills and experience through a hobby or talent – for example, gaming and coding in IT, or singing and dancing. In these cases, the capability and motivational aspects of behaviour are symbiotic: the learner’s interest leads them to develop skills which, in turn, feeds their interest.
For some provider staff, helping learners to identify subjects that relate to their areas of interest and enjoyment is considered an important way to guide course selection, and can improve subsequent retention on those courses.
The motivational impact of past experiences:
Past emotive experiences are also important drivers behind some learners’ course selection decisions. For example, according to staff at one FE college, courses in health and social care often attract learners who have personal experience of mental health issues or have observed family members experiencing the challenges of addiction.
Aspirations
Prior attainment influenced the way some learners articulated future aspirations. Learners who achieved the grades that enabled them to follow their preferred course held clearer, longer-term goals compared with the more limited choices available to those missing grades. Staff said that more technical courses which require high prior grades (such as engineering) are taken by learners with a clearer idea of future goals.
Conversely, learners who achieved lower grades than expected, and were unable to choose the course they had originally anticipated, appeared less certain about their future. These learners faced a knock in confidence, leading them to reconsider if and how they could achieve their goals.
“I had a small little goal in mind of what I had wanted to do… then my grades were actually worse than they should have been, for what I wanted, so I ended up getting put onto a BTEC route rather than what I had originally wanted.” (GFEC, Level 3 learner)
Staff also recognised that a learner’s belief about their capability plays an important role in their aspirations. Learners taking lower-level courses because of lower GCSE achievement are perceived by provider staff as less confident about their abilities and holding lower aspirations. A learner’s choices are limited by poor prior attainment, leading to an increase in mandatory, corrective courses. Some, or all of the choice, is taken away from the learner.
“I think that it’s most difficult to aspire to achieving higher [grades] for the students that have really failed at school… They’re coming in at Level 1, and having to do their functional skills, or their GCSE English and maths.” (GFEC, senior leader)
Evidence shows that young people from more deprived backgrounds, or with low attainment at age 16, are more likely to find themselves on non-academic routes, including technical courses.[footnote 19] This is regardless of their earlier (high) aspirations. The disappointment which results from taking an unfavoured route with mandatory elements can hinder informed decision-making after age 16, particularly given the gaps in career advice provision and perceived lack of knowledge of technical routes.
A number of providers offer support to address motivation affected by low attainment. Some providers support learners with aspirations towards higher education by demonstrating the alternative routes they can take to achieve their original goal. One provider works with the learner to help them identify alternative courses of interest. Another invests significant time in interviewing learners prior to enrolment to fully understand their aspirations.
Career goals
The extent to which learners can select courses based on their longer-term goals varies. Based on the interview evidence, apprentices often have the strongest vocational aspirations of learners taking non-academic options post-16.
“[Apprentices] are motivated, they do want to progress … I think a lot of them are motivated by the chance to get work experience… they want to start their career, they want to progress.” (Employer)
Anticipated employment opportunities were perceived by some learners and staff to motivate learners to choose specific courses. Some provider staff from ITPs and colleges believe that courses such as IT and accounting attract learners because of their association with ample employment opportunities and relatively high salaries. As a result, some providers purposefully include the likely employment and salary outcomes of courses in their promotional materials.
“We’re always really clear in making those links to the sector, so in really simple terms this course could lead to X,Y, or Z… That is quite prevalent in our promotional literature and in the discussions that we have with learners.” (ITP, senior leader)
Some learners’ course selections (construction and beauty within our interviews) were influenced by parents, family members or friends who work in these sectors. Some learners also saw skilled trades as an opportunity to earn a high income and run their own businesses.
External influences
External factors influence some learners’ course selection decisions. These include:
- apprenticeships, which are perceived to offer financial stability and an opportunity to gain work experience and earn money at the same time
- the learning environment - some provider staff felt that their environment is to be considered more attractive than sixth forms by many learners, particularly those who have had a negative experience of school
- a number of factors linked to disadvantage, which were cited by staff at one provider, including local unemployment levels, drug addiction and mental health issues
Summary of motivations
Disadvantaged learners are more likely to take a technical route, even if they initially aspired to an academic route. The depth and quality of careers guidance is variable, and learners often lack experience of non-academic routes before age 16. Such inexperience can inhibit informed decision-making. Providers play a key role in helping to guide young people to courses based on their interests and career goals. Interest and past experiences are often key drivers of aspirations and choices. However, learners can be influenced by views on expected earnings, financial stability and the learning environment.
Opportunities
The local availability of provision, social factors and structural features of the FE system also influence post-16 course selection.
Local availability of provision
The academic literature shows that geography and local availability/choice of provision strongly influence the options available to learners from disadvantaged backgrounds. Students in poorer areas are 14 percentage points more likely to choose an FE college over a sixth form college, even after allowing for academic achievement at GCSE.[footnote 20] Some of this is explained by a combination of regional variation in the number of sixth form places available, and the fact that regions with fewer sixth forms tend to have more limited choices of A level subjects. For example, London has a high share of school sixth forms, with much lower availability in the north-west and north-east. In areas with more school sixth forms, mid-level attainers are less likely to study in FE colleges and more likely to take Level 3 qualifications compared with the national average.[footnote 21] In contrast, they are less likely to take Level 3 qualifications in areas with fewer school sixth forms. This shows that the easy and clear option of school sixth forms can encourage middle attainers to take a Level 3 course.
“Some transportation systems [in rural areas] are city prices. So, if you’ve got someone on an apprenticeship and only earning £4 to £5 an hour for the first year, suddenly being hit with an £8 or £9 return fare on public transport can have quite an impact on that individual.” (GFEC, teacher)
The evidence from qualitative interviews shows that transport costs and limited subsidies result in many learners choosing courses from providers closest to home. Financial and temporal costs are felt keenly by learners in rural areas and those who are badly positioned within urban transport networks. Travel can also be challenging for apprentices split between a workplace and a learning provider. Staff at one rural college noted that some of their learners wish to learn close to home and so they look for degree-level progression routes at the local college rather than more distant higher education institutions.
Case study: Truro and Penwith College – meeting the challenges faced by rural learners
- A large FE college with 2 main sites: the city of Truro and the Penwith area.
- Has 5,000 16- to 19-year-olds split fairly equally across academic and vocational, technical or occupation education, as well as around 600 apprentices.
- Offers a range of qualifications from Level 1 to Level 6 in most subjects except for land-based specialisms.
Truro and Penwith College draws learners from across the largely rural country of Cornwall, which is characterised by limited public transport services and areas of socio-economic deprivation. The travel issue is reflected in the relatively long commute of one of its learners studying a Level 2 motor vehicle course: ‘I live in Falmouth but Falmouth School didn’t offer the diploma… The college is about 45 to 50 minutes on the bus.’ The travel distance can act as an environmental barrier for disadvantaged learners.
The college provides bus bursaries to help learners from lower income families access its courses. One member of the senior management said: ‘We subsidise bus travel and there’s a bursary system depending on salary. So if you’re on a low income, you can get a bus pass for something like £30 or £50 for the whole year and that will get you to and from the college from anywhere in Cornwall.’ In addition, the college has recently opened its third campus at the Callywith site in Bodmin to serve learners in the more rural east of the county and reduce their need to invest as much time and money in commuting. ‘It’s 30 miles to the east of here because some learners were travelling 2 hours each way to get to us’ (senior leader).
Examples of actions taken by providers
Staff at a number of providers attempt to overcome cost barriers in a variety of ways:
- offering transport bursaries or subsidised bus passes
- working with employers to increase understanding of how costs affect learners’ course choices – this has resulted in some employers increasing their salaries for apprentices or supporting learners with public transport costs
- offering a range of high-quality courses to attract learners in rural areas
Staff at one provider said that travel barriers were less concerning for learners who had a clear idea about career pathways, had prior attainment or were taking courses at Level 3 or above. In short, they had stronger course-related incentives to travel.
For some, a provider further away from home can be attractive. Senior leaders and teachers cited the threat of gangs as one such push factor.
“We’ve had students chased down the road with people wielding knives, we’ve had acid attacks… this almost becomes their safe space.” (GFEC, senior leader)
Social influences
Gender roles remain a strong social influence on course selections, as do the actions and choices of peers. Parents also play a role. Where school staff offer guidance, they academic over technical routes for higher achievers, especially if the school operates a sixth form.
Gender roles:
A number of teachers said that traditional gender roles influence course selection. Men are much more likely to take technical courses such as engineering and IT, automotive or construction; women are more likely to take caring courses such as childcare or social care, and hair and beauty. Note the use of ‘obviously’ in the quote below, which suggests that long- standing norms run down the course choice pathway.
“Obviously, hair and beauty is very female-orientated. It’s very similar in automotive and construction [which are very male-dominated]… we work quite hard to inspire more females to go into automotive and construction [and vice versa] with hair and beauty.” (GFEC, senior leader)
Provider staff think the gender disparities in course choice replicate the gender bias in the respective industries. Senior leaders at one FE college also suggested that gendered choices are particularly common among learners with negative learning experiences at school, and those studying courses with fewer qualification prerequisites (construction for males and hairdressing for females).
Case study: Highbury College – gender stereotypes influencing course selection
- A medium-sized general FE college serving Portsmouth and surrounding areas of east Hampshire.
- Provides a range of academic and vocational courses across 6 centres, from pre-entry level through to foundation degrees.
- Has nearly 7,000 learners with approximately 1,100 students on 16–19 study programmes plus around 500 apprentices aged 16 to 18.
Several of the staff say that a learner’s family influences their course selection: ‘They’re following the same occupation as [their] mum or dad or sister or brother… We all hear “well, I’m doing brickwork because my dad was a brickie, my uncle was a brickie, my grandad was a brickie. It was good enough for them so that’s what I’m going to do.”’ One female learner echoed this: ‘Because my mum’s a hairdresser, I always wanted to do hair and make-up and stuff.’
Highbury College undertakes outreach activity with local schools, including hosting careers events. In recognition of the influential role played by the family, the college holds information sessions for parents. The college also has its own careers service to provide prospective and existing learners with information to help broaden their learning horizons - and signpost students to taster sessions.
Schools:
The so-called ‘Baker Clause’ of the Technical and Further Education Act 2017 stipulates that all schools must allow colleges and training providers access to all pupils in years 8 to 13 to discuss non-academic routes. This has been in force since the start of 2018. It is probably too early to evaluate its overall impact. However, our interviews suggest that many feel that there is still insufficient advice on non-academic routes.
Apart from testimony from a few apprentices, there is little interview evidence of schools positively influencing learners’ technical course selection. Three apprentices at an ITP indicated that their teachers had encouraged them to study a subject they enjoyed and promoted the value of gaining work experience while studying. However, 2 of them said far more guidance was provided about university and other academic career paths.
The paucity of advice on technical education is a well-documented and long-term issue. The government’s recent briefing paper on ‘Careers guidance in schools, colleges and universities’ refers to a 2013 thematic review conducted by Ofsted which found that:
Vocational training and apprenticeships were rarely promoted effectively, especially in schools with sixth forms. The A level route to universities remained the “gold standard” for young people, their parents and teachers.
Some teachers say that learners from schools without sixth forms are usually better informed about the variety of pathways available than those attending schools with sixth forms. This absence of technical careers guidance was also noted by a few learners.
“Our school didn’t say anything about colleges, really… I think because [the college is not near the school].” (GFEC, learner)
Some provider staff agreed that not enough emphasis is given to technical routes. They argued that schools with sixth forms do not inform their learners about the full range of courses to maximise the chances of keeping the students and the associated funding in the school.
Several senior leaders said that learners should be informed, at an earlier age, about the full range of post-16 study opportunities.
“The biggest thing that the education sector need to do more of is… get into schools much earlier to help students understand what their opportunities are.” (GFEC, senior manager)
Role models:
According to some interviewees, there was some crossover between the influence of gender roles and the presence or lack of role models. Some senior leaders at an ITP said that fewer females select IT courses because IT occupations are dominated by men. Of the young women choosing IT courses, many gravitate to customer-facing courses such as digital marketing rather than the more technical programmes, like programming, which are more likely to be chosen by the men. The senior leaders believed that the promotion of female role models in a variety of IT-dependent occupations would encourage more female learners.
Peers:
Peers are considered by some staff and learners as integral to the course selection process. Staff said that learners are more confident in choosing a course if their friends are doing it, or if they receive word-of-mouth recommendations from other young people. If career guidance in school is limited, then staff say that social influences, particularly from peers, are strong drivers in the decision-making. Indeed, recent research has shown that young people with more ‘able’ peers are less likely to take technical courses.[footnote 22]
Parents:
Some learners say that their parents[footnote 23] played a key role in the course they selected. Many staff recognise this and tailor their careers guidance so that it’s accessible to parents.
Parental engagement is viewed as an important social influence. For instance, graduate parents are perceived by staff to strongly engage in academic course selection and provide associated careers guidance to their children. Additionally, the level of course could be related to the extent of parental engagement. Some staff interviewees said that learners on higher-level courses often have more supportive parents. The secondary evidence shows that parents working in professional occupations can offer good advice on the most suitable subjects and qualifications.[footnote 24] In contrast, young people from low socio-economic backgrounds, following technical routes, are more likely to take courses related to their parents’ occupations.[footnote 25]
Staff have noted that limited parental engagement can inhibit a child’s aspirations. For instance, staff of one FE college identified a propensity among some parents to advise their children to work locally or within the family business. Furthermore, staff feel that parents with histories of not working may have lower expectations and aspirations for their children.
Other staff have reported instances of parents limiting their children’s options by solely promoting A levels as a route to university. To address these issues, the FE college has sought to engage parents in their outreach activities to inform them about the value and benefits of apprenticeships.
System features (funding, institutions, incentives)
Providers’ relationship with employers:
One ITP staff member said that learners are attracted to their organisation’s relationships with employers and access to work experience and employment opportunities. Several providers say their curriculum is designed to deliver the skills required by employers and develop strong employer relationships. Some learners indicated that they were aware of this when choosing a course.
Funding incentives:
The funding system can create perverse incentives for providers. For example, it prioritises programmes with high completion rates through a retention factor in the funding system.[footnote 26] As a result, there is an incentive for providers to offer easily achievable qualifications, which develop fewer skills. Thus, many learners with low-level technical qualifications end up cycling between NEET (not in education, employment or training) and retraining. However, if providers think young people will drop out quickly, there is also an incentive to start young people on expensive, high-level courses they are unlikely to complete.[footnote 27]
Additional needs:
Extra support is used to incentivise learners with additional needs. FE colleges cater for a wider range of backgrounds and challenges than ITP or sixth form providers, both of which typically enrol fewer learners. FE colleges can more readily fund infrastructure to supports a broad set of learner needs. Senior leaders and teachers at one FE college said that they provide coaching and personal tutoring, taxis to and from college (in exceptional circumstances), and welfare and pastoral support teams where necessary.
“It’s quite a caring, nurturing environment. Quite often, young people [with prior mental health issues] are recommended to come here for that very reason.” (GFEC, curriculum manager)
The senior leaders of another FE college commented on their intake of learners with behavioural and attendance issues. They felt that they had successfully adapted delivery and pedagogy to effectively support them.
“We’ve highlighted their poor attendance and their mum and dad said, ‘do you know what? 54% from our son is fantastic, because at school it was 17%.’” (GFEC, teacher)
Summary of opportunities
Young people from disadvantaged backgrounds are particularly sensitive to variations in the local offer and travel costs. Gaps in careers advice make some young people dependent on peer and parental advice. Gender influences remain pervasive. A lack of advice in schools about technical pathways is perceived as problematic by FE colleges and ITPs. FE colleges are, however, well placed to develop attractive relationships with employers and support learners with additional needs.
Implications for behaviour
Based on the interviews, we are able to connect decision influences to the theoretical domains framework (TDF) of the COM-B model.[footnote 28] This translates behavioural theory into practical elements for implementation purposes. Twelve domains are included in our model, each related to the Capability (red), Opportunity (orange) and Motivation (yellow) themes (see Figure 4.1).[footnote 29] The number assigned to each of the 10 listed influencers is placed at the edge of each domain to identify each relationship. We discuss these in turn.
Figure 4.1: Overall behavioural model of decision-making
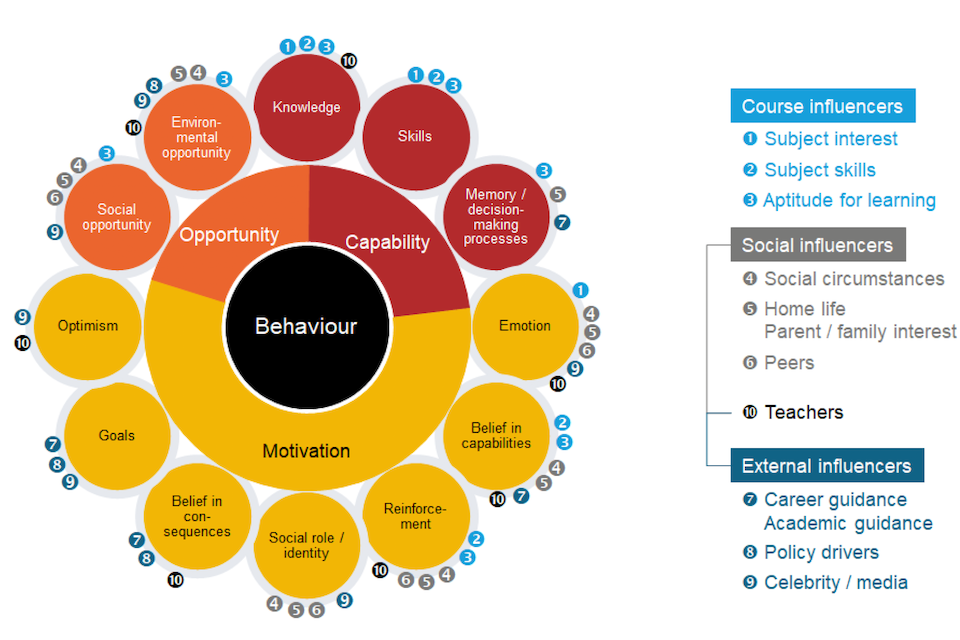
Course influencers
Subject interest:
Capability: Knowledge, Skills. Motivation: Emotion
Most learners select courses based on some level of interest, which largely relates to 3 domains: subject knowledge, skills (and their ability to apply knowledge), and emotions which arise from relevant study. Many learners talked about their ‘love of the subject’ and the strong influence this has on course selection. This can also motivate learners to take subjects they may like less (such as English or maths) if they act as a pathway. Learners with lower attainment at 16 can have less freedom to choose and are compelled to take some corrective course elements to address skills and knowledge gaps in core subjects.
From a social mobility perspective, the interventions which could matter here are those that ensure disadvantaged children with aptitude for a subject and a desire to learn more get the same access to progression opportunities as the advantaged.
Subject skills:
Capability: Knowledge, Skills. Motivation: Belief in consequences, Reinforcement
A learner’s skills cover what they know about a subject of interest and how well they are able to express that knowledge to others. Their skills will have a direct relationship to attainment at GCSE (where the individual also has good recall and performs well in test situations).
Confidence will also play a role. Learners who possess a belief in their own capabilities are better able to apply themselves. They are better able to make connections between different topics and themes.
Relevant interventions come at 2 points of the learning cycle. The first comes during school, when teachers recognise a pupil’s potential aptitude for different subjects. However, their exposure to technical programmes is typically low. For post-16 learners, it can be important that interventions are designed to identify potential technical skills, or translate academic aptitudes to occupational areas.
Aptitude for learning:
Capability: Knowledge, Skills, Memory/decision processes. Motivation: Belief in consequences, Reinforcement. Opportunities: Social, Environmental
Learners with the skills to plan their own work and organise self-learning are in a better position to progress and make informed choices. While these skills are initially learned and improved during school, there are post-16 interventions that can help. These include supporting the transition to a different, ‘more adult’ learning environment.
Technical programmes and apprenticeships also operate a different set of outcomes. There is a clear end-point to an episode of learning (such as a new practical skill, a delivered service), which is not always readily apparent from academic learning. These outputs offer different reinforcement mechanisms to learners and may alter their perception of the value of learning.
Social influencers
Social circumstances:
Motivation: Belief in capabilities, Social role/identity, Emotion, Reinforcement. Opportunities: Social, Environmental
The social environment can exert strong influences on decision-making behaviour, for example through friends, family, peers and teachers. This can influence their beliefs about their own capabilities and how they see themselves in the wider world. Their wider social environment may generate strong emotional responses that could, for example, range from a desire to leave an environment to a strong physical connection with the place they live. Interventions to address the negative social influence of place on decision-making behaviour are challenging to design, because such effects manifest in many ways and are pervasive. Helping learners to recognise that they are influenced would at least raise their awareness that decisions are affected by a wider social environment.
Home life and parents:
Capability: Memory/decision processes. Motivation: Belief in capabilities, Social role/identity, Emotion, Reinforcement. Opportunities: Social, Environmental
A learner’s home life, and the level of interest in education taken by their parents or guardians, affects course decision-making. There is a strong element of projection regarding parental influence, in which parents’ own educational experiences (good and bad) influence the advice and guidance they provide. Parental support or indifference may also affect a learner’s belief in their own capabilities and subsequent choices, and elicit strong emotional responses.
The home environment can also be more or less conducive to learning. A variety of factors will lead to a supportive or challenging physical home environment, such as available space for learning and access to equipment and technology. The recent COVID-19 pandemic has illustrated how the home environment can hinder or support learning.
Provider staff and learners described existing interventions used to inform parents and guardians of the choices available to their children, many targeting their perceptions of pastoral and academic support. Some evidence of learners receiving specific support were also presented, such as covering financial help, accessibility of equipment and travel.
Peer influence:
Motivation: Social role/identity, Emotion, Reinforcement. Opportunities: Social
Staff and learners noted that the choice of provider was strongly influenced by peers. Some said that learners wanted to maintain their existing social networks. There are also parallels with social identity theory in psychology, whereby groups display different decision-making behaviours to the component individuals.[footnote 30] Peer influences may be stronger for students who are uncertain about their next steps post-16 and disadvantaged learners. Interventions which improve connections between their skills and interests, and potential courses, may help to mitigate peer influence.
External influencers
Career and academic guidance:
Capability: Memory/decision processes. Motivation: Belief in capabilities, Belief in consequences, Goals
The evidence shows that pupils receive guidance that depends on the school they attend, teachers’ views on their academic capabilities and the presence of a sixth form in the school. In the best cases, schools provide a balanced view of all post-16 options. However, there is evidence of differential advice based on academic ability (little or no mention of technical routes for the academically gifted) and mixed access to advice from college or ITP staff. The evidence shows that careers and academic guidance is patchy and differs by location.
Perverse incentives also exist whereby academically bright pupils are encouraged to follow an academic route as it is viewed as ‘best for them’ and, for schools with sixth forms, ensures steady enrolment (and the associated funding).
Interventions which deal with perverse incentives, and differential advice which is not based on the skills and interests of the individual learner, should be addressed. However, creating a guidance system which always provides impartial advice would take significant investment.
Policy drivers:
Motivation: Belief in consequences, Goals. Opportunities: Environmental
Many policies over the last decade have sought to improve access to education post-16. Such policies include raising the participation age, the continuing move to apprenticeship standards, the introduction of T levels, and policies to improve attainment in GCSE English and maths. All of these changes to environmental factors may ultimately widen choice. However, prospective learners will need support to ensure they access courses which are right for them. There is little evidence of any policy interventions which support improved decision-making.
Celebrity and media influences:
Motivation: Social role/identity, Optimism, Emotion, Goals. Opportunities: Social, Environmental
There was little evidence on the role of celebrity or media. However, role models wield influence over the social identity of young people and may affect the choices they make and how they feel about learning and different subjects.[footnote 31] Any behavioural intervention should account for these factors, and further research is needed to better understand the mechanisms.
The special case of teachers
Capability: Knowledge. Motivation: Belief in capabilities, Reinforcement, Belief in consequences, Optimism, Emotion. Opportunities: Environmental
Teachers are both social and external influencers of young people. They occupy a unique place in children’s educational development and can influence all 3 main components of behaviour within the COM-B model. First and foremost, they teach and so strongly influence all elements of a young person’s capabilities. Teachers impart subject area knowledge and the methods and techniques students use to guide their own learning. Good teachers also motivate, reinforce learners’ belief in their own capabilities, and can offer emotional support and optimism about the future. This applies to all phases of education.
Teachers in FE commented on the role they play in addressing low levels of knowledge, confidence and motivation among learners with negative experiences of school. They are also influential as they may be best placed to make effective judgements on the abilities of young people in relation to different subjects.
Interventions for teachers revolve around effective professional development that addresses any gaps in their skills and knowledge and potentially offers development opportunities that could improve impartiality with respect to guidance on career pathways. Such interventions might include techniques to allow teachers to recognise any cognitive or perceptual biases they have that affect the advice on course selection that they provide to learners pre- and post-16.
5. Policy implications
In this final section, we discuss the policy implications arising from this study of post-16 choices. This reflects conclusions from all 3 strands of the work, which we have divided into: addressing inequalities, the role of the system and providers, and careers guidance.
Addressing inequalities
The quantitative research documented very large socio-economic gaps in the likelihood of taking high-earning post-16 courses. As one would expect, the analysis showed that prior attainment up to age 16 explains most of the differences, and practically all of the differences for men. GCSE attainment, in particular, plays a key role in shaping the educational opportunities and pathways available to young people after age 16: low attainment limits choices. As a result, addressing the socio-economic inequalities in post-16 choices requires addressing the inequalities that evolve up to age 16. This is likely to be made more difficult (but important to address) by an expected widening of educational inequalities through the pandemic.
However, prior attainment is not the sole issue, and other inequalities exist which are partially driven by differences in course choices and behaviour. Among those with high prior attainment, disadvantaged men and women are about 5% to 6% less likely to take high-earning post-16 courses. Encouraging more high-attaining disadvantaged young people to take courses with greater earnings potential – Level 3 courses in general, more A levels and more A levels in facilitating subjects – could yield returns in terms of greater social mobility.
A recurring and strong theme throughout the research is the persistent and significant gender differences in post-16 choices in technical routes. Disadvantaged women with low and average levels of prior attainment were 5% to 10% more likely to take low-earning technical courses.
Large gender differences in post-16 course choices have been widely documented in the literature. The role of gender norms and stereotyping are extremely clear from our discussions with providers and young people. There are also clear social mobility consequences, with larger gender divides in early-career earnings among disadvantaged men and women.
Closing gender differences in post-16 choices could be approached in 2 ways. First, policies and interventions could be implemented, targeted at addressing strong gender stereotypes in specific technical subject areas. Many interventions have been attempted in this space over the years, without significant progress. A recent intervention found weak effects of financial scholarships/incentives on girls’ likelihood of taking maths and physics.[footnote 32] However, discussions with the girls involved pointed to the importance of role models, work experience and confidence in driving decisions. Future interventions should focus on these drivers. This could, for instance, build on the recent ‘STEMinism’ campaign launched by Teach First, which focuses on female teachers in STEM subjects and wider societal role models or trail-blazers.[footnote 33] Recent work further highlights the importance of role models and many initiatives have been trialled to increase the take-up of STEM subjects by women, although few have been scientifically evaluated.[footnote 34]
The second way to reduce the social mobility implications of gender differences is to increase earnings in occupations predominantly chosen by women from disadvantaged backgrounds and with low levels of educational attainment. These include jobs in the childcare, adult social care and retail sectors. Earnings in many of these occupations are heavily influenced by government action, including funding levels and minimum wage legislation. Increasing wages could cause a big shift in the labour market with large financial costs, but it could also yield returns in terms of higher levels of social mobility for disadvantaged women or improvements in the quality of services.
Finally, a number of ethnic differences emerge from the research. In particular, disadvantaged men and women from Black Caribbean backgrounds are far less likely to take high-earning courses than those from other ethnic backgrounds. Disadvantaged women from White British backgrounds are also much less likely to take high-earning courses. Indeed, the White British group is the only case where disadvantaged women are less likely to take high-earning courses than disadvantaged men. These differences are concerning, and further research is needed to understand why Black Caribbean men and women, and White British women, are less likely to take high-earning courses.
Groups with lower chances of taking high-earning courses:
Disadvantaged men and women with high levels of prior attainment are less likely to take high-earning A level combinations.
Disadvantaged women with low and average levels of prior attainment are more likely to take technical courses and apprenticeships in low-earning subjects.
Disadvantaged Black Caribbean men and women are much less likely to take high-earning courses.
Disadvantaged White British women are less likely than men to take high-earning courses (they are the only group to show this pattern of behaviour).
Role of the post-16 educational system
The role of the system, and the options available locally, can be a key factor in shaping young people’s choices and the extent to which disadvantaged pupils take higher-earning courses.
Three key conclusions emerge.
First, it would not be desirable to treat academic and technical qualifications as totally separate tracks. Combinations of academic and technical qualifications are relatively high-earning and offer young people the chance to continue down an academic or technical route after their post- 16 education. These combined routes are not designed into the system like in other countries (for example, a business or commerce course combining maths with technical qualifications). However, the ability to combine academic and technical qualifications is an under-appreciated strength of the current system. The implementation of T levels should not close or narrow down this option. In particular, existing high-quality technical qualifications should be retained. However, delays in approving apprenticeship standards and operationalising T levels (which naturally marry technical and academic subjects) should also be addressed as a matter of priority.
Even high-performing systems, such as those in Switzerland and Germany, display inequalities in access to higher-level technical education, with students from higher socio-economic backgrounds dominating these routes. This is thought to be down to the effects of early tracking into separate and different routes.[footnote 35] This provides us with another strong case for not totally separating out technical and academic routes.
Second, the recent white paper, ‘Skills for jobs: lifelong learning for opportunity and growth’, aims to enable more young people to take and progress to Level 4 and 5 qualifications.[footnote 36] This would be positive, as these qualifications are in high demand and evidence shows high returns. However, there is a high level of competition and, almost by definition, these opportunities will probably be taken up by those with high levels of prior attainment. This could widen existing inequalities. To mitigate this effect, it is important that policy makers have a strong focus on enabling more disadvantaged young people to take up these opportunities, and design clear, longer progression pathways from lower-level courses. For example, ensuring the T level transition programme is successful will be key to allowing young people to take Level 3 technical qualifications. If this is successful, the key ingredients could also be employed to ensure more young people progress further to Level 4 and 5 qualifications.
Third, disadvantaged students respond to what is available locally. Disadvantaged students with average levels of prior attainment are less likely to study Level 3 qualifications (of any type) in areas with fewer school sixth forms, such as the north-west and north-east of England. This suggests that school sixth forms act as a useful default to enable more disadvantaged students to take higher-level qualifications. If school sixth forms close because of low student numbers or funding constraints, the number of disadvantaged students taking Level 3 qualifications is likely to decline. It is therefore important that the local offer for disadvantaged students provides accessible opportunities to take A level or Level 3 qualifications, either on their own or in combination with technical qualifications.
On a similar theme, travel costs can also be a barrier to young people taking the course they want. Interviewees emphasised the benefits of providing help with travel costs. Wider schemes and interventions to help with travel costs could be trialled to allow more young people to take courses that match their skills and interests.
Careers guidance
Finally, discussions with young people and providers reveal the potentially crucial ways in which careers guidance can match young people to the best options for them.
Unfortunately, surveys reveal that over one-third of young people lack access to any careers guidance before age 16. Even when careers guidance is available in schools, the quality and usefulness of this varies, with less focus on non-academic routes. Young people taking academic and higher-level courses are usually better informed on career options and progression routes than those on lower-level and technical routes. This is almost certainly linked to young peoples’ limited exposure to technical subjects and associated learning methods before age 16. The extremely complex set of technical education choices and pathways and current holes in the provision of careers guidance is also a factor. All this evidence points to a need for a greater quantity and quality of effective and impartial careers guidance before age 16, particularly for disadvantaged students and those with low levels of prior attainment.
Post-16 providers currently play a crucial role in the system through matching young people to courses – particularly those young people with low prior attainment or with a less clear-cut idea of which pathway they would like to follow. These interventions can take place before young people begin post-GCSE courses, through open days, promotional materials or outreach events. FE providers can also offer pupils mentoring, work experience and taster days. New starters can also be initially set a varied curriculum so that they can select courses based on experience rather than guesswork. In general, providers seek to best align young people to courses based on their subject interests, goals and capabilities.
Such efforts are clearly worthwhile and show the benefits of a system that allows for switching and combining courses. However, providers also face funding incentives to ensure young people take courses they will definitely complete. This could – consciously or unconsciously – lead them to match young people to courses that are financially beneficial to the college rather than being the ideal course for the young person. The ideal solution is for impartial advice to be provided before age 16.
Welcome steps are already being made to improve careers guidance, with widespread implementation of the Gatsby principles of effective career guidance. The creation of careers hubs to create local networks between schools and colleges also represents a further positive step in this direction. However, further efforts are clearly necessary to ensure that all young people have access to effective careers guidance before the age of 16.
The recent white paper makes some welcome proposals in this area, such as the proposal to toughen the so-called ‘Baker Clause’, which stipulates that all schools must allow colleges and training providers access to all pupils in years 8 to 13 to discuss non-academic routes. While this has been in force since the start of 2018, our interviews with providers suggest that they still perceive significant problems more than a year after the clause’s implementation. The white paper also proposes to collect and present more data on the returns to different qualification routes. These are all sensible proposals. However, improving the quality and quantity has been the aim of governments for at least 20 years. There is also little mention in the white paper on ways to specifically help young people from disadvantaged backgrounds, who may be in need of targeted support. It is crucial that the government follows through on these overall commitments, provides the necessary resources and considers how to provide targeted support to pupils from more-disadvantaged backgrounds.
Appendix A. Additional figures and tables
Table A1: Number of individuals in each GCSE cohort
| Year | Number of individuals | Percentage of total |
|---|---|---|
| 2002 | 589,625 | 23.59 |
| 2003 | 621,770 | 24.87 |
| 2004 | 641,731 | 25.67 |
| 2005 | 646,778 | 25.87 |
| Total | 2,499,904 | 100.00 |
Notes and sources: Authors’ calculations using linked data from NPD, ILR and HMRC earnings data. Sample of young people taking GCSEs between 2002 and 2005.
Table A2: Sample sizes and match rates to earnings/education data
| Year | (1) Individuals in each GCSE cohort | (2) + matched education records | (3) + matched earnings data | (4) + no missing variables (final sample) |
|---|---|---|---|---|
| 2002 | 589,625 | 445,460 | 441,298 | 362,288 |
| 2003 | 621,770 | 480,899 | 476,250 | 426,409 |
| 2004 | 641,731 | 521,119 | 515,619 | 476,092 |
| 2005 | 646,778 | 533,304 | 526,894 | 483,478 |
| Total | 2,499,904 | 1,980,782 | 1,960,061 | 1,748,267 |
| % of column 1 | - | 79% | 78% | 70% |
Notes and sources: Authors’ calculations using linked data from NPD, ILR and HMRC earnings data. Sample of young people taking GCSEs between 2002 and 2005.
Table A3: Course groups and sample sizes
Academic learner route:
| Course group | Course group sample size |
|---|---|
| 0 A levels | 74 |
| 1 A level , 0 facilitating subjects | 2,300 |
| 1 A level , 1 facilitating subject | 645 |
| 2 A levels , 0 facilitating subjects | 8,647 |
| 2 A levels , 1 facilitating subject | 5,270 |
| 2 A levels , 2 facilitating subjects | 1,462 |
| 3 A levels , 0 facilitating subjects | 34,911 |
| 3 A levels , 1 facilitating subject | 62,926 |
| 3 A levels, 2 or more facilitating subjects | 85,082 |
| 4 or more A levels, 0 facilitating subjects | 14,623 |
| 4 or more A levels, 1 facilitating subject | 33,130 |
| 4 or more A levels, 2 or more facilitating subjects | 80,713 |
Classroom-based technical learner route:
| Course group | Course group sample size |
|---|---|
| Level 0 class-based course | 552 |
| Level 1 class-based course: Health, Public Services and Care | 6,488 |
| Level 1 class-based course: Science and Mathematics | 544 |
| Level 1 class-based course: Agriculture, Horticulture and Animal Care | 1,857 |
| Level 1 class-based course: Engineering and Manufacturing Technologies | 8,642 |
| Level 1 class-based course: Construction, Planning and the Built Environment | 8,148 |
| Level 1 class-based course: Information and Communication Technology | 9,012 |
| Level 1 class-based course: Retail and Commercial Enterprise | 7,629 |
| Level 1 class-based course: Leisure, Travel and Tourism | 2,738 |
| Level 1 class-based course: Arts, Media and Publishing | 2,211 |
| Level 1 class-based course: History, Philosophy and Theology | 37 |
| Level 1 class-based course: Social Sciences | 297 |
| Level 1 class-based course: Languages, Literature and Culture | 1,415 |
| Level 1 class-based course: Education and Training | 58 |
| Level 1 class-based course: Preparation for Life and Work | 38,282 |
| Level 1 class-based course: Business, Administration and Law | 2,862 |
| Level 2 class-based course: Health, Public Services and Care | 26,821 |
| Level 2 class-based course: Science and Mathematics | 942 |
| Level 2 class-based course: Agriculture, Horticulture and Animal Care | 5,030 |
| Level 2 class-based course: Engineering and Manufacturing Technologies | 20,774 |
| Level 2 class-based course: Construction, Planning and the Built Environment | 25,109 |
| Level 2 class-based course: Information and Communication Technology | 12,517 |
| Level 2 class-based course: Retail and Commercial Enterprise | 39,946 |
| Level 2 class-based course: Leisure, Travel and Tourism | 13,265 |
| Level 2 class-based course: Arts, Media and Publishing | 9,538 |
| Level 2 class-based course: History, Philosophy and Theology | 157 |
| Level 2 class-based course: Social Sciences | 169 |
| Level 2 class-based course: Languages, Literature and Culture | 462 |
| Level 2 class-based course: Education and Training | 715 |
| Level 2 class-based course: Preparation for Life and Work | 38,304 |
| Level 2 class-based course: Business, Administration and Law | 13,001 |
| Level 3 class-based course: Health, Public Services and Care | 38,915 |
| Level 3 class-based course: Science and Mathematics | 2,721 |
| Level 3 class-based course: Agriculture, Horticulture and Animal Care | 8,493 |
| Level 3 class-based course: Engineering and Manufacturing Technologies | 12,490 |
| Level 3 class-based course: Construction, Planning and the Built Environment | 5,751 |
| Level 3 class-based course: Information and Communication Technology | 12,326 |
| Level 3 class-based course: Retail and Commercial Enterprise | 20,477 |
| Level 3 class-based course: Leisure, Travel and Tourism | 16,563 |
| Level 3 class-based course: Arts, Media and Publishing | 31,829 |
| Level 3 class-based course: History, Philosophy and Theology | 1,571 |
| Level 3 class-based course: Social Sciences | 747 |
| Level 3 class-based course: Languages, Literature and Culture | 237 |
| Level 3 class-based course: Education and Training | 1,285 |
| Level 3 class-based course: Preparation for Life and Work | 16,046 |
| Level 3 class-based course: Business, Administration and Law | 14,586 |
| Level 4 class-based course or more: Health, Public Services and Care | 894 |
| Level 4 class-based course or more: Science and Mathematics | 59 |
| Level 4 class-based course or more: Agriculture, Horticulture and Animal Care | 278 |
| Level 4 class-based course or more: Engineering and Manufacturing Technologies | 994 |
| Level 4 class-based course or more: Construction, Planning and the Built Environment | 913 |
| Level 4 class-based course or more: Information and Communication Technology | 969 |
| Level 4 class-based course or more: Retail and Commercial Enterprise | 336 |
| Level 4 class-based course or more: Leisure, Travel and Tourism | 810 |
| Level 4 class-based course or more: Arts, Media and Publishing | 2,649 |
| Level 4 class-based course or more: History, Philosophy and Theology | / |
| Level 4 class-based course or more: Social Sciences | 27 |
| Level 4 class-based course or more: Languages, Literature and Culture | / |
| Level 4 class-based course or more: Education and Training | 150 |
| Level 4 class-based course or more: Preparation for Life and Work | / |
| Level 4 class-based course or more: Business, Administration and Law | 1,968 |
Apprenticeship learner route:
| Course group | Course group sample size |
|---|---|
| Level 2 apprenticeship: Health, Public Services and Care | 22,450 |
| Level 2 apprenticeship: Agriculture, Horticulture and Animal Care | 8,172 |
| Level 2 apprenticeship: Engineering and Manufacturing Technologies | 27,303 |
| Level 2 apprenticeship: Construction, Planning and the Built Environment | 27,891 |
| Level 2 apprenticeship: Information and Communication Technology | 5,080 |
| Level 2 apprenticeship: Retail and Commercial Enterprise | 61,281 |
| Level 2 apprenticeship: Leisure, Travel and Tourism | 4,577 |
| Level 2 apprenticeship: Arts, Media and Publishing | 71 |
| Level 2 apprenticeship: Education and Training | 62 |
| Level 2 apprenticeship: Preparation for Life and Work | 75 |
| Level 2 apprenticeship: Business, Administration and Law | 37,658 |
| Level 3 apprenticeship: Health, Public Services and Care | 13,944 |
| Level 3 apprenticeship: Agriculture, Horticulture and Animal Care | 1,790 |
| Level 3 apprenticeship: Engineering and Manufacturing Technologies | 39,135 |
| Level 3 apprenticeship: Construction, Planning and the Built Environment | 13,392 |
| Level 3 apprenticeship: Information and Communication Technology | 2,404 |
| Level 3 apprenticeship: Retail and Commercial Enterprise | 11,871 |
| Level 3 apprenticeship: Leisure, Travel and Tourism | 2,501 |
| Level 3 apprenticeship: Arts, Media and Publishing | 147 |
| Level 3 apprenticeship: Education and Training | 48 |
| Level 2 apprenticeship: Preparation for Life and Work | / |
| Level 3 apprenticeship: Business, Administration and Law | 11407 |
| Level 4 apprenticeship: Health, Public Services and Care | / |
| Level 4 apprenticeship: Engineering and Manufacturing Technologies | 15 |
| Level 4 apprenticeship: Construction, Planning and the Built Environment | / |
| Level 4 apprenticeship: Information and Communication Technology | / |
| Level 4 apprenticeship: Retail and Commercial Enterprise | / |
| Level 4 apprenticeship: Business, Administration and Law | 58 |
Combined learner route:
| Course group | Course group sample size |
|---|---|
| 0 A levels and Level 0 vocational course | / |
| 0 A levels and Level 1 vocational course | 4,144 |
| 0 A levels and Level 2 vocational course | 25,973 |
| 0 A levels and Level 3 vocational course | 144,695 |
| 0 A levels and Level 4 or more vocational course | 8,911 |
| 1 A levels and Level 0 vocational course | / |
| 1 A levels and Level 1 vocational course | 2,364 |
| 1 A levels and Level 2 vocational course | 12,572 |
| 1 A levels and Level 3 vocational course | 54,832 |
| 1 A levels and Level 4 or more vocational course | 2,310 |
| 2 A levels and Level 0 vocational course | 11 |
| 2 A levels and Level 1 vocational course | 3,585 |
| 2 A levels and Level 2 vocational course | 17,812 |
| 2 A levels and Level 3 vocational course | 82,546 |
| 2 A levels and Level 4 or more vocational course | 2,776 |
| 3 A levels and Level 0 vocational course | 12 |
| 3 A levels and Level 1 vocational course | 10,036 |
| 3 A levels and Level 2 vocational course | 38,773 |
| 3 A levels and Level 3 vocational course | 151,083 |
| 3 A levels and Level 4 or more vocational course | 3,339 |
| 4 or more A levels and Level 0 vocational course | / |
| 4 or more A levels and Level 1 vocational course | 5,072 |
| 4 or more A levels and Level 2 vocational course | 18,536 |
| 4 or more A levels and Level 3 vocational course | 45,049 |
| 4 or more A levels and Level 4 or more vocational course | 1,082 |
Notes and sources: Authors’ calculations using linked data from NPD, ILR and HMRC earnings data. Sample of young people taking GCSEs between 2002 and 2005. / indicates that number has been suppressed due to low cell size and/or to prevent secondary disclosure.
Table A4: Percentage difference in age 26 earnings relative to SES Q1 (the least deprived) men
| Group | Difference | Difference | Difference | Difference | Difference |
|---|---|---|---|---|---|
| Female SES Q1 (least deprived) | (1) −0.10863*** | (2) −0.14871*** | (3) −0.15041*** | (4) −0.14786*** | (5) −0.11927*** |
| Standard error | (0.003227) | (0.003022) | (0.003016) | (0.003017) | (0.003118) |
| Male SES Q2 | −0.05304*** | 0.013389*** | 0.012882*** | 0.015925*** | 0.00777*** |
| Standard error | (0.003227) | (0.003577) | (0.003565) | (0.003576) | (0.003527) |
| Female SES Q2 | −0.20068*** | −0.18779*** | −0.18942*** | −0.18454*** | −0.15126*** |
| Standard error | (0.003227) | (0.002883) | (0.002869) | (0.002887) | (0.003013) |
| Male SES Q3 | −0.09877*** | 0.01623*** | 0.016535*** | 0.022142*** | 0.008415*** |
| Standard error | (0.003227) | (0.003608) | (0.003609) | (0.003629) | (0.00357) |
| Female SES Q3 | −0.26875*** | −0.21808*** | −0.21964*** | −0.21259*** | −0.17717*** |
| Standard error | (0.003227) | (0.002784) | (0.002778) | (0.002795) | (0.002946) |
| Male SES Q4 | −0.17881*** | −0.00366*** | 0.000571*** | 0.009828*** | −0.00381*** |
| Standard error | (0.003227) | (0.003597) | (0.003622) | (0.003656) | (0.003596) |
| Female SES Q4 | −0.35725*** | −0.26582*** | −0.26361*** | −0.25621*** | −0.21573*** |
| Standard error | (0.003227) | (0.002636) | (0.002651) | (0.002678) | (0.002855) |
| Male SES Q5 (most deprived) | −0.30023*** | −0.07086*** | −0.06031*** | −0.04763*** | −0.0604*** |
| Standard error | (0.003227) | (0.003466) | (0.003533) | (0.003581) | (0.003533) |
| Female SES Q5 (most deprived) | −0.46741*** | −0.33768*** | −0.33169*** | −0.32294*** | −0.28036*** |
| Standard error | (0.003227) | (0.002431) | (0.002479) | (0.002512) | (0.002713) |
Note: In the table above we show the coefficient estimates (in percentage terms) and standard errors on the socioeconomic status (SES) dummies included in our regression models. The columns show the results from 5 regression specifications, each containing a different set of control variables. In column (1) we control for each individual’s academic (GCSE) cohort. In column (2) we control for both academic cohort and KS2 and KS4 prior attainment. We measure KS2 prior attainment using KS2 maths and English scores; KS4 prior attainment is measured using KS4 total points score, whether the individual achieved 5 GCSEs A*-–, and whether they achieved a C grade in their English and maths GCSEs. In column (3), we also include controls for pupil characteristics (ethnicity, English as another language (EAL) status, and Special Educational Needs (SEN) status) and the type of secondary school attended. In column (4), we additionally control for post-16 learner route (academic, classroom-based technical, apprenticeship or combined). Lastly, in column (5), instead of controlling for learner route we control for post-16 course group.
Table A5: Percentage difference in age 29 earnings relative to SES Q1 (the least deprived) men
| Group | Difference | Difference | Difference | Difference | Difference |
|---|---|---|---|---|---|
| Female SES Q1 (least deprived) | (1) −0.20148*** | (2) −0.24799*** | (3) −0.24874*** | (4) −0.24648*** | (5) −0.2212*** |
| Standard error | (0.004064) | (0.00373) | (0.003726) | (0.00373) | (0.003855) |
| Male SES Q2 | −0.07272*** | −0.00135*** | −0.00271*** | 0.003015*** | −0.0032*** |
| Standard error | (0.004757) | (0.004903) | (0.004897) | (0.004915) | (0.004864) |
| Female SES Q2 | −0.30372*** | −0.29319*** | −0.29461*** | −0.28823*** | −0.25918*** |
| Standard error | (0.003565) | (0.003513) | (0.003499) | (0.00353) | (0.003689) |
| Male SES Q3 | −0.13151*** | −0.00678*** | −0.00869*** | 0.000402*** | −0.01124*** |
| Standard error | (0.004473) | (0.004926) | (0.004917) | (0.004962) | (0.004884) |
| Female SES Q3 | −0.375*** | −0.3243*** | −0.32632*** | −0.31819*** | −0.28609*** |
| Standard error | (0.003206) | (0.003365) | (0.003362) | (0.003395) | (0.003584) |
| Male SES Q4 | −0.20864*** | −0.02264*** | −0.02293*** | −0.01045*** | −0.02147*** |
| Standard error | (0.004131) | (0.004955) | (0.004973) | (0.005027) | (0.004961) |
| Female SES Q4 | −0.45009*** | −0.35918*** | −0.36046*** | −0.35079*** | −0.31477*** |
| Standard error | (0.002843) | (0.00323) | (0.003236) | (0.003285) | (0.003502) |
| Male SES Q5 (most deprived) | −0.31545*** | −0.06966*** | −0.06321*** | −0.04868*** | −0.05748*** |
| Standard error | (0.003642) | (0.004884) | (0.004974) | (0.005052) | (0.004995) |
| Female SES Q5 (most deprived) | −0.54251*** | −0.41198*** | −0.40904*** | −0.3983*** | −0.35982*** |
| Standard error | 0.002402 | 0.00304 | 0.003085 | 0.003147 | (0.003399) |
Note: See note below appendix Table A5.
Figure A1: Proportion of learners in each post-16 earnings group by socio-economic status (private school plus socio-economic status quintiles) for individuals taking GCSEs between 2009 and 2012
Men:
| Earnings group | Private school | Quintile 1 | Quintile 2 | Quintile 3 | Quintile 4 | Quintile 5 |
|---|---|---|---|---|---|---|
| High | 60% | 37% | 27% | 21% | 15% | 10% |
| Middle upper | 25% | 28% | 26% | 24% | 22% | 19% |
| Middle lower | 10% | 25% | 32% | 36% | 38% | 39% |
| Low | 5% | 10% | 15% | 19% | 25% | 32% |
Women:
| Earnings group | Private school | Quintile 1 | Quintile 2 | Quintile 3 | Quintile 4 | Quintile 5 |
|---|---|---|---|---|---|---|
| High | 60% | 36% | 25% | 18% | 12% | 7% |
| Middle upper | 26% | 30% | 27% | 24% | 20% | 16% |
| Middle lower | 9% | 21% | 28% | 32% | 34% | 34% |
| Low | 5% | 13% | 20% | 26% | 34% | 43% |
Notes and sources: Authors’ calculations using linked data from NPD, ILR and HMRC earnings data. Sample of young people taking GCSEs between 2002 and 2005. All cell sizes greater than 1,000.
Figure A2: Socio-economic gap (between the most and least deprived groups) in the propensity to take post-16 courses in the top 25% of earnings, before and after controls
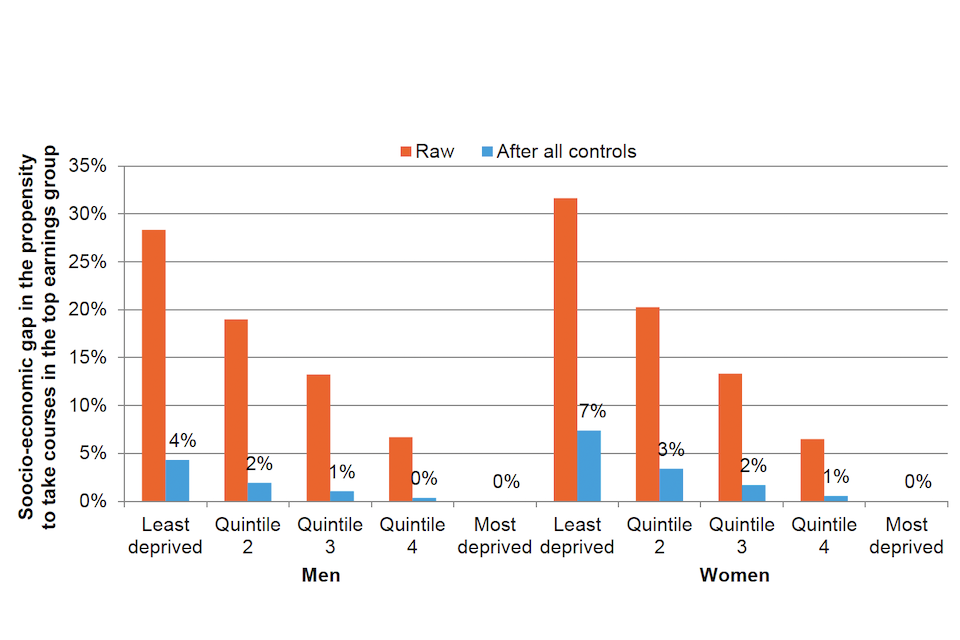
Notes and sources: Authors’ calculations using linked data from NPD, ILR and HMRC earnings data. Sample of young people taking GCSEs between 2002 and 2005.
Figure A3: Share of socio-economic gap (between the most and least deprived groups) explained by different factors
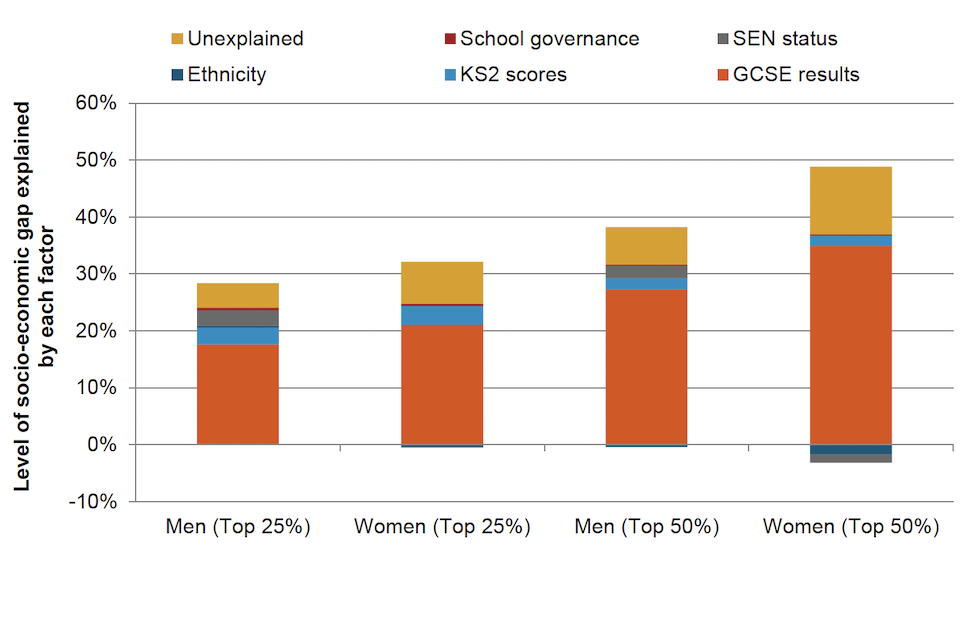
Notes and sources: Authors’ calculations using linked data from NPD, ILR and HMRC earnings data. Sample of young people taking GCSEs between 2002 and 2005.
Figure A4: Proportion of learners taking post-16 courses in each earnings group for most disadvantaged 40% by ethnicity
Men:
| Ethnic group | High | Middle upper | Middle lower | Low |
|---|---|---|---|---|
| White British | 14% | 19% | 39% | 28% |
| White Other | 16% | 21% | 38% | 25% |
| Black African | 11% | 28% | 42% | 18% |
| Black Caribbean | 5% | 16% | 45% | 34% |
| Indian | 21% | 31% | 35% | 13% |
| Pakistani | 11% | 25% | 41% | 23% |
| Bangladeshi | 10% | 28% | 39% | 23% |
| Chinese | 31% | 33% | 27% | 9% |
| Other | 13% | 21% | 39% | 27% |
Women:
| Ethnic group | High | Middle upper | Middle lower | Low |
|---|---|---|---|---|
| White British | 9% | 15% | 27% | 49% |
| White Other | 17% | 22% | 25% | 36% |
| Black African | 18% | 35% | 28% | 19% |
| Black Caribbean | 7% | 21% | 33% | 40% |
| Indian | 26% | 37% | 23% | 14% |
| Pakistani | 14% | 29% | 27% | 29% |
| Bangladeshi | 15% | 34% | 28% | 24% |
| Chinese | 34% | 39% | 18% | 9% |
| Other | 12% | 19% | 26% | 43% |
Notes and sources: Authors’ calculations using linked data from NPD, ILR and HMRC earnings data. Sample of young people taking GCSEs between 2002 and 2005. All cell sizes greater than 50.
Figure A5: Percentage of learners taking post-16 courses in each earnings group by region
Men:
| Home region at age 16 | High | Middle upper | Middle lower | Low |
|---|---|---|---|---|
| North East | 21% | 24% | 33% | 22% |
| North West | 25% | 23% | 30% | 22% |
| Yorkshire and the Humber | 24% | 23% | 30% | 22% |
| East Midlands | 28% | 22% | 27% | 22% |
| West Midlands | 24% | 24% | 30% | 23% |
| East of England | 29% | 24% | 27% | 20% |
| South East | 29% | 26% | 26% | 19% |
| South West | 27% | 25% | 28% | 20% |
| Inner London | 25% | 24% | 31% | 21% |
| Outer London | 31% | 25% | 27% | 17% |
Women:
| Home region at age 16 | High | Middle upper | Middle lower | Low |
|---|---|---|---|---|
| North East | 17% | 21% | 28% | 34% |
| North West | 20% | 21% | 25% | 33% |
| Yorkshire and the Humber | 21% | 21% | 25% | 33% |
| East Midlands | 25% | 21% | 22% | 32% |
| West Midlands | 21% | 22% | 24% | 32% |
| East of England | 27% | 22% | 22% | 29% |
| South East | 27% | 25% | 21% | 27% |
| South West | 24% | 24% | 22% | 30% |
| Inner London | 28% | 25% | 22% | 25% |
| Outer London | 32% | 26% | 19% | 23% |
Notes and sources: Authors’ calculations using linked data from NPD, ILR and HMRC earnings data. Sample of young people taking GCSEs between 2002 and 2005. All cell sizes greater than 1,000.
Appendix B. Qualitative methodological summary
Fieldwork approach
Sampling
We sought to undertake interviews with learners aged 16 to 18 predominantly undertaking vocational courses, as well as provider staff who influence and understand learners’ course selection choices. The latter includes senior leaders and teachers at a range of providers offering post-16 vocational courses.
We undertook a purposive sampling approach, using the ‘get information about schools’ (GIAS) register and the register of apprenticeship training providers (ROATP). From the databases we selected 50 providers to approach based on 3 strata (type of provider, region and socio- economic learner catchment profile) to provide a wide range of examples to research. It was anticipated that all of the providers would offer a range of high- and low-wage-return courses.
Our initial intention was to recruit 10 providers to participate; however, the implications of the Coronavirus lockdown part-way through our planned fieldwork period limited the number of learning providers able to participate. The achieved sample of 6 providers[footnote 37] is outlined in the Table.
Table B1: Achieved sample of learning providers for qualitative interviews
Type of provider:
- FE college: 4
- ITP: 2
Region:
- London/south-east: 3
- North-west: 1
- South-west: 1
- West Midlands: 1
Socio-economic catchment profile*
- Disadvantaged: 4
- Affluent: 2
Notes and sources: * Based on the Index of Multiple Deprivation (IMD) decile of the provider’s postcode. IMD deciles 1 to 5 were categorised as ‘disadvantaged’ and 6 to 10 as ‘advantaged’. See National Statistics (2019) English indices of deprivation 2019.
We worked with the participating providers to identify a representative sample of learners to interview from a variety of courses. These included: technical and skilled courses with higher value in terms of wage return (for example, engineering, construction, IT); service-related courses of medium/lower value (for example, health, care, beauty, hairdressing); classroom-based courses; apprenticeships; and representation from Levels 1 to 3. We undertook mini-discussion groups with these learners, as well as teaching staff, reflecting the range of subjects offered by the provider and in-depth interviews with senior leaders at the organisations.
Interview recruitment
We approached the lead contact from our sample via email in the first instance to explain the purpose of the study and what their participation would involve. Providers who expressed an interest in the study and were selected to participate then received a briefing paper outlining the study and the expectations for their participation in more detail.
Interviews were conducted with senior leaders, teaching staff and learners. One interview was also undertaken with an employer suggested by a provider, who was able to provide another perspective to the study. The interviews in the majority of cases were conducted face-to-face when researchers undertook field visits to the providers. Where staff or learners were not available on the day, follow-up telephone interviews were conducted.
Discussion guides
Separate interview guides were developed for the respective types of interviewees and designed to address the following:
- the drivers behind learners selecting particular vocational courses
- the types of personal and external factors that influence course selection and drive behaviour change
- the barriers learners face in deciding which courses to pursue
Fieldwork
The fieldwork was undertaken between February and April 2020. It included in-depth face-to- face and telephone interviews of 45 to 60 minutes in length with individuals and groups. Day- long site visits took place with 4 providers. A series of in-depth interviews and mini-focus groups were conducted over the telephone with another provider. Across the 5 providers, mini-group interviews were conducted with a total of 41 learners, 12 senior leaders and 20 teaching staff. Finally, a senior leader of another provider was interviewed by telephone.
Transcription and coding
All interviews were recorded and transcribed. The first 25 transcripts were comprehensively categorised using the theoretical domains framework (TDF) which forms part of Michie, Atkins and West’s (2014) COM-B behavioural framework.[footnote 38] Each remaining transcript was coded using keyword and phrase searches.
Qualitative analysis
The research questions and behavioural change themes of the TDF framework were used to structure the data analysis. The analysis also examined the issues and considerations relevant for the development of subsequent behavioural interventions.
About the Commission
The Social Mobility Commission is an independent advisory non-departmental public body established under the Life Chances Act 2010 as modified by the Welfare Reform and Work Act 2016. It has a duty to assess progress in improving social mobility in the UK and to promote social mobility in England. The Commission board comprises:
Interim Co-Chairs:
- Steven Cooper, Chair of Experian UK and incoming CEO of Aldermore Bank Plc
- Sandra Wallace, Partner and Joint Managing Director at law firm DLA Piper
Commissioners:
- Saeed Atcha MBE, Chief Executive of the charity Youth Leads UK
- Alastair Da Costa, Chair of Capital City College Group
- Pippa Dunn, Co-Founder of Broody, helping entrepreneurs and start ups
- Sam Friedman, Associate Professor in Sociology at the London School of Economics
- Harvey Matthewson, Aviation Activity Officer at Aerobility, a charity for disabled people
- Jessica Oghenegweke, BBC Earth Kids presenter and student at Brunel University
- Farrah Storr, Editor-in-Chief of ELLE UK
- Jody Walker, Director of retail company TJX Europe
- Liz Williams MBE, CEO of FutureDotNow, a coalition focused on accelerating digital skills
- Sammy Wright, Vice-Principal of Southmoor Academy in Sunderland
Authors
This report was written by Rachael Archer, John Higton, Luke Sibieta and Imran Tahir, with contributions from Lindsay Turner Trammell (Social Mobility Commission Secretariat).
Acknowledgements
The authors would like to thank Jack Britton, Héctor Espinoza, Stefan Speckesser, Anna Vignoles and members of our technical advisory group for their invaluable comments and feedback. The National Pupil Database is Crown Copyright and made available by the Department for Education. The Department for Education cannot accept responsibility for any inferences or conclusions derived by third parties from data. Any inferences drawn or errors are the responsibility of the authors.
-
Crawford, C., Meschi, E., Vignoles, A. (2011). Post-16 educational choices and institutional value added at Key Stage 5. CEE DP 124, London: Centre for the Economics of Education (NJ1); Belfield, C., Goll, D., Sibieta, L. (2018). Socio-economic differences in total education spending in England: middle-class welfare no more. Briefing Note, Institute for Fiscal Studies, www.ifs.org.uk/uploads/publications/bns/BN242.pdf; Hupkau, C., McNally, S., Ruiz-Valenzuela, J., Ventura, G. (2017). Post-compulsory education in England: choices and implications. National Institute Economic Review, 240, R42–57, https://doi.org/10.1177%2F002795011724000113. ↩
-
Conlon, G., Patrignani, P., Hedges, S. (2017). The earnings differentials associated with vocational education and training using the Longitudinal Education Outcomes data. Discussion Paper, Centre for Vocational Educational Research, http://cver.lse.ac.uk/textonly/cver/pubs/cverdp007.pdf; Belfield, C., Britton, J., Buscha, F., Dearden, L., Dickson, M., van der Erve, L., Sibieta, L., Vignoles, A., Walker, I., Zhu, Y. (2018). The relative labour market returns to different degrees, Department for Education (DfE), www.ifs.org.uk/publications/13036. ↩
-
Black, S.E., Cortes, K.E., Lincove, J.A. (2015). Academic undermatching of high-achieving minority students: evidence from race-neutral and holistic admissions policies. American Economic Review, 105(5), 604–610; Dillon, E.W. and Smith, J.A. (2017). Determinants of the match between student ability and college quality. Journal of Labor Economics, 35(1), 45–66; Campbell, S., Macmillan, L., Murphy, R., Wyness, G. (2019). Inequalities in student to course match: evidence from Linked Administrative Data. CEP Discussion Papers dp1647, London: Centre for Economic Performance, LSE. ↩
-
Department for Education (2020). Skills for jobs: lifelong learning for opportunity and growth. ↩
-
We have data on a range of characteristics such as gender, ethnicity and special educational needs (SEN) status, as well as information on the type of school pupils attended and their examination results. ↩
-
We have self-employment earnings (from self-assessment records) from 2013/14 onwards and so we only use employment earnings in our main analysis. However, we have repeated our analysis for the years where self- employment earnings are available and have found that our results hold. ↩
-
Not all individuals continue in education after age 16. As a result, our sample size drops by about 120,000 to 150,000 per year when focusing on individuals with matched post-16 education data. Almost all individuals have recorded earnings data, so the sample size does not change very much at this stage. The sample size does, however, drop when excluding individuals with missing data on key variables used in our empirical analysis, especially KS2 attainment records. The right-hand column of Table A2 displays the size of the sample used for analysis. This sample includes only individuals for whom we possess both post-16 and earnings records, and for whom we also do not have missing information on any key variables used in our later analysis. ↩
-
Facilitating subjects are defined as English literature, history, modern languages, classical languages, mathematics, physics, biology, chemistry and geography, which have historically been required by the most prestigious universities. ↩
-
Ofqual (2020). Sector subject areas. ↩
-
Cavaglia, C., Machin, S., McNally, S., Ruiz-Valenzuela, J. (2020). Gender, achievement, and subject choice in English education. CVER Discussion Paper 032, Centre for Vocational Educational Research, https://cver.lse.ac.uk/textonly/cver/pubs/cverdp032.pdf. ↩
-
This is an index calculated by the Ministry of Housing, Communities and Local Government which measures the proportion of children aged between 0 and 15 in a local area who live in income-deprived families; Ministry of Housing, Communities and Local Government (2019). English indices of deprivation 2019. ↩
-
Controls include average capped GCSE points scored; whether the individual achieved 5+ GCSEs or equivalent at A–C; whether they achieved 8+ GCSEs or equivalent at A–B; whether they achieved an A*–C in English and maths; KS2 fine points score in maths and English (plus quadratic terms); ethnic group (minor); plus whether pupils speak English as an additional language (EAL). ↩
-
Appendix Tables B3 and B4 provide the full details and equivalent differences at the later age of 29. ↩
-
Appendix Table A4 shows that similar patterns can be observed for earnings measured at age 29, the main difference being that gender differences are larger at age 29. For example, women in the least deprived group earn 22% less than men in the same group, and women in the most deprived group earn 30% less, after all controls. These larger gender differences are likely to reflect greater difference in hours worked as women become more likely to have young children. ↩
-
Allen, R., Parameshwaran, M., Thomson, D., Education Datalab (2016, December). Social and ethnic inequalities in post-16 choices. Social Mobility Commission. ↩
-
Grade 4 is currently equivalent to a Grade C in the old system. ↩
-
Kim, A., Heather, M., Laura, H., Aisha, A. (2016). Cultural transitions: celebrity and young people’s aspirations. In F. Andy (ed.), Routledge handbook of youth and young adulthood, Abingdon, Oxon: Routledge. ↩
-
‘Parents’ is used as a shorthand in the rest of this report for any adult responsible for the care of a learner. ↩
-
McIntosh, S. (2019). Post-16 aspirations and outcomes: comparison of the LSYPE cohorts. DfE. ↩
-
Crawford, C., Meschi, E., Vignoles, A. (2011). Post-16 educational choices and institutional value added at Key Stage 5. CEE DP 124, London: Centre for the Economics of Education (NJ1). ↩
-
Allen, R., Parameshwaran, M., Thomson, D., Education Datalab (2016, December). Social and ethnic inequalities in post-16 choices. Social Mobility Commission. ↩
-
Battiston, A., Hedges, S., Lazarowicz, T., Speckesser, S. (2020). Peer effects and social influence in post-16 educational choice. CVER Discussion Paper 025, Centre for Vocational Educational Research. https://cver.lse.ac.uk/textonly/cver/pubs/cverdp025.pdf. ↩
-
As a reminder, ‘parents’ refers to biological parents, guardians or any adult with responsibility for a learner. ↩
-
Wright, S. (2005). Young people’s decision-making in 14–19 education and training: a review of the literature. The Nuffield Review of 14–19 Education and Training, London: Nuffield Foundation. ↩
-
Mann, A., Kashefpakdel, E. T., Rehill, J., Huddleston, P. (2017). Contemporary transitions: young Britons reflect on life after secondary school and college. London: Education and Employers. ↩
-
Donovan, C. (2019). Distrust by design? Conceptualising the role of trust and distrust in the development of further education policy and practice in England. Research in Post-Compulsory Education, 24(2–3), 185–207, https://doi.org/10.1080/13596748.2019.1596414; Wolf, A. (2011, March). Review of vocational education: The Wolf Report. Department for Business Innovation and Skills and DfE, www.gov.uk/government/publications/review-of- vocational-education-the-wolf-report. ↩
-
Economic Affairs Committee (2018). Treating students fairly: the economics of post-school education. 2nd Report of Session 2017–19, London: The Authority of the House of Lords; Hupkau, C., McNally, S., Ruiz- Valenzuela, J., Ventura, G. (2016). Post-compulsory education in England: choices and Implications. London: Centre for Vocational Educational Research. ↩
-
Michie, S., Atkins, L., West, R. (2014). The behaviour change wheel: a guide to designing interventions. Sutton, Surrey: Silverback Publishing. ↩
-
COM-B has 14 domains. However, we have adapted these slightly for the purpose of this study. Two domains are not referenced: ‘Behavioural regulation’ and ‘Intention’. In this instance, both of these are covered by ‘Memory/decision-making processes’. ↩
-
Turner, J.C., Oakes, P.J., Haslam, S.A., McGarty, C. (1994). Self and collective: cognition and social context. Personality and Social Psychology Bulletin, 20, 454–463. ↩
-
Kim, A., Heather, M., Laura, H., Aisha, A. (2016). Cultural transitions: celebrity and young people’s aspirations. In F. Andy (ed.), Routledge handbook of youth and young adulthood. Abingdon, Oxon: Routledge. ↩
-
Cassidy, R., Cattan, S., Crawford, C., Dytham, SD. (2018). How can we increase girls’ uptake of maths and physics A-level? Institute for Fiscal Studies. ↩
-
Sundorph, E. (2021). Missing elements: why ‘STEMinism’ matters in the classroom and beyond. Teach First. ↩
-
McNally, S. (2020). Gender differences in tertiary education: what explains STEM participation? CEP Discussion Paper, Centre for Economic Performance, LSE. ↩
-
Buchmann, C. and Park, H. (2009). Stratification and the formation of expectations in highly differentiated educational systems. Research in Social Stratification and Mobility, 27(4), 245–267; Parker, P.D., Jerrim, J., Schoon, I., Marsh, H.W. (2016). A multination study of socioeconomic inequality in expectations for progression to higher education: the role of between-school tracking and ability stratification. American Educational Research Journal, 53(1), 6–32. ↩
-
Department for Education (2020). Skills for jobs: lifelong learning for opportunity and growth. ↩
-
One of the providers was only able to offer a telephone interview with a senior leader rather than a day-long visit to interview staff and learners due to the timing of the Coronavirus lockdown. ↩
-
Michie, S., Atkins, L., West, R. (2014). The behaviour change wheel: a guide to designing interventions. Sutton, Surrey: Silverback Publishing. ↩