The People and Nature Survey for England: Monthly interim indicators for April 2020 (Experimental Statistics)
Published 9 June 2020
Applies to England

© Crown copyright 2020
This publication is licensed under the terms of the Open Government Licence v3.0 except where otherwise stated. To view this licence, visit nationalarchives.gov.uk/doc/open-government-licence/version/3 or write to the Information Policy Team, The National Archives, Kew, London TW9 4DU, or email: psi@nationalarchives.gov.uk.
Where we have identified any third party copyright information you will need to obtain permission from the copyright holders concerned.
This publication is available at https://www.gov.uk/government/statistics/the-people-and-nature-survey-for-england-monthly-interim-indicators-for-april-2020-experimental-statistics/the-people-and-nature-survey-for-england-monthly-interim-indicators-for-april-2020-experimental-statistics
1. Other pages in this release
The People and Nature Survey for England is one of the main sources of data and statistics on how people experience and think about the environment. It began collecting data via an online panel in April 2020, and runs continuously, in line with Government Statistical Service guidance on data collection during the COVID-19 crisis. The People and Nature Survey will tell us about how COVID-19 is impacting people’s experience of green and natural spaces, how this is associated with physical and mental health, as well as how people’s attitudes to nature and behaviours are changing at this time (full questionnaire available for download). Data and insights from the People and Nature Survey will provide important evidence on impacts to support response and recovery, both under current restrictions and as requirements to stay at home ease.
The People and Nature Survey defines public green and natural spaces as including:
- green spaces in towns and cities (e.g. parks, canals);
- the countryside (e.g. farmland, woodland, hills and rivers);
- the coast (e.g. beaches, cliffs) and activities in the open sea;
- visits of any duration (including short trips to the park, dog walking etc.)
- they do not include: private gardens; outside places visited as part of someone’s employment; spaces outside the UK.
Additional questions are asked about private gardens.
The People and Nature Survey builds on and replaces the Monitor of Engagement with the Natural Environment (MENE) survey that ran from 2009 to 2019 and was designated as a National Statistic. While the People and Nature Survey has similar objectives to MENE, the move to an online panel method for data collection is a noteworthy change in methodology (MENE used face-to-face methods).
2. Main Points
- During the period 2nd–30th April, nearly half of adults (49%) in England said that they had spent time outside in green and natural spaces in the previous two weeks. A further 46% reported that they had not spent time in these places.
- Urban green spaces, such as parks and playing fields, were the most visited type of green and natural space (41% of adults reported visiting these places in the last month).
- A quarter of adults (26%) reported that they had not visited any green and natural space in the previous month.
- The large majority of adults (86%) with access to a private garden or allotment feel that this access is important to them (59% stating that it is very important).
- Most people (61%) agree that they feel like they are ‘part of nature’.
- The vast majority of adults (87%) agreed that ‘being in nature makes me happy’.
Data for this survey were collected after the lockdown came into effect on 23rd March 2020 (which required everyone to stay at home apart from a limited number of reasons) and before the announced changes to lockdown rules on 10 May 2020. This page summarises the latest advice on accessing greenspace safely.
This is the first release of interim indicators; subsequent releases will track the changing impact of Covid-19.
3. Experimental Statistics
Given the new and experimental methods used in the People and Nature Survey, all initial releases will be as Experimental Statistics. The Experimental Statistics label highlights to users that the statistics are in the testing phase and that Natural England is still working on further developing the methodologies used in their production.
Natural England have worked to ensure adherence to the Code of Practice throughout all stages of the People and Nature Survey, including in the production of these interim indicators. Further detail on methods used and data quality is available in the Methodological notes and Strength and Limitations sections of this release, respectively.
We seek feedback from stakeholders on the interpretation and presentation of the indicators and make adjustments as appropriate and where possible.
The Office for Statistics Regulation, on behalf of the UK Statistics Authority, has reviewed these monthly interim indicators against several key aspects of the Code of Practice for Statistics and regards them as consistent with the Code’s pillars of Trustworthiness, Quality and Value.
The Experimental Statistics in this publication are based on a survey of 2,083 adult respondents conducted online between April 2nd-30th 2020 (inclusive). Throughout this bulletin, “this month” and “April” refers to this period. All results are presented alongside the relevant 95% confidence interval (see Glossary for full definition).
These interim indicators have been generated quickly, using interim and experimental methods for the purpose of understanding potential impacts of COVID-19 on how people are using the natural environment in England. There are therefore considered to be Experimental Statistics and there are quality limitations that should be noted:
-
There will likely be differences between these monthly interim indicators and full People and Nature Survey results due to the differences in weighting approaches (see Section 11). Interim weights have been generated for these indicators using weighting solutions developed for the Monitor of Engagement with the Natural Environment (MENE). This approach is appropriate given the large similarities between MENE and the People and Nature Survey, and the significant amount of MENE data which supports the selection of key variables used to develop the MENE weights. These have been applied at aggregate level for each monthly interim indicator. New bespoke weights will be generated for the People and Nature Survey before statistics are finalised. Natural England will be releasing a weighted respondent dataset for the People and Nature Survey as Experimental Statistics on a quarterly basis, starting in September 2020.
-
Although other data sources are referred to in order to provide context in this release, direct comparisons between the People and Nature Survey and MENE should not be made due to methodological differences between these two surveys.
-
These Experimental Statistics will be continued to be developed over the first year of the People and Nature Survey, with a view to ultimately securing National Statistic designation. We welcome all feedback from users to aid this development by email to: people_and_nature@naturalengland.org.uk
4. Time spent in green and natural places
Survey respondents were asked how many times, if at all, they visited green and natural spaces in the last 14 days.
In April, nearly half of adults (49%) reported taking a visit to a green and natural space in the last 14 days. Forty six percent reported that they had not spent time in these places over the previous two weeks.
Additional analysis shows that 41% of adults visited such a space in the previous 7 days.
Given the nature of the question, some respondents will be reporting on activity undertaken before government restrictions were put in place.
This is broadly consistent with historical MENE data for April. It is important to note that MENE is not directly comparable to People and Nature because MENE uses different survey methods and it is unclear whether differences observed are due to changes in the population or changes in survey methods. Any use of MENE data for context should be with caution and understanding of the limitations (see section 12). Analysis of MENE data for visits in April 2018 shows that 49% adults spent time in green and natural spaces in a seven day period.
Table 1: Proportion of adults in England (weighted percentage) making visits to green and natural spaces in the last 14 days.
| Visit behaviour | Percentage | Confidence interval |
|---|---|---|
| Any visits | 48.5 | 2.4 |
| No visits | 45.9 | 2.4 |
| Don’t know | 5.0 | 1.0 |
| Prefer not to say | 0.6 | 0.4 |
Table notes:
Source: The People and Nature Survey: how many times, if at all, did you make this type of visit to green and natural spaces?
(1) Data collected in the period April 2nd to 30th (inclusive).
(2) The sample for this question was 1,868 respondents.
(3) Error bars represent the 95% confidence interval of the mean (see Glossary).
5. Types of green and natural spaces visited
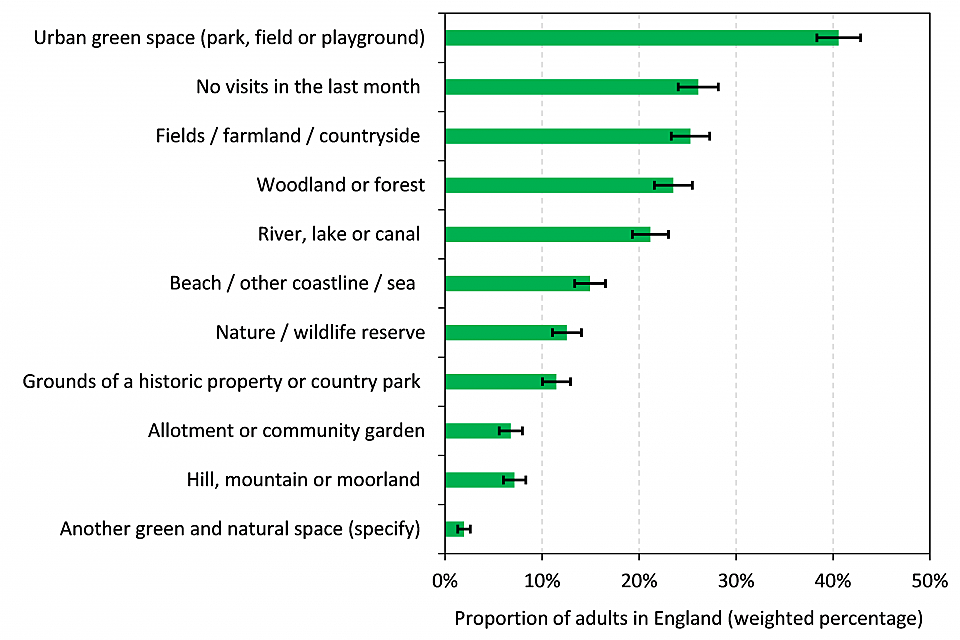
Survey respondents were asked about all of the types of green and natural spaces they had visited during the last month. Urban green space (such as a park, field or playground) was the most visited type of space (41% respondents reported making a visit in the last month). ‘Fields, farmland and countryside’ were also popular (with 25% adults visiting in the previous month), as were ‘woodland and forests’ (24% adults visiting) and ‘rivers, lakes and canals’ (21%).
A quarter (26%) of respondents reported no visits to any green and natural space in the last month.
Given the nature of the question, some respondents will be reporting on activity undertaken before government restrictions were put in place.
Previous research from the MENE survey found that urban green spaces are usually the most visited of any green and natural space in 2018/19.[footnote 1]
Other sources have suggested that the COVID-19 restrictions have limited time spent outside for sections of population. For example, Natural England analysis for this report, of the Google COVID-19 Community Mobility data[footnote 2] found that, on average, park usage in England declined by 16% during 1st-30th April compared to Google’s baseline (3 January to 6 February 2020).
Table 2: Proportion of adults in England (weighted percentage) taking visits to different green and natural spaces in the last month.
| Types of place visited | Percentage | Confidence interval |
|---|---|---|
| Urban greenspace (such as a park, field or playground) | 40.6 | 2.3 |
| No visits in the last month | 26.1 | 2.1 |
| Fields / farmland / countryside | 25.3 | 2.0 |
| Woodland / forest | 23.5 | 1.9 |
| River / lake / canal | 21.2 | 1.9 |
| Beach / other coastline / sea | 14.9 | 1.6 |
| Nature / wildlife reserve | 12.6 | 1.5 |
| Grounds of a historic property or country park | 11.5 | 1.4 |
| Allotment or community garden | 6.8 | 1.2 |
| Hill / mountain / moorland | 7.2 | 1.2 |
| Another green and natural space | 2.0 | 0.6 |
| Don’t know | 0.1 | 0.2 |
Table notes
Source: The People and Nature Survey: which of the following type(s) of green and natural spaces have you visited during the last month?
(1) Data collected in the period April 2nd to 30th (inclusive).
(2) The sample for this question was 2,017 respondents.
(3) Error bars represent the 95% confidence interval of the mean (see Glossary).
The New Economics Foundation (NEF)[footnote 3] estimated that there were 8 million fewer visits to parks and greenspaces across the United Kingdom than would usually be expected, when compared with the 2018 April average. Further analysis by NEF using the Google COVID-19 Community Mobility dataset found different trends in use of parks or public green spaces between poorer and richer local authorities. Where data was available, they found that the poorest twenty local authorities reported an average 28% reduction in the use of parks compared with the 2018 April average, meanwhile the wealthiest twenty local authorities reported no change in park use.
Subsequent reporting of monthly interim indicators and quarterly results from the People and Nature Survey respondent dataset will be able to determine changes and trends in the types of green and natural space and equality of access as the COVID-19 restrictions change over time.
Figure 1: Proportion of adults in England (weighted percentage) visiting different types of green and natural spaces within the last month. Urban green space was the most visited type of space, followed by visits to fields / farmland / countryside. A quarter of respondents reported no visits at all.
Types of green and natural spaces visited.
Figure notes
Source: The People and Nature Survey: which of the following type(s) of green and natural spaces have you visited during the last month?
(1) April refers to the period April 2nd to 30th (inclusive).
(2) The sample for this question was 2,017 respondents.
(3) Error bars represent the 95% confidence interval of the mean (see Glossary).
6. Attitudes towards green and natural spaces
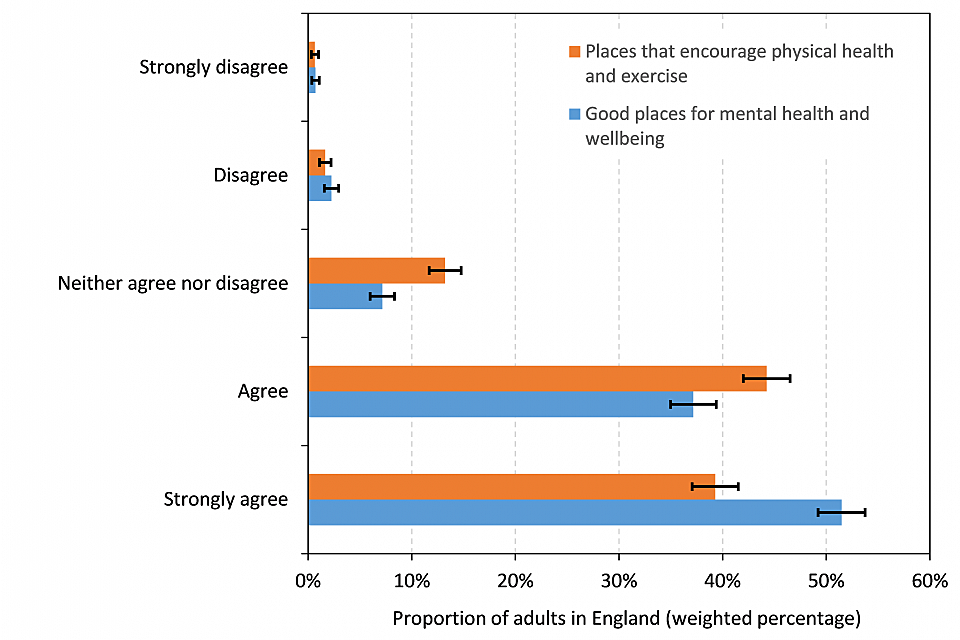
Respondents were asked: How much do you agree or disagree with the following statements: - In general, green and natural spaces should be good places for mental health and wellbeing.
- In general, green and natural spaces should be places that encourage physical health and exercise.
The large majority of adults (89%) agreed or strongly agreed that green and natural spaces should be good places for mental health and wellbeing. Notably, half of adults (51%) strongly agreed. Only 3% disagreed or strongly disagreed with the statement.
Eighty four percent of adults agreed that green and natural spaces should be places that encourage physical health and exercise (with 39% strongly agreeing). Only 2% disagreed or strongly disagreed with the statement.
These findings are broadly consistent with other surveys. For example a Sport England survey[footnote 4] found that almost two thirds of adults considered exercise to be more important than ever during the current coronavirus (COVID-19) crisis, and; a survey conducted for the Academy of Medical Sciences[footnote 5] found that ‘appreciating nature’ or ‘getting outside’ were reported as popular activities used to support people’s mental wellbeing during the pandemic.
Table 3: Proportion of adults in England (weighted percentage) attitudes to natural spaces.
| Attitudes towards greenspaces | Strongly agree percentage (confidence interval) | Agree percentage (confidence interval) | Neither agree nor disagree percentage (confidence interval) | Disagree percentage (confidence interval) | Strongly disagree percentage (confidence interval) |
|---|---|---|---|---|---|
| Good places for mental health and wellbeing | 51.4 (2.3) | 37.2 (2.2) | 7.2 (1.2) | 2.3 (0.7) | 0.7 (0.4) |
| Places that encourage physical health and exercise | 39.3 (2.2) | 44.2 (2.3) | 13.2 (1.5) | 1.7 (0.6) | 0.6 (0.3) |
Table notes
Source: The People and Nature Survey: How much do you agree or disagree with the following statements relating to green and natural spaces generally?
(1) Data collected in the period April 2nd to 30th (inclusive).
(2) The sample for this question was 2,083 respondents.
(3) Error bars represent the 95% confidence interval of the mean (see Glossary).
Figure 2: Proportion of adults in England (weighted percentage) that agree with the statements: “In general, green and natural spaces should be good places for mental health and wellbeing” and “In general, green and natural spaces should be places that encourage physical health and exercise”. The large majority of respondents either agreed or strongly agreed that green spaces encourage physical activity and are good for mental health and wellbeing.
Attitudes towards green and natural spaces.
Figure notes
Source: The People and Nature Survey: How much do you agree or disagree with the following statements relating to green and natural spaces generally?
(1) Data collected in the period April 2nd to 30th (inclusive).
(2) The sample for this question was 2,083 respondents.
(3) Error bars represent the 95% confidence interval of the mean (see Glossary).
7. Frequency of time spent outdoors - Adults
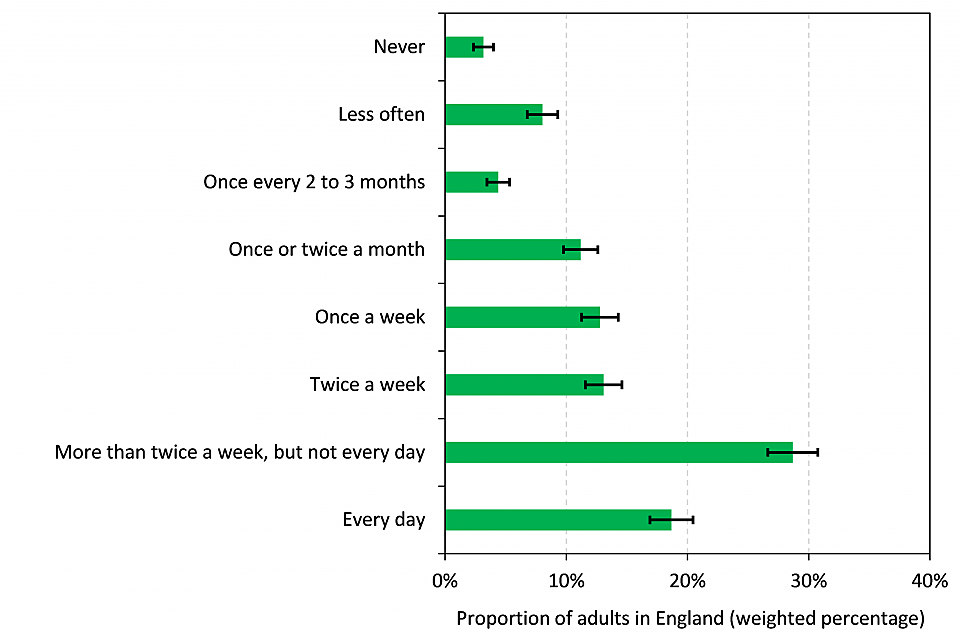
Respondents were asked: In the last 12 months, how often, on average have you spent free time outside in green and natural spaces?
Seventy three percent of adults reported that they normally spent time in green and natural spaces at least once a week.
This is broadly consistent with the MENE finding that in 2018/19 the majority of people spent time in green and natural spaces on average at least once a week over the 12 month period[footnote 1].
For insight into COVID-19 effects on people’s visits to green and natural spaces see Section 4 for visit rates over the last 14 and 7 days, which is more representative of behaviour under government restrictions. Note that a smaller proportion of adults spent time outside in April this year (41% at least once in the last week) than their reported average over 12 months (73% at least once a week), which suggests that COVID-19 restrictions are having an impact on these behaviours.
Table 4: Proportion of adults in England (weighted percentage): Frequency of time spent outdoors in the last 12 months.
| Frequency | Percentage | Confidence interval |
|---|---|---|
| Every day | 18.7 | 1.8 |
| More than twice a week but not every day | 28.7 | 2.1 |
| Twice a week | 13.1 | 1.5 |
| Once a week | 12.8 | 1.5 |
| Once or twice a month | 11.2 | 1.4 |
| Once every 2 to 3 months | 4.4 | 0.9 |
| Less often | 8.0 | 1.3 |
| Never | 3.2 | 0.8 |
Table notes
Source: The People and Nature Survey: In the last 12 months, how often, on average have you spent free time outside in green and natural spaces?
(1) Data collected in the period April 2nd to 30th (inclusive).
(2) The sample for this question was 2,083 respondents.
(3) Error bars represent the 95% confidence interval of the mean (see Glossary).
Figure 3: Proportion of adults in England (weighted percentage) frequency of visits to outdoor green and natural spaces in the last 12 months. Three quarters of the respondents said they visited a greenspace at least once a week when thinking about the last 12 months.
Frequency of time spent outdoors - Adults.
Figure notes
Source: The People and Nature Survey: In the last 12 months, how often, on average have you spent free time outside in green and natural spaces?
(1) Data collected in the period April 2nd to 30th (inclusive).
(2) The sample for this question was 2,083 respondents.
(3) Error bars represent the 95% confidence interval of the mean (see Glossary).
8. Frequency of time spent outdoors - Children
Respondents were asked whether they have children under the age of 16 living in their household. If they answered ‘yes’ follow-up questions recorded number of children, their age and gender. The adult is then asked questions about a randomly selected child from their household, including: In the last 12 months, how often, on average, has this child spent free time outside in green and natural spaces?
Note that the sample size for this question was small (287 adults) and so results should be treated with caution.
Adult respondents reported that, on average over the past 12 months, 82% of children spent time in green and natural spaces at least once a week. Eleven percent of children were reported as visiting green and natural space less than once a month or never.
Subsequent reporting of results from the People and Nature Survey will be able to track the impact of changing COVID-19 restrictions on time spent by children in green and natural spaces.
Table 5: Proportion of children in England (weighted percentage): Frequency of time spent outdoors in the last 12 months.
| Frequency | Percentage | Confidence interval |
|---|---|---|
| Every day | 19.5 | 4.7 |
| More than twice a week but not every day | 28.1 | 5.2 |
| Twice a week | 17.3 | 4.5 |
| Once a week | 17.0 | 4.4 |
| Once or twice a month | 6.7 | 2.9 |
| Once every 2 to 3 months | 3.4 | 2.2 |
| Less often | 5.6 | 2.8 |
| Never | 2.1 | 1.9 |
Table notes
Source: The People and Nature Survey: In the last 12 months, how often, on average has this child spent free time outside in green and natural spaces?
(1) Data collected in the period April 2nd to 30th (inclusive).
(2) The sample for this question was 287 respondents.
(3) Error bars represent the 95% confidence interval of the mean (see Glossary).
9. Importance of having access to a garden or allotment
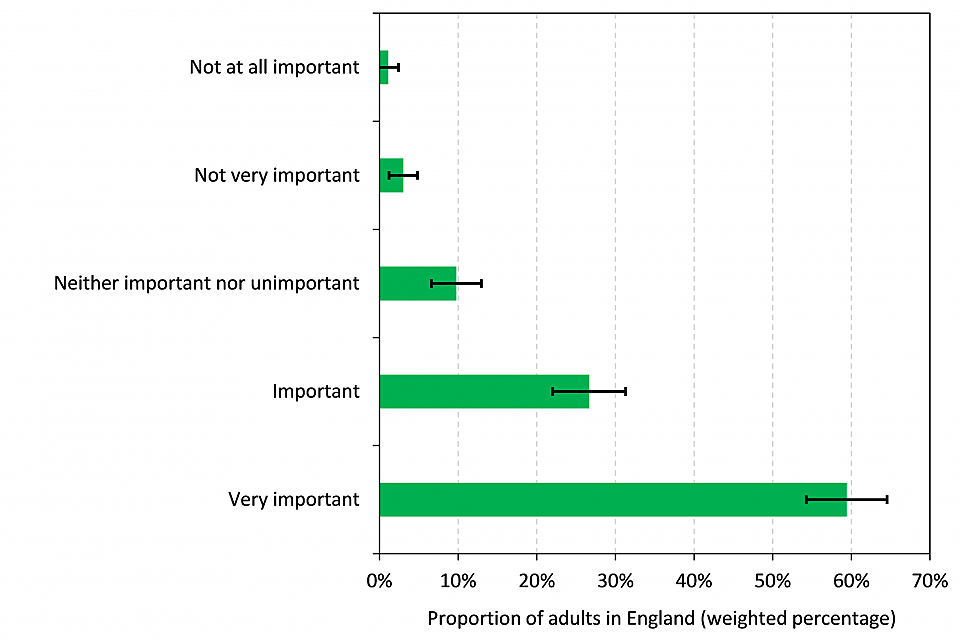
Of those respondents who said that they had access to a private or shared garden, outdoor space or allotment 86% agreed that having access to a garden or allotment is important to them personally (with 59% agreeing it is very important). Only 4% stated it was not important to have access.
This seems a higher proportion than measured via MENE in 2018[footnote 6] although it is important to note that this is not directly comparable to People and Nature because MENE uses different methods and it is unclear whether the difference is due to changes in the population or changes in survey methods. Any use of MENE data for context should be with caution and understanding of the limitations (see section 12).
Subsequent reporting of results from the People and Nature Survey will be able to determine if the importance of gardens is changing as COVID-19 restrictions change.
The majority of people with access to a garden rate having this access as important. Yet not all the population does have access: the Office for National Statistics[footnote 7] found that one in eight households (12%) in Great Britain had no access to a private or shared garden during the coronavirus (COVID-19) restrictions and there was inequality in access to garden spaces. Analysis of the MENE data by the Office for National Statistics[footnote 8] found that (controlling for age, urban or rural, region, social grade and whether the household had children) people of all ethnic minority groups were less likely to have a garden than those of White ethnicity, with those of Black ethnicity being least likely to have access to a garden. Black people were nearly four times as likely as White people to have no access to outdoor space at home, whether it be a private or shared garden, a patio or a balcony (37% compared with 10%).
Table 6: Proportion of adults in England (weighted percentage): Importance of having access to a garden or allotment
| Importance | Percentage | Confidence interval |
|---|---|---|
| Very important | 59.4 | 5.1 |
| Important | 26.7 | 4.6 |
| Neither important nor unimportant | 9.8 | 3.2 |
| Not very important | 3.0 | 1.8 |
| Not at all important | 1.1 | 1.3 |
Table notes
Source: The People and Nature Survey: How important is having access to a garden or allotment to you personally?
(1) Data collected in the period April 2nd to 30th (inclusive).
(2) The sample for this question was 391 respondents.
(3) Error bars represent the 95% confidence interval of the mean (see Glossary).
Figure 4: Proportion of adults in England (weighted percentage) responses to the following question: “How important is having access to a garden or allotment to you personally?” Only asked of those with access to a private or shared garden, other private outdoor space, or allotment. Over 80% of respondents believed that have a garden or allotment is either important or very important to them personally.
Importance of having access to a garden or allotment.
Figure notes
Source: The People and Nature Survey: How important is having access to a garden or allotment to you personally?
(1) Data collected in the period April 2nd to 30th (inclusive).
(2) The sample for this question was 391 respondents.
(3) Error bars represent the 95% confidence interval of the mean (see Glossary).
10. Feelings of nature connection
Nature connectedness describes a person’s relationship with the natural world and how it makes them feel (see Glossary for full definition). The Nature Connectedness Index Score is derived by measuring participants’ responses to six statements (see Glossary). For this report respondents were asked how much they agree or disagree with two of these statements:
- I feel part of nature
- Being in nature makes me very happy.
These two statements were chosen as they are the strongest predictors of people’s Nature Connectedness Index Score as detailed in Natural England’s Nature Connectedness Report.
Sixty one percent of adults agreed that they felt part of nature (with 28% strongly or completely agreeing). Only 11% disagreed with the statement.
Eighty seven percent of adults agreed that they felt very happy when in nature (with 48% strongly or completely agreeing). Only 3% disagreed with the statement.
Subsequent reporting of monthly interim indicators and quarterly results from the People and Nature Survey respondent dataset will be able to determine if feelings of nature connection are changing during this time.
Table 7: Proportion of adults in England (weighted percentage) agreement levels with feeling connected with nature.
| Connection with nature | Completely agree percentage (confidence interval) | Strongly agree percentage (confidence interval) | Agree percentage (confidence interval) | Neither agree nor disagree percentage (confidence interval) | Disagree percentage (confidence interval) | Strongly disagree percentage (confidence interval) | Completely disagree percentage (confidence interval) | Don’t know percentage (confidence interval) |
|---|---|---|---|---|---|---|---|---|
| I feel part of nature | 11.8 (3.4) | 16.1 (4.0) | 33.1 (4.8) | 27.1 (4.8) | 9.7 (3.0) | 0.9 (1.0) | 0.8 (1.0) | 0.6 (1.1) |
| Being in nature makes me very happy | 22.4 (4.3) | 25.9 (4.6) | 38.9 (5.1) | 9.3 (3.3) | 2.7 (1.6) | 0.5 (1.0) | 0.2 (0.8) | 0 |
Table notes
Source: The People and Nature Survey: How much do you agree or disagree with the following?
(1) Data collected in the period April 2nd to 30th (inclusive).
(2) The sample for this question was 403 respondents.
(3) Error bars represent the 95% confidence interval of the mean (see Glossary).
Figure 5: Proportion of adults in England (weighted percentage) agreement with the following statements: “Being in nature makes me very happy” and “I feel part of nature”. Over 80% and 60% of respondents either agreed, strongly agreed or completely agreed with these statements respectively.
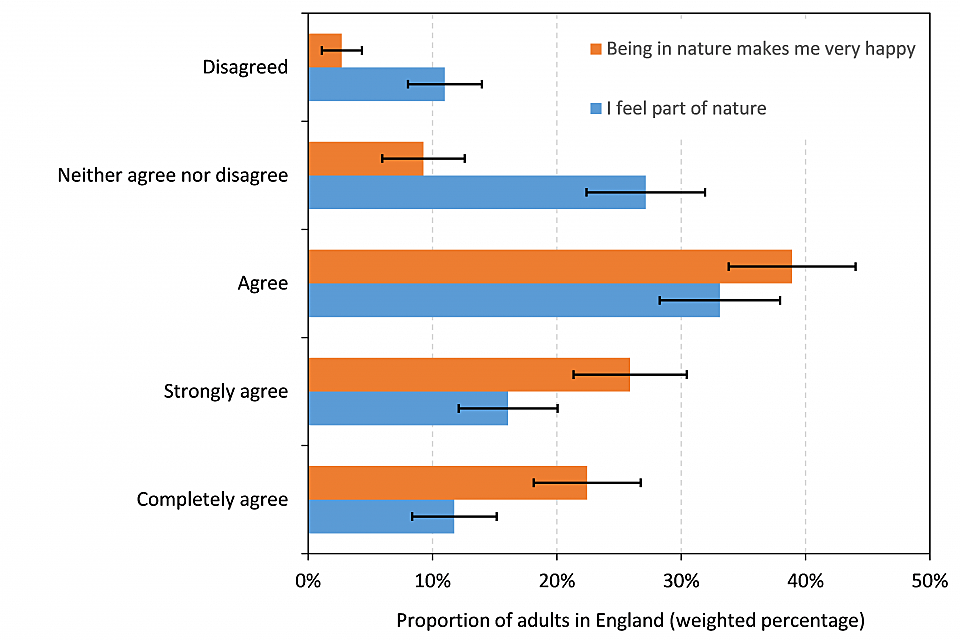
Feelings of connection with nature
Figure notes
Source: The People and Nature Survey: How much do you agree or disagree with the following?
(1) Disagreed category includes ‘completely disagree’, ‘strongly disagree’ and ‘disagree’.
(2) Data collected in the period April 2nd to 30th (inclusive).
(3) The sample for this question was 403 respondents.
(4) Error bars represent the 95% confidence interval of the mean (see Glossary).
11. Methodological notes
The People and Nature Survey for England gathers evidence and trend data through an online survey relating to people’s enjoyment, access, understanding of and attitudes to the natural environment, and its contributions to wellbeing.
People and Nature is an online panel survey (self-completion questionnaire), sampling up to 25,000 adults in England on a continuous basis over 2020/2021. The survey launched in April 2020 and builds on the Monitor of Engagement with the Natural Environment (MENE) survey that ran from 2009 to 2019.
The People and Nature Survey consists of different modules. All modules are asked throughout the entire year, but certain modules (those that do not require an overall sample size of 25,000) are only asked of a randomly selected sub-sample of individuals. This means that some questions will have responses from everyone asked and some will have a smaller sample size.
The People and Nature Survey will release a full dataset on a quarterly basis, with the first data release scheduled for September 2020. Data from the People and Nature Survey will initially be released as ‘Experimental Statistics’, a form of Official Statistics that are in the testing phase. In response to the coronavirus (COVID-19) pandemic, we have provided an early release of some indicative metrics using data from a subset of the survey questions. This early release will enable us, in a timely manner, to better understand the impacts and implications of COVID-19 on people’s engagement with nature, health and wellbeing, and will inform plans for recovery.
11.1 Sampling
A sample of households were selected from the England subset of Kantar’s Lightspeed Panel. Samples are representative of the target population (adults aged 16+ living in England) and quotas for age, gender, region, education and ethnicity are in place to ensure key population groups are adequately represented.
For this first release 2,083 individuals were sampled for the survey conducted from 2nd April to 30th April 2020. Not all questions were asked of all 2,083 individuals and sample sizes are indicated in each report section.
11.2 Weighting
These early release indicators are interim and they (and subsequently these figures) may be subject to change once the final weighting solutions for the People and Nature Survey have been developed[footnote 9].
The weighting used for the monthly interim indicators will be representative of the English adult population, according to the latest population estimate data available from the Office for National Statistics and based on the weighting developed for the MENE survey data[footnote 10]. Weights have been checked to ensure that they scale to the sample size for each indicator. For indicators where respondents are only able to select one response option, proportions have been checked to ensure they add up to 100%. Associated 95% confidence intervals are also reported (see Glossary).
12. Strengths and limitations
12.1 Experimental Statistics collected via an online panel
The People and Nature Survey is conducted by Kantar using its online Lightspeed panel. The online panel brings benefits in terms of speed, ability to interview during lockdown and reducing social desirability bias. However, it is important to flag limitations:
- Since panels are opt-in there is the risk that panellists are not representative of the general population.
- Online panel surveys exclude the off-line population.
To minimise the risk of bias, Lightspeed uses a variety of recruitment methods. This includes opt-in email, e-newsletter campaigns, and social media. Sample composition analysis during development of these statistics compared online panel methods and MENE. It showed that the online samples tend to be more representative than MENE in terms of age and working status. However, online samples tend not to represent the very oldest in the population well (as they are the least likely to have internet access). Both the online panel and MENE tend to achieve samples that are broadly representative of the population by region. Online samples tend to under-represent people from ethnic minority backgrounds, which is why an additional quota criteria on ethnicity was set for the People and Nature Survey. The survey was developed specifically to ensure it worked well on mobile devices. Quota objectives to achieve a nationally representative sample in terms of age, gender, region, ethnicity, and education level were achieved for the April sample (at least 95% of the target). Work is continuing to understand strengths and limitations of the panel method during the experimental phase and further information will be published in due course.
12.2 Comparing the monthly interim indicators with other data
Where appropriate, these interim monthly indicators have been compared against other data sources and we report where similar trends have been identified.
Although similar types of data are reported, direct comparisons of the People and Nature Survey and MENE findings should not be made. The People and Nature Survey has similar aims and many similar questions to MENE, however, it is important to note significant differences in methods could have an impact on results. The People and Nature Survey uses an online panel approach whereas MENE used face-to-face interviews; there are differences in how respondents answer questions between these two different survey methods. Furthermore, for many questions, there have been other changes including question recall period and question length, plus new questions have been added to The People and Nature Survey.
Natural England are exploring an approach to calibrate a small number of key metrics from the People and Nature Survey and MENE. This approach aims to harmonise these metrics before and after the change in survey approach.
We have decided the best approach for calibration is ‘backward’ harmonisation. This will mean some historical MENE metrics will change (i.e. a new calibration factor will be applied to some metrics calculated from historic MENE data to allow for a degree of continuity between MENE and the new People and Nature Survey).
To harmonise any metrics between the People and Nature Survey and MENE, a parallel run will take place where online and face-to-face interview approaches are conducted at the same time. Due to current COVID-19 restrictions, the feasibility of harmonising certain metrics between the People and Nature Survey and MENE will be unknown until face-to-face interviews can be safely conducted over a sufficient amount of time (ca. 1 year).
12.3 Socio-demographic characteristics
Results from MENE indicated that there was inequality of environmental engagement between population sub-groups defined by a number of demographic characteristics (including: age, ethnicity, and socio-economic background, region, urban-rural and health).
The People and Nature survey launched in April 2020 and has been designed to report findings by socio-demographic characteristics. This is planned for the first quarterly release in September 2020. Reporting on a quarterly basis (rather than monthly) ensures larger sample sizes are reported against each question, thereby reducing standard errors.
13. Glossary
95% confidence interval is a range of values around a calculated statistic (e.g. the mean) that you are 95% certain contains the true value of that statistic. For example, where there is a mean value of 49 with a 95% confidence interval of 2, we would be 95% certain that the true mean of the population was in the range of 47-51 (i.e. 49 -2 and 49 + 2).
Green and natural spaces are defined in this survey as green spaces in towns and cities (e.g. parks, canals); the countryside (e.g. farmland, woodland, hills and rivers); the coast (e.g. beaches, cliffs) and activities in the open sea; visits of any duration (including short trips to the park, dog walking etc). They do not include: gardens; outside spaces visited as part of someone’s employment; spaces outside the UK.
Nature connectedness: a measurable psychological construct that describes a person’s relationship with the natural world. It includes aspects related to a person’s affective (emotional) and cognitive relationship to nature and their sense of place in nature. The 6 Nature Connection Index scale items are:
- I always find beauty in nature
- I always treat nature with respect
- Being in nature makes me very happy
- Spending time in nature is very important to me
- I find being in nature really amazing
- I feel part of nature
Weighting: this process corrects for both proportion and scale – i.e. it adjusts the results to reflect both the underlying characteristics and the size of the target population. Thereby ensuring that the results are representative of the target population.
14. Contact
Natural England welcomes feedback on these monthly indicators, questions and suggestions for analysis for future releases. Please contact the team by email: people_and_nature@naturalengland.org.uk
The Senior Responsible Officer for this publication is Dr Rose O’Neill.
15. Pre-release access
This monthly release of interim indicators is Experimental Official Statistics, produced in accordance with the Code of Practice for Statistics and its key principles of Trustworthiness, Quality and Value.
Pre-release access was granted allowing a limited number of ‘eligible people’ access for a strict 24 hour period before the statistics were published. The pre-release access list for these April monthly indicators comprises the following:
- Natural England Chief Executive
- Natural England Chief Scientist
- Natural England Head of the People and Nature Programme
- Natural England Stakeholder & Communication Lead for the People and Nature Programme
- Senior Press Officer for Natural England
- Defra Press Officer for Natural England
16. Related links
Coronavirus – guidance on accessing green spaces safely: Latest government guidance on using green spaces and protecting yourself and others.
Natural England operational update: Coronovirus information on how Natural England is facing the challenges posed by Coronavirus.
People and Nature questionnaire: Includes link to People and Nature Survey questions.
People and Nature Survey information: Further information on the People and Nature Survey for England.
Monitor of Engagement with the Natural Environment: Further information on the Monitor of Engagement with the Natural Environment (MENE) Survey (predecessor to the People and Nature Survey).
Office for National Statistics analysis of access to greenspace during coronavirus: Office for National Statistics report on access to greenspace, including gardens, during coronavirus (uses MENE data).
A summary report on nature connectedness among adults and children in England: Includes analyses of relationships with wellbeing and pro-environmental behaviours (uses MENE data).
Coronavirus (COVID-19): safer public places - urban centres and green spaces: Guidance for the owners and operators of urban centres and green spaces to help social distancing.
The Countryside Code: Statutory guidance on respecting, protecting and enjoying the outdoors.
-
https://www.gov.uk/government/statistics/monitor-of-engagement-with-the-natural-environment-headline-report-and-technical-reports-2018-to-2019 ↩ ↩2
-
https://www.sportengland.org/news/new-exercise-habits-forming-during-coronavirus-crisis ↩
-
https://www.ipsos.com/ipsos-mori/en-uk/Covid-19-and-mental-wellbeing ↩
-
https://assets.publishing.service.gov.uk/government/uploads/system/uploads/attachment_data/file/738891/Monitorof_Engagementwiththe_Natural_Environment_Headline_Report_March_2016to_February_2018.pdf ↩
-
https://www.ons.gov.uk/economy/environmentalaccounts/articles/oneineightbritishhouseholdshasnogarden/2020-05-14 ↩
-
https://www.ons.gov.uk/economy/environmentalaccounts/methodologies/accesstogardenspacesengland ↩
-
Developing bespoke weights for the full People and Nature survey dataset will require at least 3-6 months of data to understand relationships between variables and demographics. Therefore the final weighting scheme will not be finalised until at least the end of 2020. ↩
-
https://assets.publishing.service.gov.uk/government/uploads/system/uploads/attachment_data/file/875153/MENE_Technical_Report_Years_1_to_10v2.pdf ↩