The National Minimum Wage in 2023
Published 31 March 2023

© Crown copyright 2023
This publication is licensed under the terms of the Open Government Licence v3.0 except where otherwise stated. To view this licence, visit nationalarchives.gov.uk/doc/open-government-licence/version/3 or write to the Information Policy Team, The National Archives, Kew, London TW9 4DU, or email: psi@nationalarchives.gov.uk.
Where we have identified any third party copyright information you will need to obtain permission from the copyright holders concerned.
This publication is available at https://www.gov.uk/government/publications/the-national-minimum-wage-in-2023/the-national-minimum-wage-in-2023
1. Introduction
The Low Pay Commission (LPC) is an independent public body that advises the Government on the rates of the National Minimum Wage (NMW), including the National Living Wage (NLW).
We are a social partnership body, made up of nine Commissioners representing employers, workers and independent experts. Every year since 1998, Commissioners have unanimously agreed on the LPC’s recommendations to the Government.
We met in October 2022 to agree recommendations for the new rates of the National Minimum Wage (NMW), including the National Living Wage (NLW), that come into force on 1 April 2023. This report looks at what the new rates will mean, the LPC’s work for 2023 and our current projection of the level of the NLW needed to reach the Government’s target of two-thirds of median earnings in October 2024. We call our projected 2024 rate the ‘on-course’ rate.
All sources and references for charts and data can be found at the end of the report.
For the evidence base behind our recommendations for 2023 see our full report.
The NLW and NMW rates effective from 1 April 2023 are shown below.
| NMW rate | Annual increase (£) | Annual increase (per cent) | |
|---|---|---|---|
| National Living Wage (23+) | £10.42 | 0.92 | 9.7 |
| 21-22 Year Old Rate | £10.18 | 1.00 | 10.9 |
| 18-20 Year Old Rate | £7.49 | 0.66 | 9.7 |
| 16-17 Year Old Rate | £5.28 | 0.47 | 9.7 |
| Apprentice Rate | £5.28 | 0.47 | 9.7 |
| Accommodation Offset | £9.10 | 0.40 | 4.6 |
2. The rationale for our recommendations
Our recommendations in October were based on the best evidence available at that point. For more detail see the accompanying main report and its summary.
In October, we recommended the NLW should increase by 9.7 per cent (92 pence) in April 2023 to £10.42. This was the on-course rate consistent with achieving the Government’s target of two-thirds of median earnings by 2024.
To achieve the two-thirds target, our recommendation implied a smaller NLW increase in 2024, when average wage growth was expected to have slowed (see next page for details). We judged this balance, with a higher increase in 2023 than 2024, to be appropriate given the prevailing economic conditions.
While the economy had slowed in the lead-up to our advice, the labour market remained very strong. The consensus among forecasters at this time was for GDP growth to slow and for the labour market to soften over the course of 2023. Under these conditions, we judged it appropriate to have a higher increase in April 2023 than in 2024.
Younger workers – those aged under 23 – were the most likely to lose employment during the pandemic. But their employment recovered rapidly throughout 2021 and 2022. At the point of our recommendations their employment rates were close to pre-pandemic levels, aided by the tight labour market and strong demand for labour in youth-friendly sectors.
This tight labour market also improved pay for these workers; earnings increased substantially, particularly for those aged under 21. Because of this labour market strength for 16-17 and 18-20 year olds we recommended increases of 9.7 per cent – in line with the increase in the NLW – for both of these groups, to £5.28 and £7.49 respectively.
In our 2021 Report we recommended aligning the Apprentice Rate and the 16-17 Year Old Rate. We continued to support this position as we saw no evidence of negative effects stemming from this change. With this in mind, we undertook to consider if there is a need for a separate Apprentice Rate long term, with a forthcoming Apprenticeship Evaluation Survey offering the level of evidence necessary to see if a separate rate for apprentices is still justified.
The evidence continues to support the decision to bring 23 and 24 year olds into the NLW and the Commission’s view remains that 21-22 year olds should also be brought into the NLW by 2024. To smooth this transition and avoid a very large increase once they become eligible, we recommended a 10.9 per cent increase for this group, taking their minimum wage to £10.18 in 2023.
3. We estimate the National Living Wage will need to rise to between £10.90 and £11.43 in 2024 to meet its target
3.1 Previous National Living Wage Rates and projections for the 2024 rate (£)
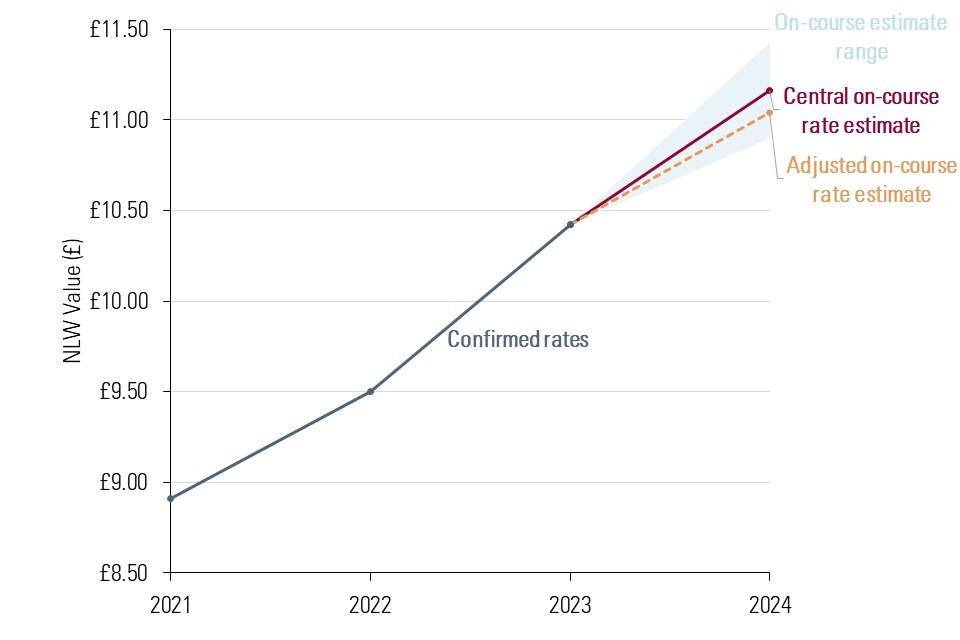
A chart showing the historic rates for the National Living Wage and the projected rate for 2024. The central estimate for 2024 is £11.16, the adjusted estimate is £11.04 and range around the central estimate is £10.90-£11.43. [Source: LPC estimates using the median of hourly earnings excluding overtime for those aged 21 and over, excluding first year apprentices, from the Annual Survey of Hours and Earnings 2022; average weekly earnings (AWE) total pay (KAB9), monthly, seasonally adjusted, GB; and median of average wage growth forecasts from HM Treasury panel of independent forecasts (March 2023), the Bank of England (Monetary Policy Report, February 2023), and OBR (Economic and Fiscal Outlook, March 2023).]
The Government has set a target for the National Living Wage (NLW) to reach two-thirds of median hourly pay by October 2024.
We currently estimate the 2024 NLW rate required to meet this target to be in the range £10.90 to £11.43, with a central estimate of £11.16 (shown in chart opposite). This range is wider than normal as we judge that currently there is increased economic uncertainty.
Our latest estimate is slightly higher than the projection we made in October 2022 (£11.08) as pay forecasts have strengthened since then. Annex 1 explains how we calculate this rate.
Pay growth has increased sharply over the last two years and forecasters expect it to decrease in the next two. This presents some methodological issues for our on-course rate projections (which we explain in Annex 2). Currently, adjusting for these issues would reduce our on-course rate from £11.16 to £11.04 (see chart opposite). We will monitor these issues over the rest of the year.
However, it is important to remember that calculating the on-course rate is only part of our process. Our remit requires us to consider the state of the economy and the views of workers and employers before making rate recommendations.
4. The number of workers paid the minimum wage will likely rise in 2023
We estimate that the total number of jobs paid within 5p of the minimum wage will rise from 1.6 million in 2022 to around 2 million with April 2023’s upratings.
Our estimate is based on the historic relationship between growth in the bite (the minimum wage relative to median hourly pay) and coverage (the number of people paid the minimum wage). In years when the bite has grown quickly we have tended to see big increases in the number of people paid the minimum wage. For example, between 2003 and 2015, the minimum wage tended to grow slightly faster than median hourly pay and minimum wage coverage (for workers 25 and over) increased gradually. When the NLW was introduced in 2016, the bite jumped significantly and coverage did likewise.
However, this relationship is not straightforward. After 2016 the NLW bite continued to rise but coverage remained flat. Then, between 2019 to 2022 the bite rose still further but coverage fell. One driver of this was shortages of workers in some low-paying occupations driving pay off the minimum, while another was the tendency for firms to round pay up from the NLW (£9.50) to the round figure of £10. This demonstrates the uncertainty around our projections.
The minimum wage also affects workers paid more than 5 pence above the rate. We estimated in 2021 that up to 8.3 million workers were indirectly affected by the introduction of the NLW.
4.1 Number of employee jobs covered by the NMW/NLW and per cent of employee jobs covered by the NMW/NLW
| April 2022 | April 2023 projections | |||
| Minimum wage band | Coverage (thousands) | Coverage rate (per cent) | Coverage (thousands) | Coverage rate (per cent) |
| 16-17 | 25 | 7.7 | 32 | 9.9 |
|---|---|---|---|---|
| 18-20 | 82 | 9.2 | 106 | 11.8 |
| 21-22 | 89 | 10.6 | 124 | 14.7 |
| Apprentice Rate | 31 | 14.0 | 40 | 18.1 |
| NLW (23+) | 1,343 | 5.0 | 1,727 | 6.4 |
| Total | 1,570 | 5.4 | 2,029 | 7.0 |
4.2 Number of employee jobs covered by the NMW/NLW, 1997-2022, workers aged 25 and over
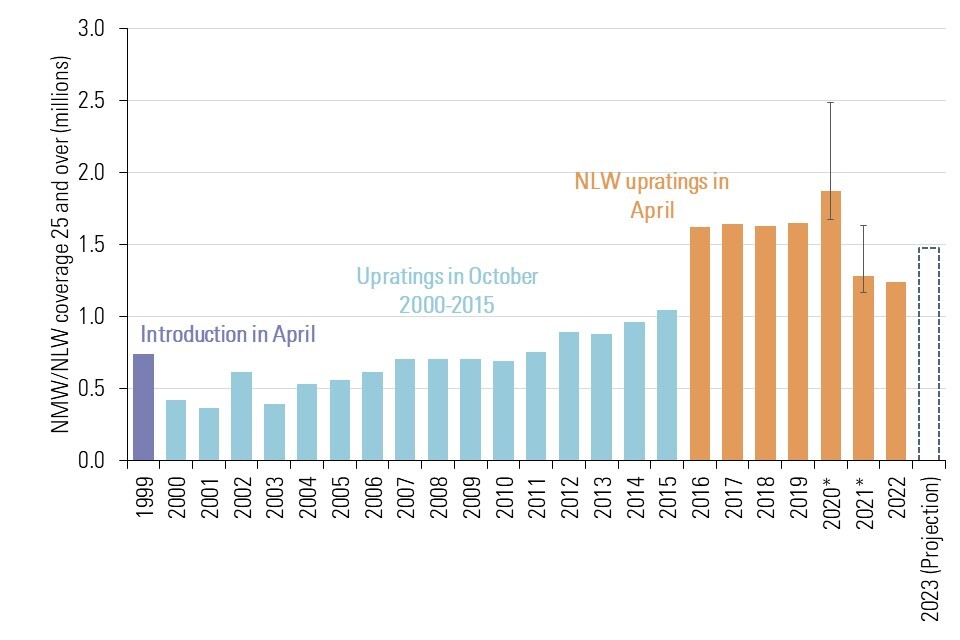
Bar chart showing jobs covered by NMW/NLW for workers aged 25 and over. Increases from 0.6m in 1999 to 1.5m in 2019, falling to 1.2m in 2022. Projection for 2023 is for coverage amongst 25+ population to rise again to 15m. [Source: LPC analysis using ASHE, SOC2020 low-pay weights, UK, 1999-2022. Estimates from 1999 to 2020 are chain-linked and so will differ from previously published figures. Data from 1999-2010 include apprentices and use data reweighted based on 2011 census. Note: Coverage is defined as those paid within 5p of the relevant minimum wage rate. Coverage estimates are as of April that year and are rounded to nearest thousand. 2023 estimate is LPC projection based on historic relationship between bite and coverage growth. For more details see chapter 10 of LPC report 2022. Projections are based on median wage projections made in December 2022 for LPC report 2022. Note: *There is increased uncertainty around the 2020 and 2021 estimates due to the effects of furlough on hourly pay data. For more detail see LPC report 2021.]
5. The NLW’s real value has fallen, but it will likely rise again in 2023 and 2024
Since its introduction in 2015, the NLW has increased much faster than prices or average weekly wages. The upper chart on the right compares its value over time with values had the NLW increased in line with prices or average wages up to the latest data available. If it had been raised in line with CPI, the NLW would have reached £7.81 in April 2022, rather than its actual £9.50.
The lower chart shows the effect of inflation on the real value of the NLW over time. The 2.2 per cent increase in April 2021 led to the real value of the NLW reaching its highest ever value, but this was eroded sharply by inflation in the year that followed. The 6.6 per cent increase to £9.50 in April 2022 helped restore some of this lost value but that was also soon eroded.
The latest inflation data and both OBR and Bank of England forecasts suggest the NLW’s real value will continue to fall until March 2023. Then, this April’s 9.7 per cent increase in the NLW is expected to increase the real value, although still below its April 2021 peak. Forecasters expect prices to stabilise in the rest of 2023 and into 2024. Our central estimate of the on-course rate of the NLW in April 2024 (£11.16) would therefore increase the NLW’s value to a new high and restore the real value lost since 2021. Indeed, the projected NLW at the lowest end of our range in 2024 (£10.90) would more than restore that lost value.
5.1 The NLW if it had been uprated in line with earnings or prices, 2015-2022
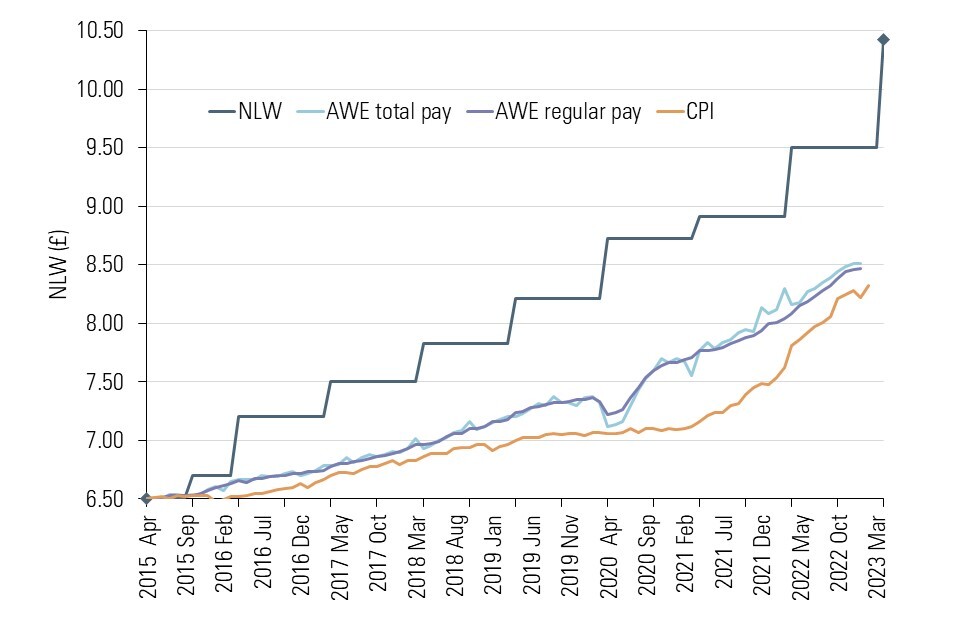
Line chart comparing NLW path from 2015 if uprated in line with inflation or average weekly earnings with actual path. In April 2022, the actual NLW was £9.50; if uprated by inflation it would have been £7.81, if by average weekly earnings £8.16. [Source: LPC analysis using ONS data. The NLW uprated in line with Average Weekly Earnings total pay (KAB9) and Average Weekly Earnings regular pay (KAI7), monthly, seasonally adjusted, GB, April 2015-January 2023; and the Consumer Price Index (D7BT), monthly, UK, April 2015-February 2023.]
5.2 Actual and projected increases in the real value of the NLW since 2015 (in April 2022 prices)
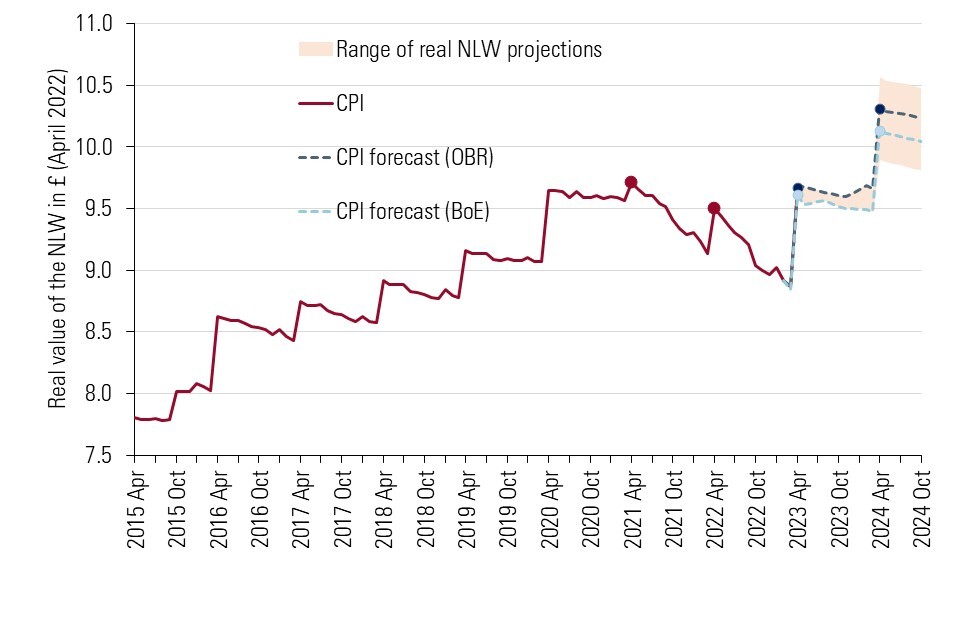
This chart shows the actual and projected real value of the NLW in April 2022 prices. The projections out to October 2024 use forecasts of CPI inflation from the OBR and the Bank of England. [Source: LPC analysis using ONS data, and forecasts from the Office for Budget Responsibility (OBR) and the Bank of England. The NLW will be £10.42 in April 2023 and is projected in April 2024 to be in a range from £10.90 to £11.43. The NLW in April 2022 prices using the Consumer Price Index (D7BT), monthly, UK, April 2015-February 2023; and LPC estimates of monthly CPI using OBR forecasts (from Table 1.7 of the March 2023 Economic and Fiscal Outlook, CPI index (2015=100), quarterly, UK, 2023Q1-2024Q4) and Bank of England forecasts (CPI annual growth from the Market Mode, quarterly, UK, 2023Q1-2024Q4). In the range of real NLW, the lowest value uses the Bank of England forecast, while the highest value uses the OBR forecast.]
6. The impact of the 2023 NLW increase on household incomes depends on the tax and benefit system
Earnings from work are just one component of household incomes. To understand how this April’s increase in the minimum wage will affect household income, we need to look at how it interacts with the tax and benefit system.
The graph on the right shows modelled estimates of how increases in the NLW affect household incomes for two households: one household with a single working person working full-time at the NLW and a second household with two adults, one of whom works full-time at the NLW, and two children.
They show that in most years since 2017, the after-tax/benefit increase in the NLW was lower than the pre-tax/benefit increase in the NLW for both household types. After-tax/benefit increases were smaller for the couple with two children, as this household receives a larger portion of their income through benefits, which tended to grow more slowly than the NLW over this period.
The latest two upratings are exceptional in that after-tax benefit incomes for the couple with two children increase at a similar rate to the pre-tax increases in the NLW. In 2022 this was due to changes to the Universal Credit taper rate and work allowance, which allowed working households to keep more benefit income for a given wage rate. In 2023, this is due to the Government’s decision to uprate benefits by 10.1 per cent (faster than the 9.7 per cent increase in the NLW). These policy changes have less impact on the single person household as a smaller proportion of their income derives from benefits.
6.1 Projected pre tax/benefit and after tax/benefit increases in the NLW (April on previous April, 2017-2023)
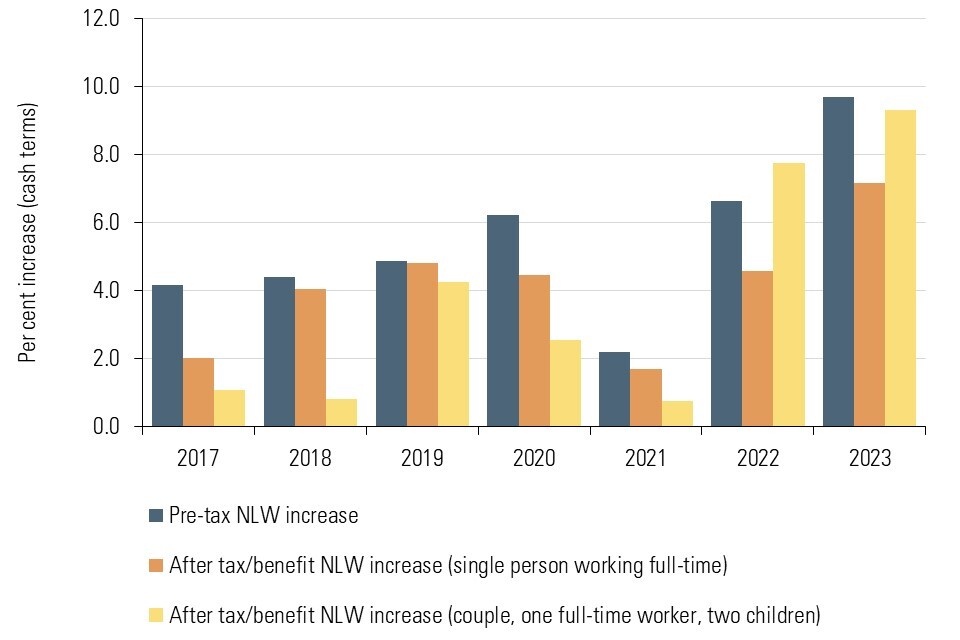
Bar chart showing per cent increase in NLW before and after changes in tax/benefits for two household types. Every year but 2022 pre-tax income increase for NLW worker is bigger in percentage terms than increase after tax/benefit increases. [Source: LPC analysis using HM Treasury modelled estimates of impacts of NLW increases on household incomes. Available in LPC reports 2016-2022. Estimates taken from projections of year before increase, so may not reflect actual change. For instance estimate for growth in 2018 is available in LPC report 2017. For 2017-2020, workers are modelled to work 30 hours, for 2021 and 2022 workers are modelled to work 35 hours.]
Note: The after/tax benefit measures do not include the temporary £20 a week Universal Credit uplift or the one-off government cost of living payments.
7. 21 and 22 year olds are due to become entitled to the NLW in 2024
In 2019, we recommended that workers should be entitled to the NLW from the age of 21 years instead of 25 years. In the first step towards this, 23 and 24 year olds were brought onto the NLW from April 2021. 21 and 22 year olds are due to be moved onto the NLW from April 2024.
In anticipation of this, we recommended a £1 (10.9 per cent) increase to the 21-22 Year Old Rate in April 2023. This closes some of the gap between this rate and the NLW, lowering the jump in the wage floor needed when this age group become eligible for the latter rate. Our central path estimate for the NLW would result in an increase of just under £1 (9.6 per cent) for 21-22 year olds as they become entitled to the NLW in 2024.
Most 21-22 year olds are already paid at or above the NLW, and this number has been growing over time. In April 2022, 15 per cent of 21-22 year olds (127,000) were paid below the NLW. We expect that a similar share will continue to be paid below the NLW up until the change in the age threshold and so be directly affected by the change.
7.1 Number of 21-22 year olds paid below the NLW, 2016-2022
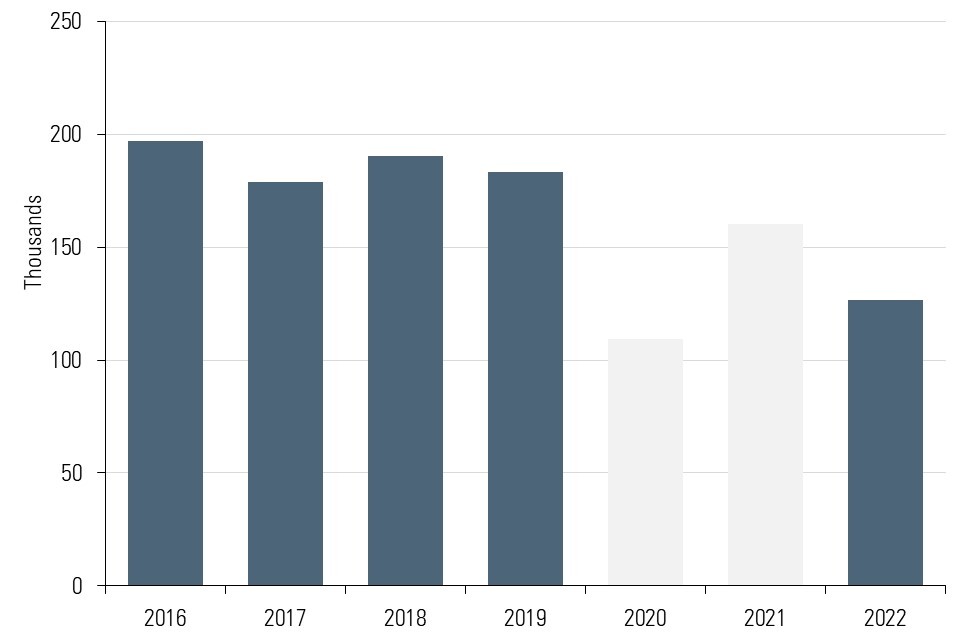
Column chart shows that number of 21 and 22 year olds paid below NLW decreased in 2022 compared to pre-pandemic. From 2016 to 2019, 175,000-200,000 21 to 22 year olds paid below NLW. In 2022, this figure is a little over 125,000. [Source: LPC analysis of ASHE, Low pay SOC 2010 and SOC 2020 weights, 21-22 population, 2016-2022 (April of each year). There is increased uncertainty around the 2020 and 2021 estimates due to the effects of furlough on hourly pay data. For more detail see LPC report 2021.]
7.2 Actual and projected increases in the minimum wage for 21-22 year olds, 2023-2024
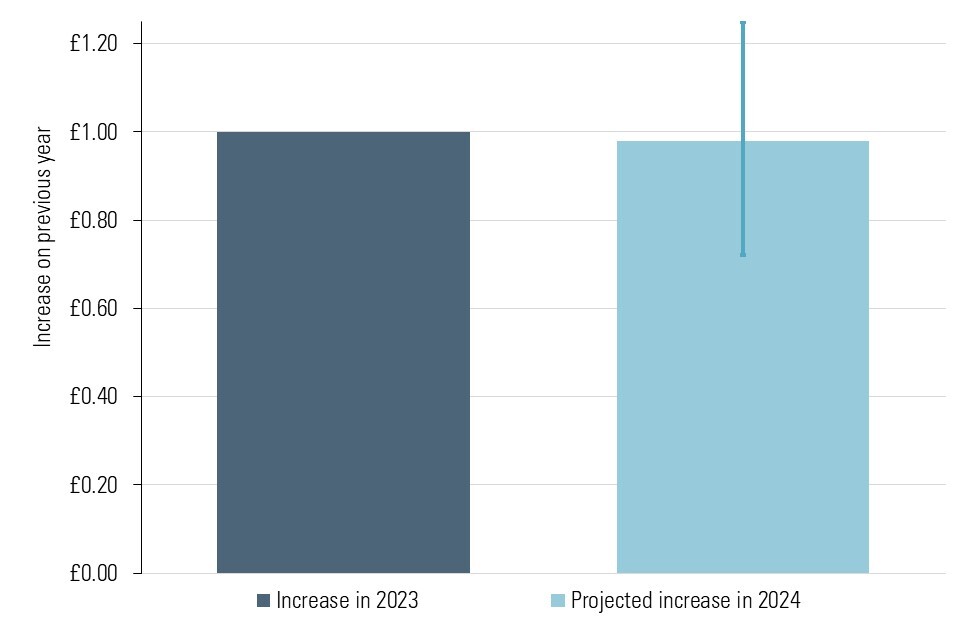
Column chart compares April 2023 increase 21 to 22 year old rate to the forecast increase in April 2022. Central estimate for the projected increase in 2024 is 98 pence. Error bar shows between 72 pence and £1.25. [Source: LPC estimates using the median of hourly earnings excluding overtime for those aged 21 and over excluding first year apprentices from the Annual Survey of Hours and Earnings 2022. Average Weekly Earnings (AWE) total pay (KAB9), monthly, seasonally adjusted, GB; and median of average wage growth forecasts from HM Treasury panel of independent forecasts (February and March 2023) and the Bank of England (Monetary Policy Report, March 2023).]
8. Our remit for 2023
We expect the Government to publish our remit for 2023 in the near future.
We anticipate that the core of our work will remain to monitor and evaluate the effects of the rising minimum wage, and to make recommendations for next year’s rates.
This year, we are also seeking views on a wider set of questions about the future of the minimum wage after 2024.
8.1 The National Living Wage to 2024
We will recommend the rate which should apply from April 2024 to reach the target of two-thirds of median earnings, taking economic conditions into account.
If the economic evidence warrants it, we can advise the Government to review the target or its timeframe. This ‘emergency brake’ is intended to ensure the lowest-paid workers continue to see pay rises without significant risks to their employment prospects.
We will likely be asked to comment on the impacts to date of an increased wage for workers aged 21-22 in light of Government’s commitment to lowering the age threshold for the National Living Wage to aged 21 and over by 2024.
8.2 Minimum wages after 2024
We are seeking submissions on what should happen to the NLW (and other rates) after the 2024 target is reached, to inform advice we will provide to the Government at the end of the year.
We have a particular interest in:
-
The purpose of the NMW and NLW, and the role of the Low Pay Commission.
-
The range of policy options for the minimum wage and how these might work.
-
The potential effects of further minimum wage increases and the risks we should consider.
-
The evidence that should support future policy decisions.
8.3 National Minimum Wage youth rates
The remit asks us to increase these rates as high as possible without damaging employment.
8.4 The Apprentice Rate
We have aligned this rate with the 16-17 Year Old Rate. We are now looking at whether there is a case for removing the rate entirely, and are seeking views on what the impacts of this would be.
8.5 Accommodation Offset
We reviewed the offset last year, setting out our long-term approach to the rate and making a number of recommendations on its application.
We continue to seek evidence on the provision of accommodation to low-paid workers and the effect of increases in the offset.
9. Our evidence strategy in 2023
Our advice to Government is based on the best available evidence.
We welcome evidence from any and all parties on the effects of the rising minimum wage.
There are a number of ways to contribute to our evidence-gathering.
9.1 Written consultation
A formal consultation opened on 23 March and can be viewed here. This will remain open until 9 June.
Submissions are welcome which respond to any of the questions contained in our consultation.
9.2 Regional visits
We will carry out six regional visits between March and October.
Commissioners will meet with workers and employers affected by the minimum wage.
If you are based in one of these locations and wish to give evidence, please contact us via lpc@lowpay.gov.uk.
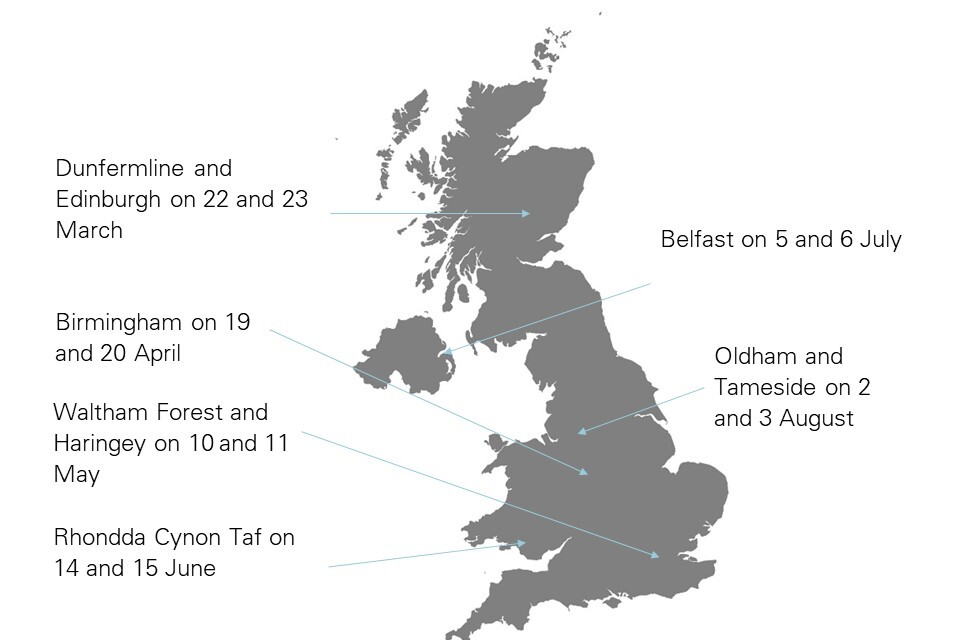
Grey Map of United Kingdom showing locations of LPC visits.
9.3 Research programme
We have published a tender inviting bids for innovative research into the minimum wage, to inform our recommendations.
We will hold research workshops in April and September. Parties wishing to contribute or attend are invited to get in touch.
10. Annex 1: Our method for estimating the National Living Wage on-course rate
The Government’s target is for the NLW to reach two-thirds of median hourly earnings by October 2024. We project an on-course rate for the NLW in 2024 in three steps.
Step 1: Estimate baseline median hourly pay
We take the most recent estimate of median hourly earnings from the Annual Survey of Hours and Earnings (ASHE), an employer survey of 1 per cent of employees in PAYE as our baseline. The latest (April 2022) estimate of median pay for workers aged 21 and over was £14.90 (the navy dot on the chart opposite).
When recommending rates in October 2023, our baseline will be median hourly pay in April 2023.
Step 2: Estimate pay growth from baseline median hourly pay
Next, we estimate pay growth from the baseline to October 2024 (the target date). To do this we use two data sources. We project growth in line with Average Weekly Earnings data (12-month-on-12-month growth), where this is available (currently up to January 2023.) This is the light blue line on the chart opposite.
We then use forecast growth in average weekly earnings to project further out to the target date. We use the median of forecasts by HMT’s independent panel of forecasters, adding the OBR and Bank of England. This is the purple line in the chart.
This step gives us an estimate of median hourly pay in October 2024 (orange dot on chart opposite). To reflect uncertainties in the forecasts we also estimate a range where pay growth rates in the projection period are 1 percentage point a year lower or higher than our central estimate.
Step 3: Project on-course rate by calculating two-thirds of our estimate of median hourly pay
Finally, we project the rate of the NLW forward. Given we are in the final year of our target, we do this by simply taking two-thirds of our estimate of median hourly pay. Our central estimate of the 2024 on-course rate using this approach is £11.16 (the yellow dot on the chart).
10.1 Illustration of our approach to calculating 2024 NLW on-course rate
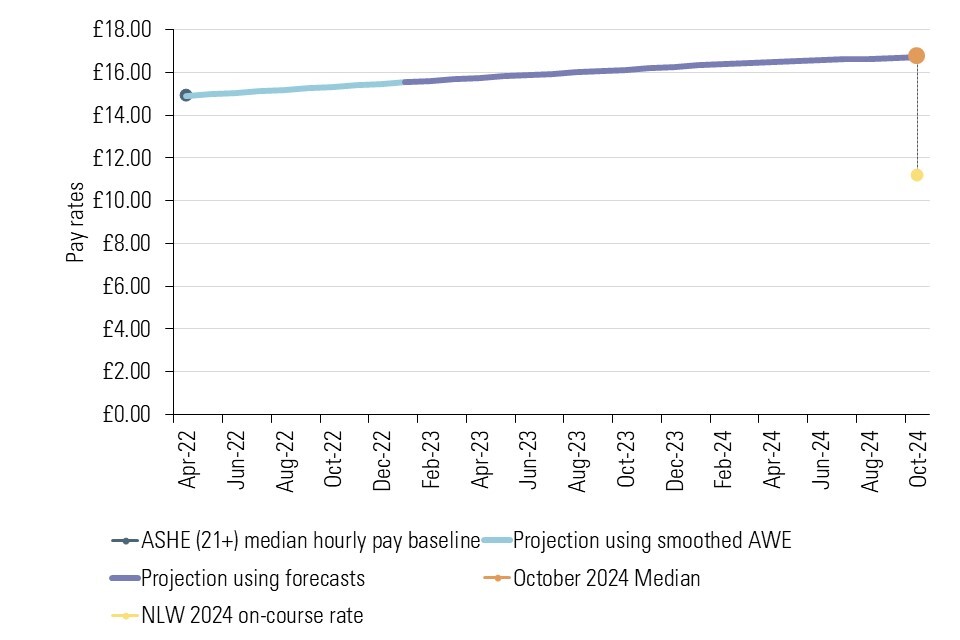
Line graph illustrating how central NLW on-course rate is calculated. It shows central (unadjusted) projection is median hourly pay will be £16.74 in October 2024, so central (unadjusted) on-course rate is £11.16. [Source: LPC estimates using the median of hourly earnings excluding overtime for those aged 21 and over, excluding first year apprentices, from the Annual Survey of Hours and Earnings 2022; average weekly earnings (AWE) total pay (KAB9), monthly, seasonally adjusted, GB; and median of average wage growth forecasts from HM Treasury panel of independent forecasts (March 2023), the Bank of England (Monetary Policy Report, February 2022), and OBR (Economic and Fiscal Outlook, March 2023).]
11. Annex 2: Issues with projecting an on-course rate for the National Living Wage
Calculating the ‘on-course’ NLW rate is inherently uncertain as it relies on forecasts. We publish a range around our on-course rate estimate to reflect this uncertainty. In the last year, we have widened the range around our estimate to reflect increased economic uncertainty.
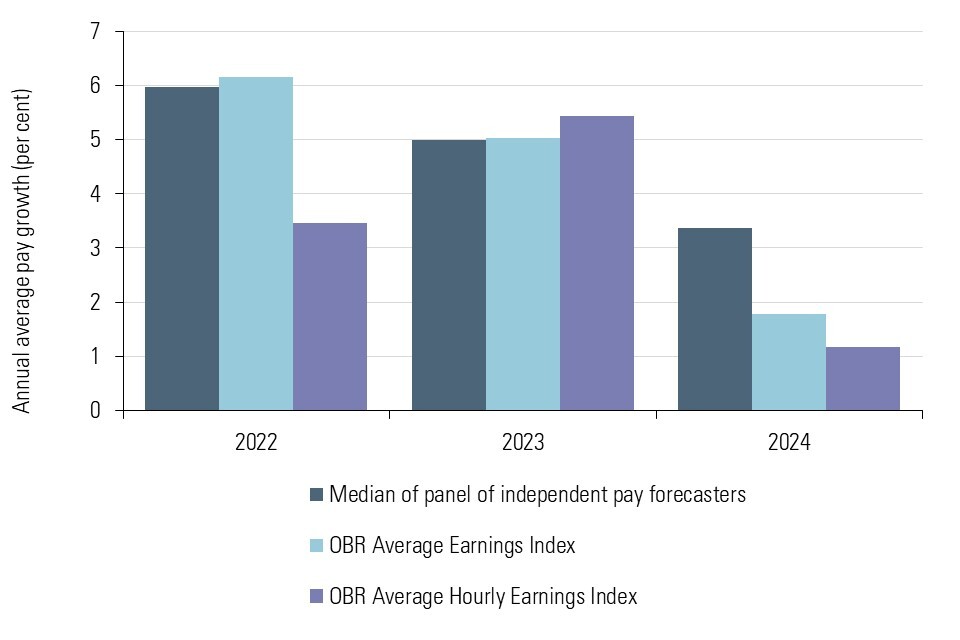
Pay growth has increased rapidly in the last two years and is now forecast to fall (see right figure). This change makes apparent two particular issues with our path calculation:
11.1 1) Application of Annual Average Weekly Earnings pay growth forecasts to monthly pay estimates
We use the most timely pay forecast: the median of a panel of pay growth forecasts compiled by HMT. However, these forecasts are only available for the growth in calendar year average pay, not the October to October growth we need. We apply these monthly by assuming growth is even across the year (accounting for compounding). However, when pay growth is forecast to change rapidly, our approach effectively lags the impact of these rapid changes on our on-course rate estimates. Given that pay growth is forecast to fall, this issue currently is pushing our on-course rate estimate upwards. Adjusting for this issue reduces our on-course rate by 12 pence currently.
11.2 2) Smoothing of Average Weekly Earnings pay growth
Part of our path calculation uses a 12 month smoothed average of Average Weekly Earnings (AWE) to account for the latest available data on pay. We smooth to take out volatility in the AWE data. However, smoothing requires relying on a longer period of historic data, this can mean our smoothed average could not respond fast enough to recent trends in pay growth. Currently this issue has no effect on our headline path estimate. We will continue to monitor it between now and October, when we make our recommendations.
11.3 Annual pay growth, outturn and forecasts, 2011-2025

Bar chart showing outturn growth in calendar year average weekly earnings between 2011 and 2022 and forecast average weekly earnings calendar year growth from 2023 to 2025. Rapid growth in 2021, high in 2022 and forecast to fall from 2023 and 2025. [Source: LPC analysis using ONS Average Weekly Earnings (KAB9). Annual average growth, 2011-2022 and median of average wage growth forecasts from HM Treasury panel of independent forecasts (February and March 2023), the Bank of England (Monetary Policy Report, February 2023), and OBR (Economic and Fiscal Outlook, March 2023.]
12. Annex 3: Adjustments to the issues with the path
We have investigated the two issues identified on the previous page. Currently adjusting for both issues reduces our on-course rate estimate by 12 pence. These adjustments are still experimental and may introduce additional volatility into our month to month on-course rate estimates. We will therefore continue to explore how to best account for these issues, before making our recommendation in October.
The table opposite also shows the OBR’s projection of the NLW. We discuss the differences between the OBR’s projection and our on-course rate estimates in Annex 4.
12.1 Different projections for the 2024 on-course rate
| Projection | 2024 on course rate | Increase on 2023 rate | Per cent increase on 2023 rate |
| LPC central on-course rate | £11.16 | £0.74 | 7.1 |
|---|---|---|---|
| LPC adjusted on-course rate | £11.04 | £0.62 | 6.0 |
| OBR projection | £10.80 | £0.38 | 3.6 |
13. Annex 4: Comparison to OBR NLW on-course rate estimate
The OBR has also published an estimate for the 2024 on-course rate. Their estimate is £10.80. Their estimate differs from our on-course rate estimate for two reasons.
Firstly, our on-course rate estimates rely on different wage forecasts. The OBR uses its own wage forecasts, whereas we use the median of a panel of independent forecasters.
The OBR forecasts for earnings growth (and inflation) are much weaker in 2024 than the median of independent forecasters. This is a key reason for the difference between our path estimated on-course rates.
The OBR’s projection also differs from ours as it uses a different method. It produces a quarterly index of pay growth twice a year, whereas we estimate pay growth based on the HMT panel of independent forecasts, which is updated every month. forecasts.
We expect our projected range (£10.90-£11.43) to be a better guide to future rate recommendations than the OBR’s projection. In previous years our March projections have generally been a better guide to the next year’s minimum wage rate than the OBR’s projections (see lower chart).
The width of our projected range reflects the uncertainty around our estimates and in October our recommended rate is unlikely to be exactly our current central on-course rate estimate. If wage growth is faster or slower than expected, the on-course rate will change. However, we believe that our projected range is a better guide for planning than the OBR’s estimate which falls 10 pence below our lower estimate.
13.1 Latest pay growth projections (OBR and median of independent forecasts)
Bar chart comparing median pay growth projections between OBR and HMT panel of independent forecasters. OBR's projections for 2024 are much weaker (1.8 percent) than the panel median (3.4 percent). [Source: LPC analysis using median of average wage growth forecasts from HM Treasury panel of independent forecasts (February and March 2023), the Bank of England (Monetary Policy Report, February 2023), and OBR (Economic and Fiscal Outlook, March 2023.]
13.2 Comparison of actual changes in the NLW and OBR and LPC projections
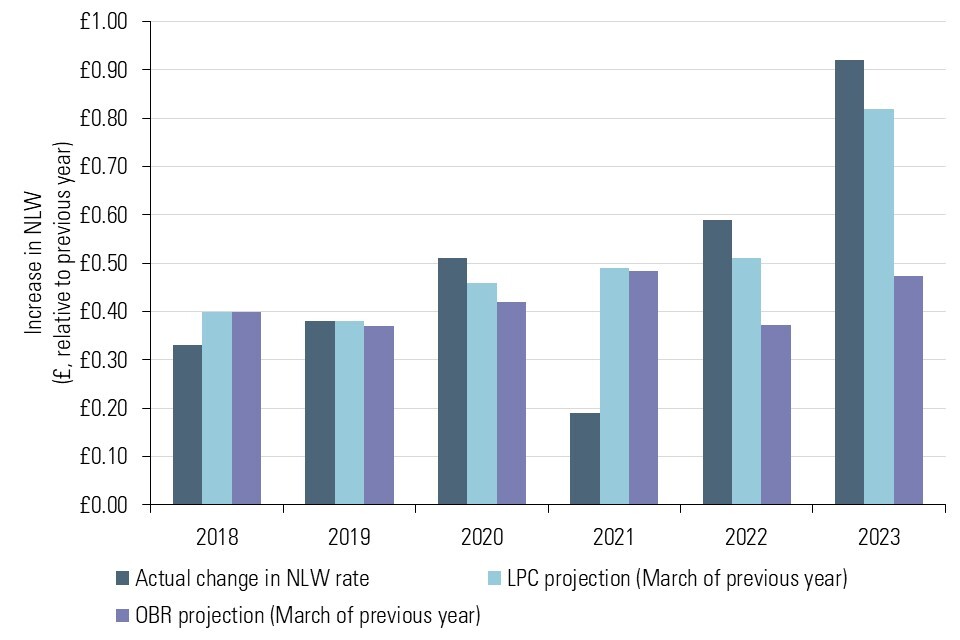
Bar chart comparing changes in NLW with LPC and OBR's March projections (2018-2023). 2018-2021 projections were similar. 2021-2022 OBR projected lower increases. LPC estimates were closer to actual changes. [Source: LPC analysis using LPC reports (2017-2022) and OBR Economic and Fiscal Outlook reports (2017-2022)]