The long shadow of deprivation: differences in opportunities across England (HTML)
Updated 6 October 2020
Applies to England

© Crown copyright 2020
This publication is licensed under the terms of the Open Government Licence v3.0 except where otherwise stated. To view this licence, visit nationalarchives.gov.uk/doc/open-government-licence/version/3 or write to the Information Policy Team, The National Archives, Kew, London TW9 4DU, or email: psi@nationalarchives.gov.uk.
Where we have identified any third party copyright information you will need to obtain permission from the copyright holders concerned.
This publication is available at https://www.gov.uk/government/publications/the-long-shadow-of-deprivation-differences-in-opportunities/the-long-shadow-of-deprivation-differences-in-opportunities-across-england-html
The long shadow of deprivation: differences in opportunities across England
Research report
September 2020
About the Commission
The Social Mobility Commission is an independent advisory non-departmental public body established under the Life Chances Act 2010 as modified by the Welfare Reform and Work Act 2016. It has a duty to assess progress in improving social mobility in the UK and to promote social mobility in England.
The Commission board comprises:
- Sandra Wallace, Interim Co-Chair, Joint Managing Director Europe at DLA Piper
- Steven Cooper, Interim Co-Chair, Chief Executive Officer, C. Hoare & Co
- Alastair da Costa, Chair of Capital City College Group
- Farrah Storr, Editor-in-chief, Elle
- Harvey Matthewson, Aviation Activity Officer at Aerobility
- Jessica Oghenegweke, Presenter, BBC Earth Kids
- Jody Walker, Senior Vice President at TJX Europe (TK Maxx and Home Sense in the UK)
- Liz Williams, Chief Executive Officer of Futuredotnow
- Pippa Dunn, Founder of Broody, helping entrepreneurs and start ups
- Saeed Atcha, Chief Executive Officer of Youth Leads UK
- Sam Friedman, Associate Professor in Sociology at London School of Economics
- Sammy Wright, Vice Principal of Southmoor Academy, Sunderland
This report was written by:
Pedro Carneiro, Sarah Cattan, Lorraine Dearden, Laura van der Erve, Sonya Krutikova and Lindsey Macmillan
Acknowledgements
The authors would like to thank Katherine Rychliski, Paul Gregg, Marianne Sensier, Anthony Heath and Paul Johnson for their comments on earlier versions of this report, which has been immeasurably improved with their input.
© Social Mobility Commission 2020
Foreword
A socially mobile country provides equal opportunities for everyone. A United Kingdom working for everyone would be one where it does not matter who your parents are or where you are born – whether in a large city or a small town, a rural hamlet or a coastal village.
We have much more to do to build a nation in which these principles hold true.
We know something of the current picture. The Social Mobility Commission’s previous work identified a patchwork of ‘hot spots’ and ‘cold spots’ across England, with varying opportunities for education and employment across the country.
What our earlier work did not tell us was the degree to which the place you grow up has a lasting impact on your earnings in adulthood. This is at the heart of social mobility: does growing up in one town rather than another change your life chances? How unequal are outcomes between places across the country? And why do these differences exist?
For the first time, we have been able to answer these questions. Using a newly linked English dataset, never before available to researchers, we have been able to track the journey of all state-educated sons in England who were born in 1986 to 1988. We follow them through their primary and secondary school journey at a time of considerable change and investment in education; to their transition into work at the time of the 2008 recession; and through to their earnings in 2014 to 2016, aged 28. In particular, we look at how the earnings of sons from disadvantaged backgrounds vary across local authorities (LAs) in England, and the role of education and the labour market in explaining these differences.
The findings are challenging, confirming what some have always known intuitively. Where you grow up matters: in areas with the highest social mobility, disadvantaged individuals aged around 28 earn more than twice as much as their counterparts in the areas of lowest mobility (over £20,000 compared with under £10,000). Put simply, 2 equally disadvantaged sons with the same family background will earn very different amounts as adults, based simply on where they grew up.
This extends to an even wider pay gap between disadvantaged sons and those from more affluent families, which also varies widely across the country: the pay gap in the least socially mobile areas is 2.5 times larger than in areas of high social mobility.
These inequalities are not isolated to a few corners of the country. One in 6 local authorities (50 LAs) have both low pay for disadvantaged sons and large pay gaps in adulthood between sons from disadvantaged and more affluent families. These areas stretch across England, from Bolton to Chiltern and Bradford to Thanet. There is unequivocally a postcode lottery for social mobility across England.
Most striking was the finding that in the most unequal areas – those with the largest pay gap and the poorest social mobility – up to a third of the earnings gap is driven by family background and local labour markets, over and above educational achievement.
The role of education
Education remains the key driver of the gap in adult earnings between sons from disadvantaged and affluent families in parts of England where the pay gap is smaller and inequality is lower. Education explains almost all of the earnings differences in those places. In other words, disadvantaged sons earn less than sons from richer families because they have lower levels of educational attainment.
This new evidence tells a story of deep unfairness in the context of place. However, it is not a story of north versus south or urban versus rural; it is a story of local areas side by side that have vastly different outcomes for the disadvantaged sons growing up there. And crucially, this is not a problem that equalising education alone can fix.
We find compelling evidence that the greatest inequality is driven by factors outside education, and in these areas it is far harder to escape deprivation. This lasting shadow of deprivation is not what we want for England, or indeed the United Kingdom, in 2020.
The role of labour markets
The Commission recognises that breaking this link requires a consistent focus on high- quality education. But it also requires us to collectively recognise that to narrow the widest social mobility gaps, a clear and structured set of interventions reaching into labour markets is needed. Getting the first 18 years right is crucial, but ‘levelling up’ in the places most in need requires interventions at both national policy level and local service delivery level, which also address labour market barriers in the most unequal places.
National, regional and local government leaders are acutely aware that building an economic recovery post-COVID will be hard. We believe that this new data provides another piece of intelligence to inform local leaders’ decision-making. It will help them to identify the areas that might struggle most. It provides insights into the communities and places where we as leaders will need even more to keep and maintain connections between people and jobs. It will give insights into how leaders might prioritise different types of interventions to ensure that education gains translate into employment across the life course. These things are of course essential to improve life chances in all places, but especially in those which are the furthest behind.
The Commission is keen to work with local and regional leaders and employers to think through the avenues through which we can provide the right opportunities and boost social mobility in many of the ‘coldest spots’ this research has identified. We are also keen to see improvements in data availability across the other nations of the UK so that this vital analysis can be replicated for other parts of the Union.
The positive news is that the government’s existing geographical interventions get a lot right. Many of the areas that have the most significant and entrenched issues are covered within the existing Opportunity Areas. But a significant number are not, and we think this research gives a strong evidence base for pinpointing exactly the areas that might benefit if the programme could be extended.
We are acutely aware that the impact of COVID-19 is felt most by those already facing disadvantage. This is creating new and immense challenges for policy. We may expect the hardest-hit areas, with shrinking labour market opportunities, to face the longest impact of this recession. This government has a strong mandate to deliver on a programme to equalise outcomes across the UK. This work is a contribution to and a roadmap for how we might work together to get there.
Sandra Wallace and Steven Cooper,
Interim Co-Chairs, Social Mobility Commission
Executive summary
A socially mobile country provides equal opportunities for everyone, across big cities and small towns, and regardless of whether your parents are rich or poor. This report makes use of newly linked administrative data on all state-educated pupils born between 1986 and 1988 to follow a group of sons[footnote 1] from where they grew up, looking at their family circumstances and their educational achievement, through to the labour market.
While previous work has documented the national picture of social mobility in England, for the first time we are able to show how the earnings outcomes of children from different backgrounds vary across lower-tier local authorities. We also explore why there are differences in opportunities across place, considering the role of education and the labour market.
Where you grow up matters
We have found both the adult earnings of sons from disadvantaged families, and the difference in pay between sons from the most and the least disadvantaged families, vary a lot between the more than 320 local authorities in England.
Depending on where they grew up, sons from disadvantaged families can earn on average up to twice as much as similar sons who grew up elsewhere in the country.
The difference in adult earnings between sons from the richest and poorest families who grew up in the least mobile areas is up to two and a half times as large as the difference in earnings between sons who grew up in the most mobile areas.
Some of these differences defy easy explanation. This is not a simple story of north versus south or urban versus rural. Local authorities with the worst outcomes include cities like Sheffield and Bradford. And the perception of London outperforming other regions is only partly borne out, since the capital has boroughs with sharp contrasts in the outcomes of rich and poor children.
We have found deprived areas with limited opportunities adjacent to more affluent areas with greater opportunities, throughout England. Areas with lower pay for disadvantaged sons and less equality of opportunity are typically more deprived, with lower house prices, fewer labour market opportunities in professional occupations and fewer education opportunities in ‘Outstanding’ schools.
Education drives opportunities
Individuals from disadvantaged backgrounds perform less well at school and are less likely to attend university than those from wealthier backgrounds growing up in the same area.
Across local authorities, education gaps between sons from poor and wealthy families explain, on average, around 80% of the gap in adult earnings between them.
While sons from the least deprived families have significantly better educational performance than their disadvantaged counterparts in all areas, the size of this achievement gap varies.
In authorities where the difference in educational attainment is largest, sons from the most well-off families score 50 percentiles higher in the age 16 test score distribution than sons from the least well-off families. This gap is over twice as large as in the areas with the smallest gaps in educational achievement.
Areas with the lowest education gaps tend to be those with less selective school systems such as grammar schools. In these areas, pupils from more and less well-off backgrounds are more likely to attend the same schools. They are also more densely populated, with a higher proportion of non-white students. Inner London boroughs make up all of the 10 local authorities with the smallest education gaps.
Education alone is not enough to get on in the areas with the lowest social mobility
Education accounts for a broadly stable amount of the pay gap between sons from the most and least deprived families across local authorities.
In the most socially mobile areas, gaps in educational performance explain virtually all of the earnings gap. In the least mobile areas, however, relative educational performance explains only two-thirds of the adult pay gap. This suggests that reducing educational gaps would reduce pay gaps, but would not reduce differences in mobility across local authorities. To ‘level up’ between areas, we need to look beyond education.
Our cohort of sons entered the labour market around the time of the ‘Great Recession’ in 2008. This report shows that areas with the most unequal opportunities are more deprived and have fewer professional and managerial jobs.
Previous research has shown that the most deprived are hardest hit in bad labour markets – possibly because more affluent sons are better placed to cope by moving away or taking advantage of their family’s financial, social or cultural capital to access the limited opportunities available.
Policy
Policy-makers need to prioritise areas with both the lowest earnings for disadvantaged sons and the largest pay gaps between the most and least deprived sons. Not only do these areas have large education gaps, but for deprived individuals, there is a lasting shadow of family circumstance persisting into adulthood. Giving additional support to this fifth, these localities with lower life chances, must be our mission.
Policies such as investments in Opportunity Areas (2016), the Industrial Strategy (2016) and Midlands Engine (2017), and more recently the Towns Fund (2019) are interventions that target most (but not all) of these areas. This research gives a good evidence base which helps us think about how the foundations laid by this cluster of regionally targeted programmes could be built upon in a post-COVID world. In summary, this new evidence indicates additional areas in which the government should consider expanding programmes – in particular Opportunity Areas. It also suggests that, in line with previous Commission recommendations, there is a strong rationale for deepening the Opportunity Areas programme in particular places, developing and trialling ‘what works’ aimed at improving labour market outcomes.
If the lack of labour market opportunities post-COVID has a similar impact on young people as was observed in the Great Recession, we will again see large disparities in income between those from different backgrounds among the generation now entering the labour market.
Key findings
-
Where you grow up matters – social mobility in England is a postcode lottery, with large differences across areas in both the adult pay of disadvantaged sons and the size of the pay gap for sons from deprived families, relative to those from affluent families.
-
In areas with the highest social mobility, disadvantaged individuals aged around 28 earn more than twice as much as their counterparts in the lowest-mobility areas (over £20,000 compared with under £10,000).
-
In areas with low social mobility, pay gaps between deprived and affluent sons are 2.5 times bigger than in areas of high social mobility.
- In areas of high social mobility, educational achievement accounts for almost all the earnings difference between individuals from deprived and affluent families.
-
In areas of low social mobility, it is far harder for someone from a deprived background to escape deprivation. Up to 33% of the pay gap is driven by non-educational factors.
-
50 English local authorities (one in 6 of those analysed) have both low adult pay for disadvantaged sons and large pay gaps between those from deprived and affluent families.
-
Localities with low life chances include Bolton, Bradford, Chiltern, Hyndburn and Thanet. They typically have fewer professional and managerial occupations, fewer ‘Outstanding’ schools, more areas of deprivation and moderate population density.
- To equalise opportunities across the country, government must consider what support can be targeted on these local authorities to improve overall social mobility outcomes.
Introduction
The key principle behind social mobility is that everyone gets a fair chance of success in life, whether in big cities or small towns, and whether your parents are rich or poor. Most existing research focuses on the national story, but very little research has been done to understand how the picture varies in different places and why.[footnote 2] This report builds on the Commission’s 2017 Social Mobility Index to tell the story of social mobility and place through income measures for the first time, highlighting large differences in opportunities around the country.
Successive administrations have targeted building a fairer and more equal society, in which circumstances of birth – including the family you are born into and the place where you grew up – do not matter.
But does someone raised in Manchester have the same opportunities as a similar individual raised in the Malvern Hills? While regional disparities in social mobility and opportunities have been recognised in policy over the past decade – from David Cameron and George Osborne’s Northern Powerhouse to Theresa May’s Opportunity Areas, Industrial Strategy and Midlands Engine and Boris Johnson’s ‘levelling up’ agenda, there has been little evidence on how the impact of childhood family circumstances on later life earnings differs at the local level.
The first objective of this report is to describe the importance that place plays in determining outcomes. The second objective is to consider why opportunities vary across place, examining the role of 2 important factors for social mobility: education and the labour market.
Geography matters for social mobility. There are significant differences in how disadvantaged sons[footnote 3] who grew up in different local authorities (LAs) fare in the labour market, as well as in the size of the pay gaps between sons from the most and least disadvantaged families.
There are also differences in the educational achievement of sons from the most and least deprived backgrounds across local authorities, with areas with the lowest pay gaps also tending to have the lowest gaps in educational achievement.
Methodology
While previous work has looked at the drivers of social mobility using cross-country comparisons, these studies have been limited in the conclusions they can draw by the different institutional, economic and cultural settings across countries. Our new approach, following seminal work by Chetty and colleagues from the US, and recent work in Sweden, Denmark, Norway and Italy, considers within-country comparisons of social mobility, which ensures mobility measures are comparable across areas.
This analysis is made possible by the recent linkage of administrative education data (National Pupil Database and Higher Education Statistics Authority) and earnings and benefits records (HM Revenue and Customs and the Department for Work and Pensions) in the Longitudinal Education Outcomes (LEO) dataset. These data, which have never previously been used to study how opportunities are passed across generations, allow us to link all state-educated sons, born between 1986 and 1988, who attended school in England, to the area where they grew up, and to track their educational and labour market experiences.
This allows us to measure the gap in adult earnings between sons from the most and least deprived families who grew up in the same area, and to compare the earnings of sons from disadvantaged families across areas. We measure the link between family circumstances at age 16 and later labour market earnings at age 28 for over 800,000 sons, across the 320 lower-tier local authorities in England (see Appendix 2).
The story told here is one which puts men and their outcomes during the life course front and centre. This is an artefact of data constraints. The Commission will continue to make the case to government for enriched and enhanced data creation, collection, linkage and researcher access across all nations of the United Kingdom. Improving our data resources to a standard comparable with that of our Scandinavian peers would enable us to accurately assess and compare the social mobility progress of all our children, daughters as well as sons.
Despite this gender constraint we believe that the main findings within the report are not gender specific. In short: this is a story illustrated by men, but its message is about all those who grow up disadvantaged, and how that disadvantage varies by place.
Report structure
The report is divided into 4 sections. In Section 1 we describe how the adult earnings of sons of disadvantaged families and the gap in earnings between the sons of more and less deprived families vary across local authorities in England. We might expect there to be differences in pay, based on how well people do at school and whether they attend university.
In Section 2 we show that patterns in pay gaps between rich and poor sons hold across areas of England, even when comparing pupils with similar academic records. In areas with high social mobility, academic achievement is rewarded regardless of background. But in areas with low social mobility, it is much harder to escape deprivation through educational achievement, suggesting that the labour market rewards family background over and beyond educational achievement in these places.
Section 3 examines the role of education in this story. Education is an important driver of social mobility, since people from richer families tend to acquire more education, and higher levels of education are rewarded more generously in the labour market. Educational achievement accounts for the majority of pay gaps between rich and poor sons in every area. And large inequalities in educational achievement exist across the nation, with areas where schools are more socially segregated, including grammar school areas, having the most pronounced inequalities in education.
Finally, in Section 4, we present some challenges for future policy in this area. We discuss what this research can tell us in terms of what and whom policy-makers should focus on and how our findings tie in with the current policy landscape, including recent initiatives such as the Towns Fund and Opportunity Areas. We outline priorities for future research and describe the data needed to carry it out.
What we found
Gaps in educational achievement between the most and least deprived families explain the vast majority of later differences in earnings between individuals from those groups.
Education accounts for a broadly stable proportion of the pay gaps across local authorities, which means it is less significant in areas where pay gaps are large (less mobile areas) compared with those where they are small (more mobile areas).
In the most mobile areas, education gaps can explain virtually all of the pay gap. But in less mobile areas, other factors drive differences in earnings between sons from poor and rich families, even with the same education. This suggests that to ‘level up’ between places, we need to look beyond the education system to understand why equally achieving sons have different opportunities in the labour market.
While pinpointing any specific reasons for this is beyond the scope of our analysis, possible factors include:
- family connections and finances helping individuals from the least deprived backgrounds to find good jobs
- how schools and colleges prepare pupils for local labour markets
- employers’ adoption of inclusive recruitment policies
Regional differences in internal migration flows may also have an influence, along with the possibility that deprived sons in less equal areas are less likely to seek better prospects elsewhere than those in more equal areas.
Policy context of our cohort
Our group of ‘Millennials’ were born between 1986 and 1988, during a period when income inequality had increased considerably. Home ownership rose through the Right to Buy scheme, which for the first time gave social housing tenants the right to buy their own homes. By 1987, more than one million council-owned homes had been purchased by their tenants.
The 1988 Education Reform Act set the stage for the cohort’s entire education experience. Increased accountability and transparency were key components of the reform, which saw league tables and parental choice bringing market forces into the education system by encouraging schools to compete for pupils.
Our cohort entered primary school just as the New Accountability Framework of 1992 established Ofsted to ensure compliance in schools.
For their parents, the 1991 recession saw high rates of unemployment and inflation. The crash, alongside the failed Exchange Rate Mechanism (ERM) experiment of 1992, led to high interest rates and falling house prices, causing considerable negative equity problems for many mortgage holders.
The secondary school journey of our cohort coincided with a period which saw large increases in investment in education. Some of the initiatives which were introduced then, such as Excellence in Cities (1999), coincided with the secondary school experiences of our cohort. Other initiatives, such as Teach First (2002) and the London Challenge (2003), were introduced when this group were in their final years of compulsory education (2002 to 2004).
Our Millennial sons entered post-compulsory schooling as higher education (HE) costs rose, with university fees rising from £1,000 to £3,000 in 2006. But they also benefited from increased support, through the Education Maintenance Allowance (EMA, 2001 to 2004) and the introduction of income-contingent loans for fees in higher education, which meant fees no longer had to be paid upfront. Grants were reintroduced to cover living costs in 2005, while maintenance loans rose in 2006.
The Great Recession of 2008 struck while our cohort was establishing itself in the labour market –from either school or higher education. The period that followed saw contraction of public service provision. In the following years, unemployment slowly recovered to pre- recession levels, zero-hours contracts increased and the lowest-paid saw a shift to the gig economy.
This period also saw the creation of the Social Mobility Commission in its original form as the Child Poverty Commission, under the 2010 Child Poverty Act. The Commission was set up to monitor the then-government’s Child Poverty Strategy and provide independent advice.
The Commission’s remit was extended in 2011 to include social mobility, to ensure that child poverty was considered within the broader context of children’s life chances, before it was renamed the Social Mobility Commission in 2016.
At the time we measured the adult earnings of our cohort of sons at age 28 (2014 to 2016), the economy was recovering, and new schemes were planned to boost regional economies and education systems. These included the Northern Powerhouse, Industrial Strategy and investment in the Opportunity Areas.
The relatively recent introduction of these interventions, much like some of the education investments of the 2000s, means that their full effects are yet to be felt and are therefore likely to fall outside of this analysis. More recent events such as Brexit and COVID-19 also fall out of the scope of what is measured here.
Definitions
When we refer to family background, we are capturing a broad range of resources and skills that parents pass on to their children. This can include money, links to jobs, knowledge and expertise in navigating different education routes and occupations, and social skills, for example.
Education is here defined as the achievement of sons in their best eight GCSEs (or equivalent) at age 16. Our findings are very similar when we define education more broadly as the entire achievement of sons at age 11, age 16, age 18 and university.
Our discussion of the role of labour markets is referring to anything that happens beyond educational achievement. This could include the lack of jobs in an area, and the role of internships and networks in accessing jobs, for example.
Figure 1: Policy timeline

A note on case studies
This report includes interviews with individuals living in 4 local authorities: Chiltern, Welwyn Hatfield, East Riding and Hull. Chiltern and Welwyn Hatfield are nearby local authorities. Chiltern has very poor social mobility prospects (low median earnings for disadvantaged sons and a high pay gap) while Welwyn Hatfield has better social mobility (high median earnings for disadvantaged sons and a low pay gap).
Hull and East Riding are neighbouring local authorities. Hull has poor prospects for disadvantaged sons, with one of the largest pay gaps, while there is a smaller pay gap in its East Riding neighbour.
While not directly representative of the cohort in our study, their stories provide useful context and illustrate the challenges faced by disadvantaged men and women throughout England. We are very grateful to the organisations which helped us with these case studies.
Case study: Alfie Casey
Location: Welwyn Hatfield
Living in a local authority area with higher-than-average social mobility has benefited 17-year-old Alfie Casey from the Welwyn Hatfield district.
In general, people living in this local authority receive higher than national average earnings, while the pay gap between low and high earners is much smaller than that in the Chiltern district in neighbouring Buckinghamshire, and lower than the national figure.
After working in a barber’s shop from the age of 15, Alfie began an apprenticeship as a hairdresser in November 2019, where he earns £8,000 a year. He said: “I still live at home with my parents, so I only pay a small amount for rent, and I have enough money to live on. We are a working-class family, but we have never been poor.”
Four months into his apprenticeship, Alfie was furloughed on 80% pay after his employer had to close the business because of the COVID pandemic. He returned to work in 2020.
Alfie added: “I think that having had work experience when I was younger helped me get my apprenticeship. I have friends who are unemployed and are finding it difficult to get a decent job, especially with the way things are at the moment. It’s a struggle for some of them.
“I really like my job and I don’t feel the need to move away from the area or look for work elsewhere at the moment. I still have 2 or 3 years to go as an apprentice, but when I’m qualified, I might think about it.”
We are grateful to Welwyn Hatfield Borough Council for helping us with Alfie’s story.
1. Social mobility across places
Key findings
-
Pay for disadvantaged sons in some LAs is twice as high as in the worst areas for this group.
-
LA social mobility – defined as the pay gap between the most and least deprived sons – is 2.5 times greater in the best areas compared with the worst.
-
LAs with lower pay for disadvantaged sons and lower social mobility are more deprived, with lower house prices, a smaller professional labour market and fewer ‘Outstanding’ schools.
In this section we show how the adult pay of disadvantaged sons varies across England, in terms of how much they get paid both (a) relative to their counterparts in other areas and
(b) relative to the most affluent sons who grew up in the same area.
There were large differences in the pay of disadvantaged sons, depending on where they grew up – compared both with the same group in other authorities and with the most well- off sons in the same area. Note that while we compare sons from the same areas, they do not have to be working in the same place they grew up – moving to areas with greater opportunities is implicit in what we are measuring here.[footnote 4]
Earnings of disadvantaged sons
At national level, sons eligible for free school meals (FSM) at age 16 had median earnings of £13,500 at age 28. Yet there are large differences across different areas (see Table 1.1). In Chiltern, for example, an area outside the M25 between High Wycombe and Watford, the average disadvantaged son earned £6,900 a year at 28, while similar individuals of the same age in Uttlesford in Essex and Forest Heath in Suffolk earned over £21,000.
Differences in the earnings of sons disadvantaged at 16 do not follow the typical north/south divide (see Figure 1.1).[footnote 5] There are broad areas in the north west around Manchester, Sheffield and Leeds (dark red shading), and in the north east, where members of this group who grew up in those places earned very little at 28 (less than £10,000 in Gateshead, for example).
But there are also areas in Kent and Sussex with low earnings for sons who grew up there and were disadvantaged at 16. In Hastings, median earnings at age 28 were £10,600 a year. There are also pockets in the west and south west of the country with low earnings for this group: in Malvern Hills just east of Wales, and in West Devon, the average disadvantaged son who grew up locally earned less than £10,000 a year at 28.[footnote 6]
Table 1.1: Highest and lowest earnings at age 28 for disadvantaged sons at age 16, by local authorities where they grew up
Local authorities with highest earnings – median earnings at 28 for disadvantaged sons of £19,200 to £24,600
- Broxbourne
- East Hertfordshire
- Forest Heath
- Havering
- Reigate and Banstead
- Spelthorne
- Uttlesford
- Welwyn Hatfield
- West Oxfordshire
- Wolkingham
Local authorities with lowest earnings – median earnings at 28 for disadvantaged sons of £6,900 to £10,400
- Bradford
- Chiltern
- Hartlepool
- Hyndburn
- Gateshead
- Kensington and Chelsea
- Malvern Hills
- Nottingham
- Sheffield
- West Devon
There are also large differences across local authorities close to each other. While many of the highest-earning places are around London, the story within London boroughs is mixed. While median earnings of disadvantaged children growing up in Havering, Barking, Newham, Tower Hamlets and Hillingdon were among the highest in the country, Haringey, Islington, Wandsworth, Westminster, and Kensington and Chelsea record the lowest median earnings for disadvantaged children who grew up there.
Figure 1.1: Earnings at age 28 for disadvantaged sons at age 16, across local authorities in England where they grew up

There are also pockets of local authorities with high earnings across England. The average disadvantaged son at age 16 who grew up in South and East Staffordshire earned over £17,000 at age 28, and in South Ribble, just south of Preston, a similar individual earned £17,200 at age 28.
Pay gaps between the most and least deprived sons
English local authorities also show large differences in the extent to which opportunities – as measured by age 28 earnings – are equal for those growing up in different family circumstances in the same area. Here, we consider the difference in earnings for sons from the most and least deprived families in childhood growing up in the same region.
Areas with the largest pay gaps are areas of low mobility, offering less equal opportunities. Those with smaller pay gaps are more mobile, offering more equal opportunities.
At national level, advantaged sons (who earned on average more than £27,000 a year) earned double the income of those from the most deprived families (average around
£13,000 a year) and are predicted to be 20 percentile points higher in the earnings distribution.
Table 1.2: Local authorities with the smallest and largest pay gaps at age 28 between the most and least deprived sons at age 16, by where they grew up
Local authorities with the smallest pay gaps (pay gap between the most and least deprived sons of 7 to 10 percentile points)
- Kensington and Chelsea
- Camden
- Chichester
- Hackney
- Hammersmith and Fulham
- Islington
- North Dorset
- Oxford
- Southwark
- Westminster
Local authorities with the smallest pay gaps outside of London (pay gap between the most and least deprived sons of 9 to 12 percentile points)
- Cambridge
- Chichester
- Forest Heath
- High Peak
- North Dorset
- North Oxfordshire
- Norwich
- Oxford
- South Derbyshire
- South Oxfordshire
Local authorities with the largest pay gaps (pay gap between the most and least deprived sons of 24 to 28 percentile points)
- Basildon
- Bradford
- Chiltern
- Corby
- Coventry
- Hyndburn
- Kingston upon Hull
- Luton
- North East Lincolnshire
- Waveney
Figure 1.2: Pay gaps at age 28 between the most and least deprived sons at age 16, across local authorities in England where they grew up

But this figure masks large differences in the size of those gaps across local authorities (see Table 1.2 and Figure 1.2). The areas with the smallest pay gaps (the most mobile areas) have differences of only 7 to 10 percentiles in the pay of sons from the most and least deprived families. In contrast, in the areas with the largest pay gaps (the least mobile areas) the differences between the pay of sons from the most and least deprived families are 2.5 times as large, or more than 25 percentiles.
There are also large differences across local authorities within broader regions, highlighting the importance of targeting policies aimed at improving social mobility at local level (see Appendix 4 for detailed maps by region). As the smaller London map in Figure 1.2 shows, while Inner London boroughs feature prominently in the list of areas with the smallest pay gaps, some boroughs in Outer London, such as Bexley and Harrow, have large pay gaps (that is, they are among the least socially mobile), with differences of 22 to 23 percentiles between the earnings of the most and least deprived sons.[footnote 7]
This pattern can be seen across the country in the larger map in Figure 1.2. Manchester has a much smaller pay gap between sons from the most and least deprived families who grew up there than that of neighbouring Bolton and Oldham. In the south west, East Devon has one of the smallest pay gaps, while neighbouring Torbay has one of the largest. And in Yorkshire and Humberside, while Hull has one of the largest pay gaps between sons from the most and least deprived families, the pay gap in East Riding is much smaller.
What do areas with lower pay for disadvantaged sons look like? What do areas with less equality of opportunity look like?
While most of our best-performing local authorities are in London, we also see areas to celebrate outside London: Cambridge, Chichester, North Dorset, Forest Heath, and Oxford and surrounding areas are among those places with the smallest pay gaps (see Table 1.2).
Yet there are many local areas with poor opportunities for the disadvantaged sons growing up there. We use some key indicators of local areas to paint a picture of what local authorities with lower pay look like for the disadvantaged sons who grew up there, as well as local authorities with less equality of opportunity (Figure 1.3). In the next 2 sections, we explore the relative role of the labour market and education in driving these differences across local areas.
Figure 1.3: Characteristics of areas with higher and lower earnings for disadvantaged sons, and of areas with more and less equality of opportunity
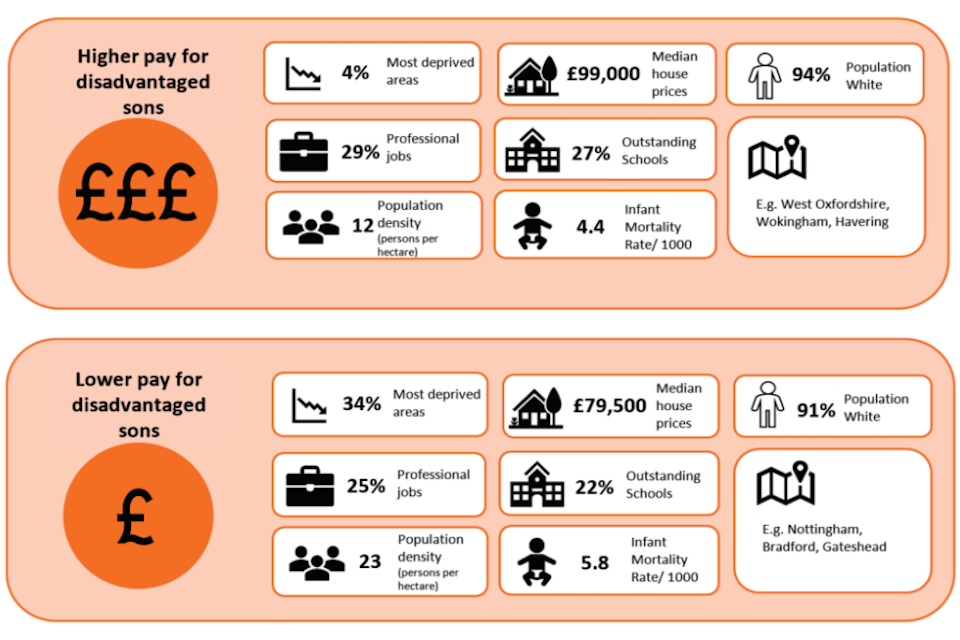

Notes: ‘Most deprived areas’ refers to the percentage of LAs that are classified in the top quintile of the IMD (see footnote 8 for full details). For example, in the top box, this means that 4% of LAs with higher pay for disadvantaged sons are found in the top quintiles of this index (the most deprived).
At about the time our sons were growing up, local authorities with lower-than-average pay for the disadvantaged growing up locally were themselves typically more deprived. Around one-third of local authorities in this group had an average deprivation rank[footnote 8] in the bottom 20% nationally, compared with only around 1 in 20 of LAs with above-average pay for local disadvantaged sons.
Areas with lower pay for this group also had a lower proportion of people working in professional and managerial jobs. They were more densely populated areas, with lower median house prices and with a higher proportion of the population being non-white. The proportion of ‘Outstanding’ schools was lower in these areas, and infant health outcomes were worse.
Areas with above-average pay gaps between the most and least disadvantaged sons growing up locally also tend to be deprived. Around a quarter of local authorities in this group have an average deprivation rank in the bottom 20% nationally, compared with only around 1 in 10 of the local authorities with smaller-than-average pay gaps. The share of people working in professional and managerial jobs was also lower in these areas, with lower house prices and a lower proportion of ‘Outstanding’ schools.[footnote 9] Infant health outcomes and the proportion of non-white residents were similar across areas with smaller and larger pay gaps.
These statistics paint only a broad picture of these areas. In the following sections, we consider the main drivers of differences in pay gaps between the most and least deprived sons across areas in greater detail.
Case study: Trudy Pringle
Location: Chiltern
Trudy Pringle is a 26-year-old single, working mother with 2 young children who lives in the mainly affluent county of Buckinghamshire, in Chiltern. Chiltern is an area with very low social mobility, with low pay for disadvantaged individuals and a high pay gap.
Trudy comes from a working-class, one-parent family and has a strong work ethic. “You have to work – it’s good for the soul,” she said. “I suppose I’m following in my mother’s footsteps.” However, despite having 2 jobs, she is trapped in a position of low income with no immediate prospects of a better life for herself and her family. As well as running an after-school club for local children, Trudy also works as a lunchtime supervisor at a local primary school. But with an average yearly income of just £13,000 and rent of £800 per month, she admits it is a constant battle to make ends meet.
She said: “I’ve had to base my career around my children because childcare is so expensive. I cut down on expenses as much as I can, but it’s difficult and inevitably I run up debts. I need all the money I can get with 2 children.”
Things were difficult enough for Trudy before the COVID pandemic, but the lockdown and restrictions on schools have hit her harder than most. She said: “My kids have had to learn that they won’t be able to do all the activities they would usually do. Obviously, I haven’t been able to run my after-school club, so I have only had £3,600 from my other job since March. I would normally have up to 30 children in the club, but even with the schools reopening I am restricted to a maximum of 15.
“Because of the government guidelines, I can’t employ the people I used to and I’m having to do it on my own. Then there is the hire of the hall and extra expenses, such as hand sanitisers and individual pencil cases for the children.
“Also, a lot of parents are worried about sending their kids to me because they are going to have to mix. I don’t have the facilities to separate everything into bubbles.”
As well as having 2 jobs and raising her children on a low income, Trudy is also doing an Open University degree in the hope of becoming a teacher and improving her prospects in the future.
She added: “Buckinghamshire is a very expensive county to live in, but moving away would mean losing the support of my family and disrupting my children. My only choice is to keep working and hope that things get better.”
We are grateful to Restore Hope for helping us with Trudy’s story. Restore Hope is a Christian Charity, based near Chesham, which focuses on inspiring, training and equipping the lives of children, young people and families to fulfil their potential: www.restorehopelatimer.org
2. The long shadow of deprivation
Key findings
-
In this section we consider differences in pay gaps across areas for sons with the same education. If we lived in a meritocratic society, we would expect little difference in pay to remain once we compare sons from different backgrounds with similar educational achievement.
-
We find stark differences in pay gaps between the most and least mobile places, even when comparing sons with the same educational achievement. In the most mobile places there are no remaining pay gaps, while in the least mobile places there remains a pay gap of 8 to 10 percentiles.
-
This means that differences in mobility rates across areas are not driven by differences in educational achievement between sons from the most and least deprived families.
-
In more mobile areas, pay gaps between those sons growing up in the most and least deprived families are entirely driven by differences in educational achievement. How well you do at school determines your life chances, regardless of background.
-
But in areas with low mobility there is a lasting shadow of family circumstance, regardless of educational achievement. Up to 33% of the pay gap is driven by a family background premium, over and beyond educational achievement.
Why do we see such large differences in opportunities across local authorities in England? Most people would expect there to be differences in sons’ adult earnings based on their performance at school, whether they attended university and what course they studied.
Yet when we compare the pay gaps of the most and least deprived sons with the same education, we find a strikingly similar pattern to that explored in Section 1. This suggests the main reasons for differences in social mobility (or the difference in size of the pay gaps between sons from the most and least deprived families) across areas are to be found beyond education – in the labour market.
In more mobile areas, educational achievement alone predicts labour market success – family background has no lasting influence. In the least mobile areas, family background casts a long shadow, predicting labour market success regardless of the educational outcomes sons achieve. The main barriers to labour market success for disadvantaged sons in these areas are yet to be fully researched, but potential explanations include sons from richer families having better social networks, or being better able to move out to areas with higher-paying jobs.[footnote 10]
Figure 2.1: The lasting effect of family background across areas for sons with similar education levels

Figure 2.1 represents the stories of 2 hypothetical pairs of sons: Don and Dave come from a more equal area, with smaller pay gaps by family background, while John and Jim come from an unequal area (larger pay gaps by family background).
John and Don are from more advantaged families – their parents would be considered relatively affluent – while Jim and Dave’s families are at the other end of the social scale. All 4 have the same educational experience, including age 11 test scores, age 16 GCSEs and age 18 A levels, and attended an equally selective university course.
Figure 2.2: Pay gaps at age 28 between the most and least deprived sons at age 16, with the same educational achievement, across local authorities in England where they grew up

Given that they have the same education, the pay gap between Don and Dave is zero in the more equal area – their education experiences are identical and so their pay is identical. But for John and Jim the story is different. John is still paid more than Jim. The fact Jim is from a deprived family has a lasting effect on his pay, despite his education.
So in more mobile areas (those with the smallest pay gaps in Section 1), education differences between the most and least deprived sons account for all of the difference in pay. But in less mobile areas with large pay gaps, education accounts for the same amount of the pay gap as it does in more mobile areas, but there is an additional lasting labour market penalty associated with coming from a deprived family. This may be seen by comparing the darker and lighter areas in Figure 2.2 to those in Figure 1.2. The areas with the largest pay gaps, when comparing sons from the most and least deprived families with the same education, are broadly the same as those with least mobility in Figure 1.2.
Another way to illustrate this is shown in Figure 2.3, which depicts the pay gaps for every local authority in England, from the most mobile (smallest pay gaps) on the left to the least mobile (largest pay gaps) on the right. The dark orange portion of the bars shows the part of the pay gap explained by the difference in educational achievement between sons from the most and least deprived families, while the light orange portion shows the part of the pay gap that persists even when comparing sons with the same educational achievement.
Figure 2.3: Relative contribution of education and wider labour market factors to differences in pay gaps across England
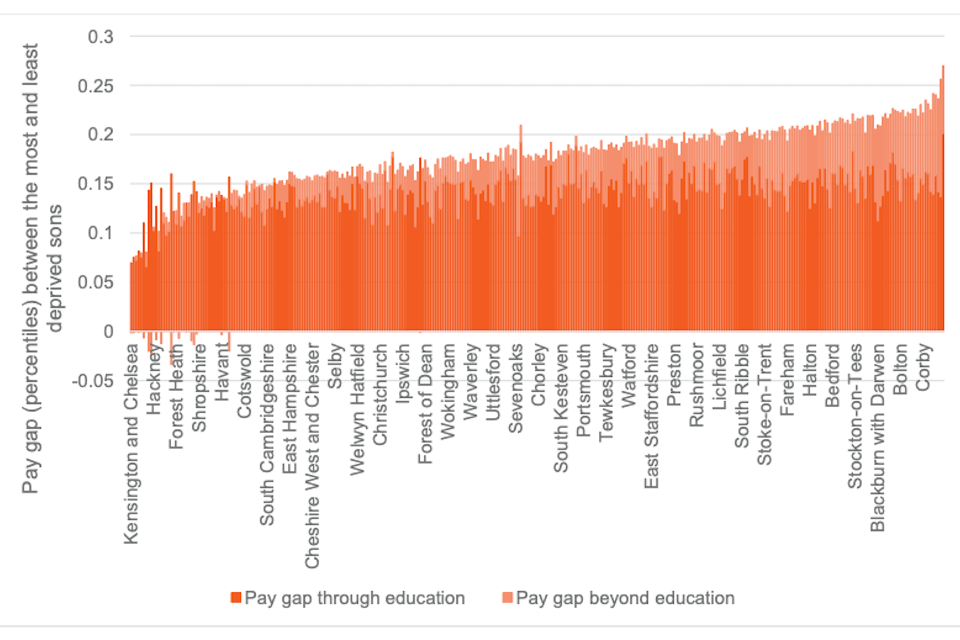
Notes: The bars are shown for all LAs but the LA names are examples along the distribution, as not all bars (LAs) could be labelled due to space constraints. The estimated pay gaps are from regression models where a small number of coefficients are below zero. These are not statistically different from zero, and should be read as zero effects.
The figure clearly shows that while education explains most of the pay gap in every English LA (on average 80% or a stable 10 to 15 percentiles), its contribution is broadly stable across areas. Much of the difference across areas is working through the light orange portion of the bars – the pay gap among sons with the same educational achievement. In the least mobile areas, non-educational factors are relatively more significant.
While it is hard to explore further explanations using our data, and we cannot compare these patterns with those of cohorts born earlier or later, we know that this cohort of sons faced a difficult labour market due to the global financial crisis.
As explained in Section 1, areas with the most unequal opportunities are more deprived and have fewer labour market opportunities in terms of the proportion of people holding professional and managerial roles. We know from other work that sons from the most deprived families are disproportionately affected by bad labour markets. This could be because they lack the informal networks needed to find work when there are fewer jobs available, or because the skills requirements of employers increases in weak labour markets, for example.[footnote 11]
The SMC’s 2020 ‘Moving out to move on’ report showed that more affluent sons from disadvantaged areas were better placed to move to other authorities or regions to capture opportunities not available locally. Individuals like John, then, may be better placed to navigate the limited opportunities available in deprived areas or move to pastures new than people like Jim. This is discussed in more detail in the final section of this report.
If family background is indeed more important when there are limited labour market opportunities, COVID-19 – which is widely expected to lead to a severe recession – might increase pay gaps between the most and least affluent families.
Case study: Claire Carney
Location: Hull
After 6 years of living on Employment Support Allowance, life is a constant struggle for 25-year-old Claire Carney.
Claire, who comes from a working-class background in the Bridlington area, spent part of her childhood in the care system, before moving to Hull when she was 18. She receives just £220 per fortnight, from which she has to pay all her bills, and relies on food parcels delivered by The Warren Youth Project in Hull to survive.
She said: “I’ve had to use soup kitchens. I can’t buy new clothes and I have to go for the cheaper things, which break all the time. I would love to be able to go out for a pub meal now and again or get a takeaway, but I can’t afford it. I don’t even watch TV because I can’t pay for a licence. My sister helps me as much as she can but I don’t have contact with the rest of my family.”
Claire started working when she was 13, but a family bereavement and other family issues have affected her mental health.
“I’m hoping to start working again and want to leave the benefits system,” she said, “but it’s difficult to find a job because I haven’t got the experience that employers are looking for. I’m scared that next year I will have to go onto Universal Credit and I will lose the support from The Warren, because they only help people aged 18 to 25.”
The COVID pandemic has also had an adverse impact on Claire. She has had to spend more time in her flat, which means an increase in utility bills, and has to spend money she can’t afford on disposable masks.
She said: “Life just isn’t liveable at the moment for younger people on benefits. The system isn’t working for young people. I would like someone from the government to spend a month living on benefits – that’s the only way they will understand what life is really like for people like me.”
We are grateful to The Warren for helping us with Claire’s story. The Warren is a charity supporting marginalised, vulnerable and disadvantaged young people in Kingston upon Hull.
3. Education, education, education?
Key findings
-
Across all areas, education is a key driver of pay gaps between sons from different backgrounds, accounting for a stable amount of the adult pay gap (10 to 15 percentiles, or on average 80%) in all local authorities.
-
There are also large differences in the size of educational achievement gaps between sons from the most and least deprived families across areas.
-
Areas with a higher proportion of grammar schools and more-segregated schools, have the largest educational achievement gaps. Sons from affluent families in these areas achieve much higher GCSE results than sons from deprived families in the same area.
-
Cities, and Inner London in particular, have the smallest educational achievement gaps. While sons from affluent families still typically achieve higher GCSE results than sons from deprived families, the differences are far less stark – the gap is around 40% of that found in the most unequal areas.
As explained previously, educational achievement remains the most important driver of pay gaps between sons from richer and poorer families in all areas of England.
Educational achievement cannot, however, explain fully why these pay gaps vary across areas. The contribution of education to driving the link between sons’ childhood family circumstances and their adult earnings varies much less than the overall pay gap across places.[footnote 12] Yet there are still significant differences in the gaps in educational achievement between the most and least deprived sons across areas.
Education gaps between most and least deprived sons
In this section, we show how differences in educational achievement of the most and least deprived sons at age 16 vary across areas of England.[footnote 13]:
While patterns of education gaps (Figure 3.1) have some similarities with patterns in pay gaps across areas (Figure 1.2), most notably in Inner London, there are also some clear differences across England. Places with the largest pay gaps between the most and least deprived sons are not necessarily those with the largest gaps in educational achievement among the most and least deprived sons across areas.
Across the country, sons from affluent families perform significantly better than those from the most deprived families, scoring on average 41 percentiles higher in the age 16 (GCSE) test score distribution. As with earnings gaps, the national picture hides large differences in educational achievement across local authorities – even between local authorities very close to each other or even adjacent.
In North Dorset, a 37 percentile difference between education outcomes compares with 48 percentile differences in Poole and Bournemouth. Similarly, in Manchester the difference is 37 percentiles, compared with 48 in Trafford. On the North Yorkshire coast, East Riding reports a 39 percentile difference compared with 49 percentiles in nearby Scarborough.
Those local authorities with the largest education gaps have a difference of over 50 percentiles in the age 16 (GCSE) performance of the most and least deprived sons in the areas (see Table 3.1). Half of these local authorities also have large pay gaps between the most and least deprived sons, but the other half have below-average pay gaps.
Local authorities with large educational inequalities tend to have greater school segregation in terms of both achievement and socio-economic status, compared with areas with more equal educational achievement. They are also more likely to have grammar schools:[footnote 14] 7 of the 10 local authorities with the largest education gaps have grammar schools (Lewes, Windsor and Oxford do not). Southend-on-Sea and Tunbridge Wells, also grammar school areas, just miss the list of the 10 areas with the largest gaps, but still have some of the largest differences in educational achievement in the country.
Figure 3.1: Education gaps between the most and least deprived sons at age 16, across local authorities in England
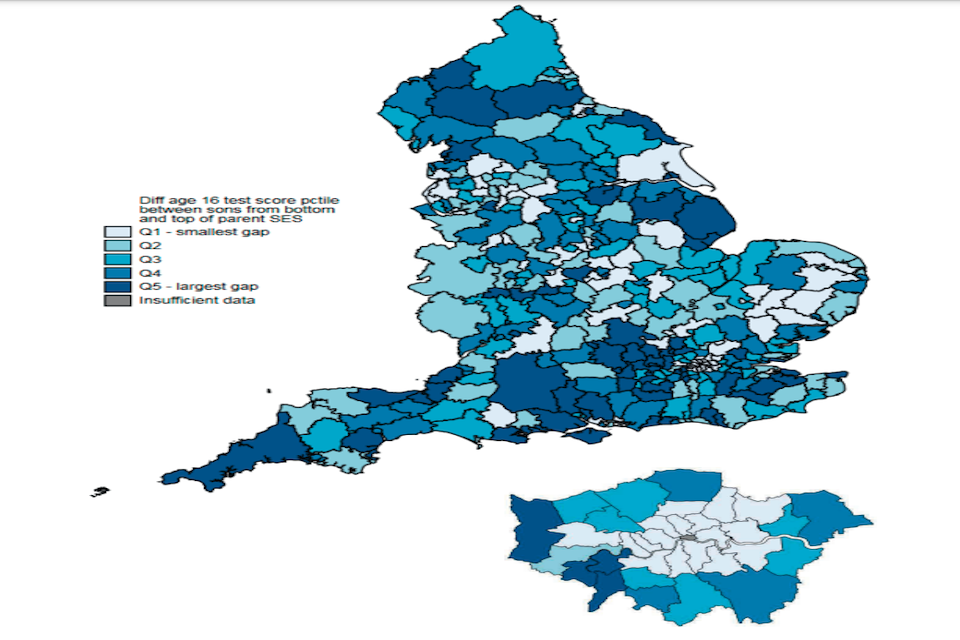
Table 3.1: Local authorities with the smallest and largest education gaps at age 28 between the most and least deprived sons at age 16, by where they grew up
Local authorities with the smallest education gaps (education gaps between the most and least deprived sons of 19 to 28 percentile points)
- Camden
- Hackney
- Hammersmith and Fulham
- Islington
- Kensington and Chelsea
- Lambeth
- Southwark
- Tower Hamlets
- Wandsworth
- Westminster
Local authorities with the smallest education gaps outside of London (education gaps between the most and least deprived sons of 32 to 36 percentile points)
- Blackburn
- Blaby
- Erewash
- Harlow
- High Peak
- Mid Suffolk
- North Kesteven
- South Derbyshire
- South Norfolk
- South Northamptonshire
Local authorities with the largest education gaps (education gaps between the most and least deprived sons of 51 to 57 percentile points)
- Chiltern
- East Lindsey
- Epson and Ewell
- Lancaster
- Lewes
- Oxford
- South Bucks
- Torbay
- Windsor and Maidenhead
- Wycombe
Perhaps unsurprisingly, given the literature looking at the ‘London effect’ highlighting that disadvantaged pupils in London outperform their peers in other parts of the country,[footnote 15] Inner London boroughs make up all of the 10 local authorities with the smallest differences in education outcomes between the most and least deprived sons, with gaps in education outcomes of 20 to 28 percentiles. This is about a third to half the size of the gaps seen in local authorities with the largest gaps in educational achievement. All the top-performing boroughs also have small pay gaps. These areas offer more equal education and pay between the poorest and richest sons. More generally, areas with smaller education gaps are more densely populated and have a higher proportion of non-white students.
Case study: Kirsty Young
Location: East Riding
Kirsty Young, 34, from East Riding of Yorkshire has turned her life around – thanks to the support and belief of her local college.
Kirsty, who now lives in Bridlington, ran away from home after leaving school and ended up being groomed. She had 3 children when she was still young and, after a failed marriage, was a single parent and full-time mother for many years.
She said: “I was saved and started a course at East Riding College. They encouraged me to go to university, which I never thought I could do, and now I work part time at the same college as a learning support adviser. I get £8.92 an hour, but only during term time.
“My contract is for a minimum of 12 hours a week, but there are lots of hours available. I support people on EHCP [Education, Health and Care Plan] plans within their chosen course.”
Now remarried and with a fourth child aged 5, Kirsty is looking forward to studying for a PGCE (Postgraduate Certificate in Education) in teaching, with the aim of boosting her earnings by becoming a fully qualified teacher.
“During COVID I’ve been working from home. Fortunately, my husband works in manufacturing and he has been busier than ever, so it hasn’t affected us financially,” she added.
“There is more work in Bridlington compared to some places, but most of the jobs are in the care sector and hospitality or are seasonal in caravan parks. Some of the shops and restaurants have had to close down altogether.
“I was lucky that the college helped and supported me to get where I am today. I think charities should receive more support for the communities they work with to help with skills like CV building. It shouldn’t have anything to do with where you live or your background.”
We are grateful for help with Kirsty’s story from East Riding College – one of the UK’s top 20 general further education colleges for achievement: www.eastridingcollege.ac.uk
4. Policy challenges
Key findings
-
To equalise opportunities for those from the most and least deprived backgrounds, reducing education inequalities continues to be crucial. But in order to ‘level up’ between the places which have the widest income disparities for advantaged and disadvantaged young people, it is labour market interventions that will make the difference.
-
In the areas of greatest inequality, educational investment alone is not enough to remove differences in life outcomes between areas.
-
Areas with lower pay for disadvantaged sons and less equal opportunities are very deprived, with fewer education and labour market opportunities.
-
This work has set the ball rolling by identifying a group of smaller cities and towns that offer very little opportunity. Further investigations are needed to fully understand the barriers to opportunities, particularly in the labour market, in these places.
In this report we have demonstrated large differences in the pay of disadvantaged sons based on where they grew up, and large differences in the pay gaps between these sons and their counterparts from more affluent families who grew up in the same area.
We have also shown that while education gaps between the most and least disadvantaged sons account for a significant proportion of the pay gaps found throughout the country, they cannot explain the differences in pay gaps between places.
If we were to close the attainment gap between sons of the poorest and richest families in each area, gaps in earnings outcomes would be significantly reduced, but differences in pay gaps between local authorities would remain.
To equalise opportunities for those from the most and least deprived backgrounds, driving up education quality and continuing to close the attainment gap will be crucial. But to ‘level up’ between places, these actions need to be supplemented with wider-ranging policy interventions primarily to enable better labour market participation and access.
The importance of education in social mobility has been widely recognised, and many initiatives aim to reduce educational inequalities. But to create a truly socially mobile country, it will also be important to understand what barriers prevent equally achieving deprived sons from succeeding in the labour market in certain areas of the country. It will be important to understand how the value of having good GCSEs, A Levels, or NVQs and other technical qualifications, and the job opportunities this opens up, varies across the country. These findings further raise the questions of which areas national policy-makers should focus on, but also how different tiers of local service delivery should be shaped responsively in light of the evidence. In this section, we discuss the answers we are able to provide to these questions and highlight areas where further investigation and data are needed.
Barriers to equal achievement in the labour market
Figure 4.1 illustrates the key finding that while education explains a large part of the pay gap nationally, it does not account for the differences in pay gaps across local authorities. Here we use 3 examples from Figure 2.3.
Figure 4.1: The role of education and wider labour market factors in accounting for differences in pay gaps across local authorities in England
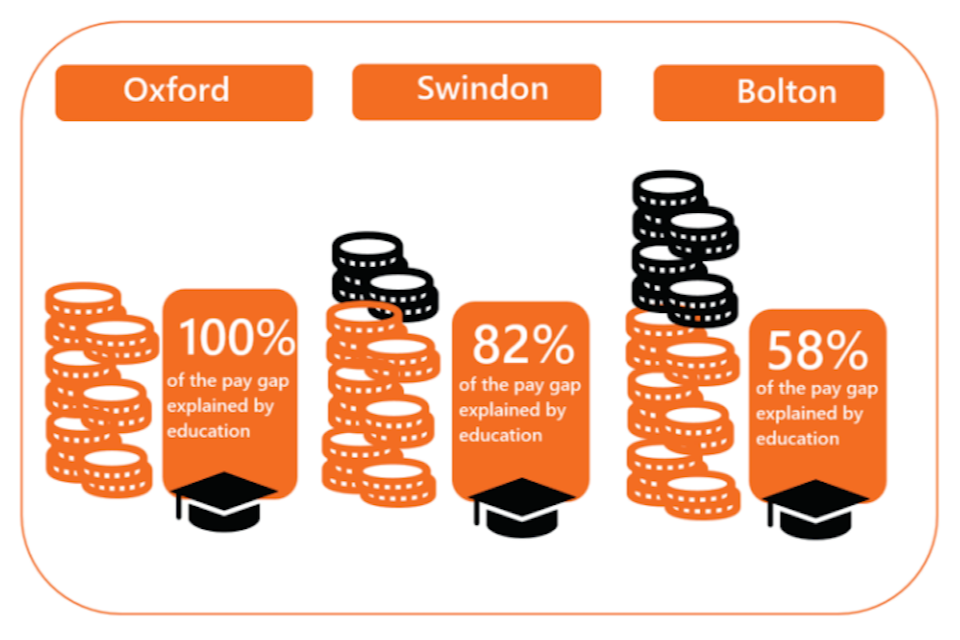
On the left of the figure, Oxford is an example of a place where social mobility is high, with the smallest pay gaps – it is in the top 10 places with the smallest pay gaps outside London, as shown in Table 1.2. Swindon represents a place with average pay gaps and mobility, while on the right, Bolton represents a place with large pay gaps and less mobility.
In all 3 authorities, the proportion of the pay gap explained by education (the orange part of the coin stack) is the same (around 14 percentiles). But because total pay gaps are smaller in Oxford, education explains a larger proportion of the pay gap there compared with Bolton. The main difference between the most and least mobile areas is the black part of the coin stack – the role of family background that persists beyond education into the labour market.
This finding challenges the notion that educational investment alone will remove differences between areas. Education gaps account for most of the pay gaps in all areas, and reducing these is important in and of itself. However, we also need to look at equalising labour market opportunities available for young people with the same education level as those from richer backgrounds if we are to ‘level up’ between places. Beginning to tackle this gap requires us to understand what drives it – only then can we design effective interventions that address the specific roots of intergenerational disadvantage.
While the current report does not allow us to disentangle the drivers of this gap, we highlight several potential channels through which family disadvantage may impact earnings over and above educational attainment. More research will be needed to determine the relative importance of each of these channels, and indeed of others not mentioned here.
Sons from deprived backgrounds may lack family connections that help them to learn about and gain good jobs.[footnote 16] They may lack examples within their immediate network of the diversity of jobs available, or they may lack knowledge of the differentials in income and life quality between different jobs or industries. This can leave young people from deprived backgrounds with a smaller frame of reference from which to develop and make choices.
Such inequalities in social capital could be exacerbated by those from deprived families having poorer soft skills – putting them at a disadvantage when it comes to networking, interviews and securing well-paid jobs.[footnote 17]
As shown in Section 1, the least mobile areas are also those with the fewest high-skilled jobs. We also recognise that skills and connections may be particularly valuable in these areas to access the few good jobs available. As such, increasing the number of available skilled jobs could be another channel through which deprived individuals might be more able to access better jobs. Any comprehensive strategy to attain this will require coordination between government and employers, and a conversation on skills, training, apprenticeships and adult education provision in localities and how this can be made to best align with the needs of local employers.
Government has a powerful role to play in this space, not simply as the setter of policy direction but as a major employer. The civil service has already done some work rebalancing its workforce geographically, with some departments having a substantial presence outside of London, but a long-run shift to further homeworking would open up new opportunities that could spread the availability of high-quality jobs more widely across the country. What would it mean for areas such as Bradford or Hyndburn if its residents could more easily work in well-paid public sector jobs? If, as was recently suggested in the SMC’s ‘Moving out to move on’ report,[footnote 18] advantaged sons are currently more likely, able and willing to move to scoop up the limited supply of professional jobs, how much more might we improve access if the trade-off between family and community connection was reduced because more professional government jobs could be done remotely?
Differences between schools attended by pupils from different socio-economic backgrounds may also play a role alongside individual differences in social capital and non-academic skills. State schools in deprived areas may have fewer resources to spend on enrichment and career development activities for their pupils, leaving them relatively ill- equipped to enter the labour market.[footnote 19]
Sons from deprived backgrounds may lack the financial capital available to more affluent sons to explore various job opportunities in the early stage of their career. A recent book by sociologists Sam Friedman and Daniel Laurison[footnote 20] describes this factor as “the Bank of Mum and Dad”, and outlines various benefits of having parental financial backing at a precarious time in children’s careers – for example, the ability to pursue unpaid or low-paid internships.
Higher costs may also deter people from less advantaged backgrounds from moving to seek good opportunities elsewhere. The SMC report ‘Moving out to move on’ suggests that when individuals from deprived areas (which we find to also have the lowest social mobility) do move, it is mainly towards other deprived areas.
Employers may have recruitment and retention policies in place that favour sons from more advantaged backgrounds. They may advertise vacancies selectively, through either school or professional networks that are disproportionately accessed by more advantaged pupils.[footnote 21]
Particular recruitment practices may put deprived individuals at a disadvantage. For example, some firms state qualifications in their job adverts that are not necessary for the job.[footnote 22] Other employers are still not advertising all their work experience and internship opportunities, instead hiring through personal networks. Shifts in such employer behaviours might help broaden the opportunities available. Studying at which stage in the recruitment process of large firms individuals from poorer backgrounds fail to progress will help us understand how employers’ recruitment policies can be made more inclusive (see work by Ashley et al[footnote 23]). If for example a lack of applications is an issue, policies such as
increasing outreach in further education colleges or non-Russell Group universities might be an effective tool for getting more individuals from deprived backgrounds into graduate jobs.[footnote 24]
There may also be barriers to retention and progression within firms for employees from the most deprived families. Friedman and Laurison’s book highlights the practice of senior leaders sponsoring junior protégés with a ‘class-cultural affinity’ to fast-track their careers. This observed difference in cultural capital could be allowing those from more advantaged backgrounds to get further in a firm than their disadvantaged counterparts.
Which areas should policy-makers focus on?
Our research has shown wide disparities in the adult outcomes of deprived sons depending on where they were born – in terms of both their earnings outcomes and how they fare relative to more affluent sons from the same place.
This strongly affirms the need for place-based policies. In the context of limited resources, an important question for policy-makers is who to focus on, or at least who to focus on first.
While ideally we strive for areas to have both higher pay for disadvantaged sons and smaller pay gaps between them and sons from more affluent families, how useful are small pay gaps if pay is low for all? Similarly, how promising is higher pay for the most disadvantaged sons, if the pay gap between them and the least deprived is large?
Ultimately, the answer to these questions will depend on policy-makers’ and society’s objectives, but the research we have conducted can help identify geographical areas in dire need of support because they offer both very poor and very unequal opportunities to disadvantaged sons.
To understand the multiple issues faced by each area, we consider both our metrics together (Figure 4.2). Over half of English local authorities have higher pay for disadvantaged sons and more equal opportunities compared with national rates (top left). While many of our best-performing local authorities are in London, we also see areas to celebrate outside London: Cherwell, East Cambridgeshire, South Derbyshire, South Gloucestershire and West Oxfordshire all have better-than-average opportunities for disadvantaged sons.[footnote 25]
The remaining half are split evenly between areas with higher pay for disadvantaged sons but less equal opportunities; areas with more equal opportunities but lower pay for this group; and areas with less equal opportunities and lower pay combined.
Areas with higher pay for disadvantaged sons but less equal opportunities (top right) have similar characteristics to those areas with higher pay and more equal opportunities: they have similarly low levels of deprivation, a similar population density, and similar education and labour market opportunities.
Areas with lower pay for disadvantaged sons but more equal opportunities (bottom left) look demographically different from those with higher pay for disadvantaged sons: they are more deprived and more densely populated, but they have similar levels of education and labour market opportunities.
Figure 4.2: Combining pay of disadvantaged sons and equality of opportunities across areas

Notes: If we exclude London boroughs, areas with lower pay for disadvantaged sons and smaller pay gaps (bottom left) are less likely to be the most deprived areas based on the Index of Multiple Deprivation (15% in ‘Most deprived areas’, rather than 22%). The only other significant differences across groups with the removal of London boroughs are changes to population density (these become: top left, 7; top right, 11; bottom left, 14). No London boroughs feature in the bottom-right group.
But areas with low pay for disadvantaged sons and less equal opportunities (bottom right) are very different in terms of demographics, education and labour market opportunities.
These places are very deprived, have moderate population density, and starkly lower education and labour market opportunities, with far fewer ‘Outstanding’ schools and far fewer professional occupations than the other areas. By combining metrics on pay for the most disadvantaged and on equality of opportunities, we can identify a particular group of big towns and smaller cities offering very little opportunity for anyone, but particularly for the most deprived.
How does the current policy landscape tie in?
A recent policy initiative has recognised the limited opportunities available in towns relative to larger cities. The Towns Fund prospectus highlights that while successive governments have focused on cities as engines of economic growth, many struggling towns do not have the resources to build a strong local economy.[footnote 26] The Towns Fund is therefore a promising initiative to use public investment, through Town Deals, to create the right conditions to encourage private investment by improving transport, labour force skills, and housing and commercial land availability.[footnote 27]
The majority of the 50 LAs with low pay for disadvantaged sons and less equal opportunities are named in the list of an initial 100 Town Deals across England, including Bolton, Dudley, Hastings, Rochdale, St Helens and Wolverhampton. But many of the other LAs with low mobility, such as Hyndburn and Gateshead, do not qualify. Government may wish to revisit the criteria used for the fund to ensure that it is getting to the places that need it most, and should be explicit about how the fund can improve social mobility.[footnote 28] While Local Enterprise Partnerships (LEPs) play a key role at a more aggregate level in contributing to local economic strategies, the variation in pay and pay gaps within local areas suggests that this localised approach is an effective way of ensuring that funds are targeted where they are most needed.
Further, a recent place-based initiative focused on improving social mobility in specific areas – Opportunity Areas[footnote 29] – targeted 12 local authorities defined as ‘challenging’, with multiple disadvantages across the life course. These areas received targeted investment (£72 million over 3 years) to provide tailored interventions, primarily to young people, to address stubborn local challenges and create “sustainable, long-term change”. The metric used to short-list candidates for this investment, the Social Mobility Index, combined information on area-level early years provision; the school performance of disadvantaged pupils; post-compulsory education and employment rates of disadvantaged pupils; and labour market indicators including pay, house prices, professional occupations and home ownership.[footnote 30]
We find that 9 of the 12 Opportunity Areas fall into our bottom-right group, offering both lower pay for disadvantaged sons and less equal opportunities. The 3 which do not fall into this group – Norwich, Ipswich and West Somerset – have poor education outcomes for disadvantaged sons but relatively good earnings outcomes. For example, both Ipswich and West Somerset have higher pay for disadvantaged sons and more equal opportunities, putting them firmly in the top-left box of Figure 4.2. Norwich has lower life chances for disadvantaged sons but more equal opportunities in the form of small pay gaps between the most and least deprived sons (bottom left).
If effective, the interventions within Opportunity Areas have the potential to reduce educational disadvantage in areas with the poorest and least equal opportunities for deprived individuals. This would already be an important step towards reducing part of the disadvantage gap in those areas.
Increasing public investment to encourage private investment through the Towns Fund is promising, given our analysis identifies a group of towns that offer the lowest pay for disadvantaged sons and the least equal opportunities. But education-focused or labour- market-focused programmes alone are unlikely to be as effective as those drawing together multiple departments for a life-course-based approach to creating opportunities.
Existing programmes make a good start at targeting some of the poorest-performing areas in terms of social mobility. However, we find that several of the areas with the poorest opportunity for disadvantaged sons are not currently covered by these interventions. 5 of the worst areas for social mobility are not within the Opportunity Areas programme: Bolton, Chiltern, Gateshead, Hyndburn and Thanet. Similarly, although 80% of the areas in the bottom quintile for both pay gaps and pay for disadvantaged sons are covered by the Towns Fund, this misses Chiltern, Hyndburn and Gateshead, as well as Wigan and Hull.
There is also a significant risk that existing interventions are likely to be dwarfed by the impact of the COVID-19 recession. Current estimates suggest this is likely to be the largest recession in history, far deeper than the Great Recession experienced by our cohort of sons. If the lack of labour market opportunities reinforces the importance of family background, we might expect to see growing inequalities across the country. This means that it is the right time not only to ask if the right areas are being funded but to review and revise our collective thinking about the scale of investment needed to meaningfully change outcomes. There is an urgent need to increase the knowledge we have about the best ways we can remove labour market barriers for today’s young people from deprived backgrounds and implement interventions that can protect them from the disproportionate impact of these recessions. The Social Mobility Commission commits to contributing as much work as it can to support better decision-making for all those who want to work with us to make this work better.
5. Conclusion
Policy suggestions
-
Government should use this new evidence to inform policy about the scale and size of its place-based interventions and investment. Evidence from this research pinpoints localities where inclusion in expanded programmes might make the most difference. In the areas of greatest inequality, educational investment alone is not enough to remove differences in life outcomes between areas.
-
In the localities with the most unequal outcomes, we need to do more to understand why the labour market is not serving disadvantaged young people. This should include both drawing on local authority leaders’ knowledge and data, and research by central government and independent organisations to trial ‘what works’ labour market interventions.
-
Evidence is a critical element to inform good decision-making. Government should continue improving the quality of data collection and linkages necessary to analyse social mobility well. We should aspire to be global leaders emulating the best of what the Scandinavian model has to offer.
This research, taken together with our 2020 report ‘Moving out to move on’, is part of the Commission’s contribution to expanding our country’s knowledge on how social mobility is shaped by place. This work has thrown up the stark differences in pay and life chances for people growing up in neighbouring areas just miles apart.
50 local authorities have both very low levels of pay for those from disadvantaged backgrounds and a big pay gap between those from poorer and more affluent families. It is in these areas – the ‘coldest’ spots in the country – where this report provides a clear roadmap of priority areas where local politicians, metro mayors and employers can choose to redouble their efforts.
At the national level, government has made some useful inroads to addressing disparities of place. Both the Towns Fund and Opportunity Areas have made a helpful contribution and started to shift the dial in places where geographical disadvantage is entrenched. The good news is that many of the coldest spots are being addressed by existing interventions.
This research shines a spotlight most clearly on the areas not covered by these
programmes. We believe they should be at the top of the government’s priority list when considering any expansion of support. We also hope that government heeds the analysis in this report.
The findings of this report align with the Commission’s monitoring of social mobility, and with previous recommendations to embed social mobility into the delivery process and outcomes data (such as in the Towns Fund) and to think beyond educational levers to address social mobility (such as in Opportunity Areas). There is a significant opportunity for government to expand some excellent work. We hope that it takes this opportunity.
The data from this report constitute a new resource that we hope local and regional leaders will draw on to enhance and expand their understanding of what is going on in their locality. We hope that the report provides them with insights that will inform their strategies moving forward. While the evidence we have assembled here can help them to accurately pinpoint the priority areas, their local knowledge and know-how will be needed to inform bespoke interventions that work in their localities to address the worst inequalities.
This could be through schools and universities working more closely with local employers to ensure that skills are tailored to local needs and that those from deprived backgrounds are not overlooked. Fully advertised and paid internships, expanded access to work experience and apprenticeships targeted at the most disadvantaged should all be explored.
The role of LEPs should not be underestimated. In many cases, the issue at hand is the further enhancement of local labour market opportunities for young people, and the support some need to reach out for the opportunities that already exist. We think LEPs are well positioned to be at the forefront of evolving local offers.
Employers in these cold spot areas and nearby also have a significant role to play. We know that people from lower socio-economic backgrounds are often overlooked, undertrained and underpromoted. Employers can use our toolkit to better access talent at their doorstep and gain the competitive edge that greater diversity brings. They could do this by targeting outreach activities to the coldest spots or by creating flexible working policies to access talent across the country, among other things. We encourage employers, and the LEPs and local authorities that work with them, to use our toolkit to unlock potential and gain competitive advantage in these areas.[footnote 31]
The Social Mobility Commission wants to work with government, local authority leaders, metro mayors, community leaders and employers over the next few months to identify how we can make this information count in our shared pursuit of creating greater opportunities and boosting social mobility in every part of the nation.
Appendix 1: The data improvements we need
While the current LEO dataset has been a step change in the available data to enable researchers to investigate social mobility differences, 3 main improvements to the LEO dataset would benefit future research in this area.
-
We are currently unable to address the contribution of internal migration to the regional differences in earnings gaps we unveiled in this analysis. This is because our data contain information only on where individuals grew up, and not on where they live as adults. Adding this information (available in tax records) would enable further investigation of the role of internal migration and differences in geographic mobility in explaining patterns of social mobility.
-
We can only measure differences in opportunities for men in England. This is because (a) we cannot observe non-earned income or hours worked, and women from disadvantaged backgrounds are more likely to work part time at the age we observe (28), and (b) linked administrative data records are only available in England. Hours of work are not available in administrative records, but bringing in non-earned income, such as benefit income, and creating identifying variables would allow researchers to link individuals in households and measure total family income. This would bring women into the picture and give a richer measure of family resources. Creating similar data linkages in the other home nations would allow for this research to be conducted across the whole of the UK.
-
The lack of linkage between parents’ and children’s records does not currently allow researchers to measure parental income in childhood, restricting them to using proxies of income such as measures of family deprivation based on FSM eligibility and local area deprivation, as used in this report. Creating identifying variables that link between generations would allow for a richer picture of childhood circumstances, including investigations into the ages in childhood at which family deprivation is particularly crucial to a child’s future outcomes.
We encourage government departments across all home nations to build this type of data linkage into their future plans. This type of linkage is available in, for example, Scandinavian registry data.
Appendix 2: Methodology notes
-
We used the Longitudinal Education Outcomes (LEO) data for all state-educated men born between 1986 and 1988.
-
We focused on pre-tax annual earnings (including zeros) at age 28 as our main outcome.
-
It was not possible to provide reliable estimates of social mobility for women, as the annual earnings measures in the LEO dataset cannot be adjusted for part-time work (and part-time work among women at age 28 is related to childhood family circumstances).
-
We measured family circumstances at age 16 by combining information on Free School Meal (FSM) eligibility at this age and small-area-level deprivation measures from the 2001 census.
-
We were not able to identify home residence or measure detailed family circumstances for children in private schools, hence all analysis focused on state school pupils only.
-
We estimated outcomes for the group of pupils eligible for FSMs at age 16. This individual-level measure of family circumstances at age 16 is a common indicator of disadvantage; parents who claim FSM are typically on out-of-work benefits. Around 14% of the school population were eligible for FSM at age 16 in the cohorts included in this analysis.
-
We measured educational achievement by measuring points score on the best 8 GCSEs (or equivalent) at age 16.
-
We define area as lower-tier local authorities in England and provide regional estimates of mobility across the 326 lower-tier local authorities in England.
-
We measure adult earnings, pay gaps and education gaps for sons based on the local authority they lived in at age 16. This is because destination region is not yet available in our data. This means that our measures include within them the possibility that sons move areas to seek greater opportunities.
Appendix 3: Technical definitions
-
Defining deprived sons: We defined deprived sons with an index of family disadvantage, as we did not have data on parents’ earnings directly. We combined sons’ FSM eligibility at age 16 with local area deprivation measures into a single index of parent socio-economic status (SES), or ‘family circumstance’. To examine the pay gap and education gap, we compare sons from the top and bottom of this parent SES score. To examine the earnings of deprived sons, we use FSM eligibility of the sons at age 16, which captures sons from approximately the bottom 13 to 14% of family earnings. The Technical Report covers these measures and their rationale in detail.
-
Earnings of disadvantaged sons: Median earnings at age 28 of sons who were eligible for FSM at age 16. This metric provides a measure of life chances, or how well sons with disadvantaged parents do in the labour market.
-
Pay gaps between the most and least deprived sons: The relative difference in adult earnings at age 28 between sons from the most and least deprived families based on our measure of family circumstances. We use ordinary least squares (OLS) regressions to estimate the percentile increase in sons’ earnings associated with a one-percentile increase in family circumstances. In the report we scale this by 100, equivalent to showing how much higher up in the earnings distribution sons from the least deprived families are at age 28 compared with sons from the most deprived families. A bigger difference means family circumstances at age 16 are more important for outcomes at age 28, so mobility is lower.
-
Pay gaps between the most and least deprived sons with the same education: The difference in adult earnings at age 28 between sons from the most and least deprived families who have the same educational achievement. A bigger difference means family circumstances at age 16 are more important for outcomes at age 28, regardless of the education that the son achieves.
-
Education gaps between the most and least deprived sons: The relative difference in education percentiles in the age 16 test score distribution for men from the most deprived families compared with men from the least deprived families based on our measure of family circumstances. We use OLS regressions to estimate the percentile increase in the sons’ test scores associated with a one-percentile increase in family circumstances. Throughout the report we scale this by 100, equivalent to how much higher up in the test score distribution sons from the least deprived families are compared with sons from the most deprived families.
Appendix 4: Regional maps and tables
North-east
| No. on map | Local authority name | Median age 28 earnings FSM son (£) | Quintile pay gap | Quintile pay gap condl on educn | Quintile education gap | No. of sons in sample | No. of FSM sons in sample |
| 1 | County Durham | 10,600 | 4 | 4 | 5 | 8,785 | 1,446 |
| 2 | Darlington | 14,400 | 3 | 2 | 4 | 1,656 | 221 |
| 3 | Gateshead | 9,700 | 5 | 5 | 2 | 3,235 | 591 |
| 4 | Hartlepool | 10,400 | 4 | 4 | 2 | 1,837 | 351 |
| 5 | Middlesbrough | 12,800 | 4 | 2 | 5 | 2,862 | 776 |
| 6 | Newcastle upon Tyne | 11,200 | 2 | 1 | 3 | 3,923 | 757 |
| 7 | North Tyneside | 12,400 | 2 | 2 | 1 | 3,246 | 460 |
| 8 | Northumberland | 11,900 | 2 | 2 | 3 | 5,436 | 546 |
| 9 | Redcar and Cleveland | 12,700 | 4 | 3 | 2 | 2,728 | 546 |
| 10 | South Tyneside | 13,200 | 3 | 5 | 2 | 2,769 | 553 |
| 11 | Stockton-on-Tees | 11,200 | 5 | 5 | 1 | 3,683 | 596 |
| 12 | Sunderland | 11,300 | 4 | 4 | 3 | 5,446 | 708 |
North-west
| No. on map | Local authority name | Median age 28 earnings FSM son (£) | Quintile pay gap | Quintile pay gap condl on educn | Quintile education gap | No. of sons in sample | No. of FSM sons in sample |
| 1 | Allerdale | 15,100 | 2 | 2 | 4 | 1,643 | 185 |
| 2 | Barrow-in-Furness | 11,400 | 5 | 5 | 3 | 1,302 | 264 |
| 3 | Blackburn with Darwen | 11,700 | 5 | 5 | 1 | 2,742 | 701 |
| 4 | Blackpool | 10,500 | 5 | 5 | 2 | 2,305 | 389 |
| 5 | Bolton | 11,000 | 5 | 5 | 1 | 4,910 | 689 |
| 6 | Burnley | 13,700 | 5 | 5 | 3 | 1,861 | 360 |
| 7 | Bury | 12,600 | 4 | 5 | 2 | 3,189 | 360 |
| 8 | Carlisle | 11,600 | 2 | 2 | 5 | 1,695 | 171 |
| 9 | Cheshire East | 14,100 | 3 | 2 | 4 | 5,169 | 369 |
| 10 | Cheshire West and Chester | 13,900 | 2 | 2 | 2 | 5,474 | 560 |
| 11 | Chorley | 13,600 | 3 | 4 | 3 | 1,783 | 166 |
| 12 | Copeland | 14,100 | 4 | 1 | 3 | 1,252 | 206 |
| 13 | Eden | 16,800 | 1 | 1 | 5 | 794 | 32 |
| 14 | Fylde | 14,200 | 3 | 3 | 1 | 1,006 | 70 |
| 15 | Halton | 13,100 | 5 | 5 | 1 | 2,640 | 535 |
| 16 | Hyndburn | 9,600 | 5 | 5 | 2 | 1,486 | 228 |
| 17 | Knowsley | 13,500 | 4 | 5 | 4 | 3,243 | 1,087 |
| 18 | Lancaster | 12,700 | 4 | 2 | 5 | 2,238 | 246 |
| 19 | Liverpool | 10,700 | 3 | 2 | 3 | 8,187 | 2,659 |
| 20 | Manchester | 10,700 | 1 | 1 | 1 | 6,661 | 2,677 |
| 21 | Oldham | 10,700 | 5 | 5 | 1 | 4,018 | 811 |
| 22 | Pendle | 11,500 | 5 | 5 | 1 | 1,751 | 317 |
| 23 | Preston | 12,600 | 4 | 5 | 2 | 2,261 | 352 |
| 24 | Ribble Valley | 18,800 | 2 | 3 | 1 | 935 | 35 |
| 25 | Rochdale | 11,800 | 5 | 5 | 1 | 3,951 | 875 |
| 26 | Rossendale | 12,200 | 2 | 2 | 2 | 1,353 | 158 |
| 27 | Salford | 12,300 | 4 | 5 | 2 | 3,622 | 703 |
| 28 | Sefton | 13,800 | 3 | 5 | 1 | 5,042 | 848 |
| 29 | South Lakeland | 12,600 | 2 | 3 | 4 | 1,540 | 83 |
| 30 | South Ribble | 17,200 | 4 | 4 | 4 | 2,051 | 104 |
| 31 | St. Helens | 11,600 | 5 | 4 | 2 | 3,319 | 592 |
| 32 | Stockport | 14,100 | 3 | 2 | 3 | 4,768 | 522 |
| 33 | Tameside | 13,000 | 5 | 5 | 2 | 4,114 | 640 |
| 34 | Trafford | 12,400 | 4 | 3 | 5 | 3,786 | 414 |
| 35 | Warrington | 15,400 | 5 | 5 | 2 | 3,573 | 282 |
| 36 | West Lancashire | 14,600 | 2 | 3 | 1 | 2,022 | 263 |
| 37 | Wigan | 11,900 | 5 | 5 | 3 | 5,769 | 776 |
| 38 | Wirral | 12,800 | 4 | 3 | 4 | 6,159 | 1,650 |
| 39 | Wyre | 10,500 | 4 | 4 | 4 | 1,812 | 158 |
Yorkshire and the Humber
| No. on map | Local authority name | Median age 28 earnings FSM son (£) | Quintile pay gap | Quintile pay gap condl on educn | Quintile education gap | No. of sons in sample | No. of FSM sons in sample |
| 1 | Barnsley | 13,000 | 5 | 4 | 4 | 4,001 | 704 |
| 2 | Bradford | 9,500 | 5 | 5 | 2 | 8,969 | 2,024 |
| 3 | Calderdale | 10,800 | 4 | 4 | 2 | 3,429 | 496 |
| 4 | Craven | 1 | 2 | 4 | 845 | ||
| 5 | Doncaster | 12,000 | 4 | 3 | 5 | 5,346 | 770 |
| 6 | East Riding of Yorkshire | 14,600 | 2 | 3 | 1 | 5,473 | 343 |
| 7 | Hambleton | 14,800 | 2 | 2 | 3 | 1,371 | 56 |
| 8 | Harrogate | 18,000 | 2 | 2 | 4 | 2,337 | 67 |
| 9 | Kingston upon Hull, City of | 12,500 | 5 | 5 | 5 | 4,782 | 961 |
| 10 | Kirklees | 11,700 | 5 | 5 | 1 | 6,923 | 1,047 |
| 11 | Leeds | 11,000 | 4 | 3 | 4 | 11,647 | 1,876 |
| 12 | North East Lincolnshire | 12,200 | 5 | 5 | 4 | 3,389 | 550 |
| 13 | North Lincolnshire | 14,000 | 5 | 5 | 4 | 3,019 | 355 |
| 14 | Richmondshire | 3 | 4 | 2 | 710 | ||
| 15 | Rotherham | 12,200 | 5 | 5 | 3 | 4,722 | 623 |
| 16 | Ryedale | 15,800 | 1 | 3 | 3 | 741 | 38 |
| 17 | Scarborough | 13,400 | 4 | 4 | 5 | 1,770 | 202 |
| 18 | Selby | 16,500 | 2 | 2 | 4 | 1,417 | 68 |
| 19 | Sheffield | 9,800 | 4 | 2 | 4 | 8,351 | 1,367 |
| 20 | Wakefield | 14,100 | 3 | 3 | 3 | 5,562 | 746 |
| 21 | York | 12,300 | 3 | 4 | 3 | 2,559 | 149 |
East midlands
| No. on map | Local authority name | Median age 28 earnings FSM son (£) | Quintile pay gap | Quintile pay gap condl on educn | Quintile education gap | No. of sons in sample | No. of FSM sons in sample |
| 1 | Amber Valley | 15,000 | 3 | 3 | 4 | 1,976 | 156 |
| 2 | Ashfield | 15,800 | 5 | 5 | 2 | 1,995 | 204 |
| 3 | Bassetlaw | 14,100 | 2 | 3 | 2 | 1,914 | 190 |
| 4 | Blaby | 16,000 | 2 | 4 | 1 | 1,668 | 54 |
| 5 | Bolsover | 14,800 | 3 | 2 | 4 | 1,255 | 186 |
| 6 | Boston | 15,400 | 3 | 3 | 5 | 927 | 66 |
| 7 | Broxtowe | 14,000 | 2 | 1 | 1 | 1,858 | 121 |
| 8 | Charnwood | 14,500 | 1 | 2 | 1 | 2,466 | 149 |
| 9 | Chesterfield | 15,800 | 3 | 3 | 1 | 1,697 | 192 |
| 10 | Corby | 16,700 | 5 | 5 | 4 | 1,108 | 147 |
| 11 | Daventry | 13,400 | 1 | 1 | 2 | 1,387 | 85 |
| 12 | Derby | 13,400 | 5 | 5 | 3 | 3,871 | 627 |
| 13 | Derbyshire Dales | 14,700 | 1 | 2 | 4 | 1,156 | 43 |
| 14 | East Lindsey | 13,000 | 5 | 5 | 5 | 2,177 | 180 |
| 15 | East Northamptonshire | 18,500 | 3 | 4 | 1 | 1,305 | 109 |
| 16 | Erewash | 14,400 | 3 | 4 | 1 | 1,817 | 168 |
| 17 | Gedling | 17,000 | 2 | 2 | 4 | 1,925 | 155 |
| 18 | Harborough | 15,800 | 2 | 3 | 1 | 1,328 | 33 |
| 19 | High Peak | 14,500 | 1 | 2 | 1 | 1,620 | 127 |
| 20 | Hinckley and Bosworth | 16,600 | 2 | 2 | 5 | 1,679 | 74 |
| 21 | Kettering | 16,400 | 5 | 4 | 3 | 1,507 | 114 |
| 22 | Leicester | 12,200 | 4 | 3 | 4 | 5,472 | 1,003 |
| 23 | Lincoln | 13,800 | 2 | 2 | 2 | 1,444 | 186 |
| 24 | Mansfield | 12,600 | 5 | 4 | 4 | 2,011 | 280 |
| 25 | Melton | 17,600 | 1 | 1 | 1 | 792 | 36 |
| 26 | Newark and Sherwood | 15,600 | 4 | 4 | 4 | 1,922 | 206 |
| 27 | North East Derbyshire | 15,400 | 3 | 4 | 3 | 1,627 | 120 |
| 28 | North Kesteven | 14,100 | 2 | 4 | 1 | 1,615 | 65 |
| 29 | North West Leicestershire | 16,700 | 2 | 2 | 2 | 1,451 | 95 |
| 30 | Northampton | 13,100 | 3 | 3 | 3 | 3,476 | 388 |
| 31 | Nottingham | 9,000 | 4 | 1 | 4 | 4,425 | 1,249 |
| 32 | Oadby and Wigston | 10,800 | 3 | 3 | 5 | 1,054 | 50 |
| 33 | Rushcliffe | 15,700 | 3 | 3 | 3 | 1,751 | 53 |
| 34 | Rutland | 4 | 4 | 3 | 499 | ||
| 35 | South Derbyshire | 18,700 | 1 | 1 | 1 | 1,429 | 78 |
| 36 | South Holland | 14,900 | 5 | 5 | 3 | 1,284 | 54 |
| 37 | South Kesteven | 15,500 | 3 | 4 | 2 | 2,101 | 92 |
| 38 | South Northamptonshire | 14,300 | 3 | 5 | 1 | 1,507 | 48 |
| 39 | Wellingborough | 14,000 | 3 | 3 | 3 | 1,284 | 163 |
| 40 | West Lindsey | 16,000 | 3 | 3 | 5 | 1,552 | 114 |
West midlands
| No. on map | Local authority name | Median age 28 earnings FSM son (£) | Quintile pay gap | Quintile pay gap condl on educn | Quintile education |
| gap | No. of sons in sample | No. of FSM sons in sample | ||||||
| 1 | Birmingham | 12,800 | 4 | 5 | 2 | 17,796 | 5,532 | |
| 2 | Bromsgrove | 12,900 | 4 | 2 | 5 | 1,524 | 64 | |
| 3 | Cannock Chase | 15,500 | 1 | 2 | 1 | 1,772 | 163 | |
| 4 | Coventry | 12,800 | 5 | 5 | 4 | 5,136 | 787 | |
| 5 | Dudley | 12,100 | 5 | 5 | 2 | 5,541 | 667 | |
| 6 | East Staffordshire | 17,100 | 4 | 5 | 2 | 1,844 | 208 | |
| 7 | Herefordshire, County of | 13,900 | 2 | 3 | 2 | 2,782 | 157 | |
| 8 | Lichfield | 13,500 | 4 | 4 | 4 | 1,713 | 89 | |
| 9 | Malvern Hills | 9,800 | 4 | 3 | 3 | 1,045 | 59 | |
| 10 | Newcastle-under-Lyme | 14,000 | 2 | 2 | 1 | 2,087 | 177 | |
| 11 | North Warwickshire | 15,200 | 2 | 3 | 1 | 1,160 | 71 | |
| 12 | Nuneaton and Bedworth | 16,300 | 4 | 4 | 3 | 2,257 | 188 | |
| 13 | Redditch | 16,300 | 4 | 4 | 3 | 1,555 | 161 | |
| 14 | Rugby | 16,000 | 1 | 1 | 2 | 1,461 | 91 | |
| 15 | Sandwell | 12,800 | 5 | 4 | 3 | 5,422 | 957 | |
| 16 | Shropshire | 16,000 | 1 | 1 | 2 | 4,689 | 277 | |
| 17 | Solihull | 15,900 | 3 | 1 | 5 | 3,749 | 360 | |
| 18 | South Staffordshire | 17,600 | 3 | 4 | 2 | 1,943 | 97 | |
| 19 | Stafford | 13,000 | 3 | 3 | 4 | 2,119 | 121 | |
| 20 | Staffordshire Moorlands | 14,100 | 2 | 2 | 2 | 1,653 | 116 | |
| 21 | Stoke-on-Trent | 13,400 | 4 | 5 | 1 | 4,285 | 741 | |
| 22 | Stratford-on-Avon | 14,800 | 4 | 4 | 4 | 1,640 | 57 | |
| 23 | Tamworth | 14,900 | 4 | 5 | 1 | 1,476 | 139 | |
| 24 | Telford and Wrekin | 13,800 | 4 | 3 | 3 | 3,017 | 501 | |
| 25 | Walsall | 11,400 | 5 | 5 | 2 | 4,956 | 766 | |
| 26 | Warwick | 12,700 | 2 | 1 | 4 | 1,901 | 102 | |
| 27 | Wolverhampton | 11,400 | 5 | 5 | 4 | 4,254 | 772 | |
| 28 | Worcester | 11,900 | 4 | 4 | 3 | 1,348 | 111 | |
| 29 | Wychavon | 15,300 | 4 | 5 | 3 | 1,816 | 97 | |
| 30 | Wyre Forest | 12,800 | 4 | 3 | 5 | 1,582 | 170 |
East
| No. on map | Local authority name | Median age 28 earnings FSM son (£) | Quintile pay gap | Quintile pay gap condl on educn | Quintile education gap | No. of sons in sample | No. of FSM sons in sample |
| 1 | Babergh | 14,600 | 1 | 1 | 1 | 1,383 | 99 |
| 2 | Basildon | 16,800 | 5 | 5 | 3 | 3,119 | 396 |
| 3 | Bedford | 15,200 | 5 | 4 | 3 | 2,239 | 283 |
| 4 | Braintree | 16,500 | 2 | 3 | 1 | 2,248 | 141 |
| 5 | Breckland | 12,800 | 2 | 3 | 4 | 1,877 | 158 |
| 6 | Brentwood | 18,900 | 4 | 2 | 5 | 1,165 | 40 |
| 7 | Broadland | 13,500 | 2 | 4 | 1 | 1,942 | 92 |
| 8 | Broxbourne | 19,300 | 4 | 3 | 2 | 1,623 | 105 |
| 9 | Cambridge | 13,500 | 1 | 1 | 3 | 1,095 | 102 |
| 10 | Castle Point | 16,500 | 2 | 2 | 4 | 1,623 | 116 |
| 11 | Central Bedfordshire | 15,400 | 4 | 4 | 2 | 4,338 | 210 |
| 12 | Chelmsford | 16,300 | 5 | 5 | 4 | 2,811 | 134 |
| 13 | Colchester | 14,700 | 1 | 1 | 4 | 2,585 | 208 |
| 14 | Dacorum | 17,300 | 1 | 1 | 1 | 2,314 | 114 |
| 15 | East Cambridgeshire | 17,900 | 1 | 1 | 3 | 1,118 | 54 |
| 16 | East Hertfordshire | 19,200 | 2 | 2 | 3 | 2,063 | 76 |
| 17 | Epping Forest | 16,400 | 1 | 1 | 1 | 1,760 | 112 |
| 18 | Fenland | 12,500 | 5 | 5 | 3 | 1,370 | 122 |
| 19 | Forest Heath | 21,200 | 1 | 1 | 1 | 653 | 38 |
| 20 | Great Yarmouth | 13,300 | 5 | 5 | 2 | 1,588 | 218 |
| 21 | Harlow | 17,900 | 4 | 5 | 1 | 1,418 | 159 |
| 22 | Hertsmere | 18,000 | 5 | 4 | 5 | 1,414 | 101 |
| 23 | Huntingdonshire | 17,700 | 2 | 3 | 2 | 2,765 | 157 |
| 24 | Ipswich | 16,300 | 2 | 2 | 4 | 2,144 | 318 |
| 25 | King’s Lynn and West Norfolk | 15,400 | 4 | 4 | 3 | 2,108 | 185 |
| 26 | Luton | 14,500 | 5 | 5 | 1 | 3,528 | 816 |
| 27 | Maldon | 18,400 | 2 | 2 | 3 | 1,089 | 72 |
| 28 | Mid Suffolk | 18,100 | 2 | 4 | 1 | 1,521 | 66 |
| 29 | North Hertfordshire | 17,300 | 1 | 1 | 1 | 1,980 | 96 |
| 30 | North Norfolk | 16,300 | 3 | 4 | 2 | 1,374 | 120 |
| 31 | Norwich | 13,800 | 1 | 1 | 2 | 1,629 | 279 |
| 32 | Peterborough | 13,700 | 5 | 5 | 3 | 2,857 | 385 |
| 33 | Rochford | 17,600 | 4 | 3 | 2 | 1,384 | 64 |
| 34 | South Cambridgeshire | 17,200 | 1 | 2 | 2 | 2,147 | 55 |
| 35 | South Norfolk | 18,300 | 2 | 4 | 1 | 1,753 | 89 |
| 36 | Southend-on-Sea | 14,400 | 5 | 3 | 5 | 2,755 | 350 |
| 37 | St Albans | 16,900 | 4 | 3 | 5 | 2,015 | 106 |
| 38 | St Edmundsbury | 12,700 | 1 | 3 | 1 | 1,633 | 84 |
| 39 | Stevenage | 16,800 | 5 | 4 | 3 | 1,613 | 135 |
| 40 | Suffolk Coastal | 15,600 | 1 | 2 | 2 | 1,810 | 118 |
| 41 | Tendring | 15,100 | 5 | 4 | 4 | 2,148 | 226 |
| 42 | Three Rivers | 15,300 | 2 | 2 | 5 | 1,232 | 62 |
| 43 | Thurrock | 16,700 | 5 | 4 | 4 | 2,522 | 279 |
| 44 | Uttlesford | 24,600 | 3 | 4 | 4 | 1,159 | 35 |
| 45 | Watford | 12,400 | 4 | 4 | 5 | 1,303 | 106 |
| 46 | Waveney | 14,600 | 5 | 5 | 4 | 1,989 | 263 |
| 47 | Welwyn Hatfield | 19,600 | 2 | 1 | 3 | 1,464 | 90 |
London
| No. on map | Local authority name | Median age 28 earnings FSM son (£) | Quintile pay gap | Quintile pay gap condl on educn | Quintile education gap | No. of sons in sample | No. of FSM sons in sample |
| 1 | Barking and Dagenham | 18,100 | 3 | 2 | 3 | 2,695 | 571 |
| 2 | Barnet | 12,800 | 3 | 2 | 3 | 4,047 | 559 |
| 3 | Bexley | 16,500 | 5 | 5 | 3 | 3,921 | 352 |
| 4 | Brent | 14,200 | 4 | 3 | 3 | 3,927 | 815 |
| 5 | Bromley | 16,000 | 4 | 3 | 4 | 4,332 | 448 |
| 6 | Camden | 15,600 | 1 | 1 | 1 | 1,620 | 577 |
| 7 | City of London | ||||||
| 8 | Croydon | 14,600 | 4 | 4 | 3 | 5,137 | 763 |
| 9 | Ealing | 14,100 | 1 | 1 | 1 | 4,266 | 1,100 |
| 10 | Enfield | 14,600 | 4 | 2 | 4 | 4,678 | 776 |
| 11 | Greenwich | 13,800 | 4 | 5 | 1 | 3,455 | 844 |
| 12 | Hackney | 12,200 | 1 | 1 | 1 | 2,404 | 927 |
| 13 | Hammersmith and Fulham | 12,600 | 1 | 1 | 1 | 1,315 | 549 |
| 14 | Haringey | 11,200 | 1 | 1 | 1 | 2,975 | 1,005 |
| 15 | Harrow | 16,000 | 5 | 4 | 3 | 3,398 | 414 |
| 16 | Havering | 20,300 | 4 | 3 | 4 | 4,195 | 395 |
| 17 | Hillingdon | 17,700 | 4 | 4 | 5 | 4,015 | 556 |
| 18 | Hounslow | 15,800 | 1 | 1 | 2 | 3,384 | 565 |
| 19 | Islington | 12,000 | 1 | 1 | 1 | 1,988 | 636 |
| 20 | Kensington and Chelsea | 8,600 | 1 | 1 | 1 | 754 | 240 |
| 21 | Kingston upon Thames | 18,500 | 1 | 1 | 5 | 1,863 | 138 |
| 22 | Lambeth | 12,900 | 1 | 1 | 1 | 2,894 | 979 |
| 23 | Lewisham | 14,300 | 1 | 1 | 1 | 3,379 | 926 |
| 24 | Merton | 15,300 | 1 | 1 | 3 | 2,314 | 278 |
| 25 | Newham | 17,200 | 2 | 3 | 1 | 4,244 | 1,671 |
| 26 | Redbridge | 14,400 | 3 | 4 | 1 | 4,131 | 613 |
| 27 | Richmond upon Thames | 13,500 | 2 | 2 | 5 | 1,595 | 163 |
| 28 | Southwark | 13,100 | 1 | 1 | 1 | 2,704 | 1,001 |
| 29 | Sutton | 17,700 | 3 | 3 | 4 | 3,031 | 267 |
| 30 | Tower Hamlets | 17,900 | 1 | 2 | 1 | 2,875 | 1,852 |
| 31 | Waltham Forest | 15,100 | 2 | 2 | 1 | 3,607 | 871 |
| 32 | Wandsworth | 12,500 | 1 | 2 | 1 | 2,042 | 462 |
| 33 | Westminster | 11,000 | 1 | 1 | 1 | 1,108 | 393 |
South-east
| No. on map | Local authority name | Median age 28 earnings FSM son (£) | Quintile pay gap | Quintile pay gap condl on educn | Quintile education gap | No. of sons in sample | No. of FSM sons in sample |
| 1 | Adur | 15,700 | 2 | 3 | 2 | 944 | 82 |
| 2 | Arun | 14,500 | 5 | 4 | 5 | 2,070 | 142 |
| 3 | Ashford | 14,000 | 5 | 5 | 2 | 1,765 | 113 |
| 4 | Aylesbury Vale | 15,200 | 5 | 5 | 5 | 2,623 | 171 |
| 5 | Basingstoke and Deane | 16,400 | 4 | 4 | 4 | 2,488 | 115 |
| 6 | Bracknell Forest | 17,900 | 3 | 4 | 3 | 1,822 | 76 |
| 7 | Brighton and Hove | 14,500 | 1 | 1 | 2 | 3,127 | 455 |
| 8 | Canterbury | 13,100 | 1 | 1 | 2 | 2,132 | 178 |
| 9 | Cherwell | 18,400 | 1 | 1 | 2 | 2,020 | 163 |
| 10 | Chichester | 15,900 | 1 | 1 | 4 | 1,410 | 85 |
| 11 | Chiltern | 6,900 | 5 | 5 | 5 | 1,440 | 52 |
| 12 | Crawley | 17,400 | 2 | 1 | 2 | 1,652 | 111 |
| 13 | Dartford | 18,300 | 4 | 5 | 4 | 1,528 | 85 |
| 14 | Dover | 14,900 | 2 | 1 | 2 | 1,885 | 190 |
| 15 | East Hampshire | 15,600 | 1 | 1 | 4 | 1,791 | 78 |
| 16 | Eastbourne | 14,300 | 3 | 3 | 2 | 1,266 | 167 |
| 17 | Eastleigh | 18,200 | 2 | 1 | 5 | 2,150 | 114 |
| 18 | Elmbridge | 18,700 | 2 | 2 | 4 | 1,198 | 78 |
| 19 | Epsom and Ewell | 14,900 | 4 | 3 | 5 | 995 | 45 |
| 20 | Fareham | 15,900 | 5 | 5 | 1 | 1,852 | 75 |
| 21 | Gosport | 13,300 | 3 | 2 | 4 | 1,338 | 85 |
| 22 | Gravesham | 14,400 | 3 | 4 | 3 | 1,751 | 197 |
| 23 | Guildford | 13,400 | 2 | 1 | 5 | 1,595 | 76 |
| 24 | Hart | 5 | 4 | 4 | 1,341 | ||
| 25 | Hastings | 10,600 | 4 | 5 | 3 | 1,467 | 276 |
| 26 | Havant | 15,800 | 1 | 1 | 1 | 2,208 | 188 |
| 27 | Horsham | 16,600 | 5 | 5 | 3 | 1,882 | 71 |
| 28 | Isle of Wight | 13,300 | 5 | 4 | 5 | 2,308 | 314 |
| 29 | Lewes | 15,200 | 2 | 1 | 5 | 1,471 | 91 |
| 30 | Maidstone | 14,000 | 2 | 2 | 5 | 2,414 | 172 |
| 31 | Medway | 17,300 | 4 | 5 | 2 | 4,850 | 445 |
| 32 | Mid Sussex | 18,200 | 3 | 3 | 4 | 2,067 | 61 |
| 33 | Milton Keynes | 15,800 | 3 | 3 | 2 | 4,028 | 396 |
| 34 | Mole Valley | 14,800 | 2 | 2 | 2 | 1,005 | 31 |
| 35 | New Forest | 14,300 | 2 | 2 | 5 | 2,742 | 148 |
| 36 | Oxford | 16,800 | 1 | 1 | 5 | 1,640 | 288 |
| 37 | Portsmouth | 12,500 | 3 | 4 | 2 | 2,941 | 332 |
| 38 | Reading | 12,200 | 3 | 1 | 5 | 2,078 | 260 |
| 39 | Reigate and Banstead | 20,500 | 3 | 3 | 2 | 1,750 | 98 |
| 40 | Rother | 13,200 | 3 | 3 | 3 | 1,192 | 99 |
| 41 | Runnymede | 18,600 | 2 | 2 | 3 | 943 | 47 |
| 42 | Rushmoor | 17,900 | 4 | 4 | 3 | 1,370 | 79 |
| 43 | Sevenoaks | 15,700 | 3 | 3 | 5 | 1,716 | 95 |
| 44 | Shepway | 13,700 | 3 | 2 | 3 | 1,624 | 215 |
| 45 | Slough | 16,500 | 4 | 2 | 5 | 2,222 | 327 |
| 46 | South Bucks | 17,100 | 3 | 1 | 5 | 958 | 38 |
| 47 | South Oxfordshire | 16,100 | 1 | 1 | 5 | 1,938 | 86 |
| 48 | Southampton | 14,400 | 1 | 1 | 3 | 3,179 | 449 |
| 49 | Spelthorne | 20,800 | 2 | 2 | 3 | 1,351 | 55 |
| 50 | Surrey Heath | 16,400 | 5 | 4 | 5 | 1,269 | 34 |
| 51 | Swale | 14,100 | 5 | 5 | 5 | 2,280 | 208 |
| 52 | Tandridge | 17,400 | 3 | 3 | 3 | 1,106 | 69 |
| 53 | Test Valley | 16,700 | 3 | 4 | 5 | 1,841 | 89 |
| 54 | Thanet | 10,500 | 5 | 4 | 5 | 2,205 | 246 |
| 55 | Tonbridge and Malling | 15,200 | 4 | 3 | 4 | 1,909 | 102 |
| 56 | Tunbridge Wells | 14,000 | 3 | 2 | 5 | 1,617 | 78 |
| 57 | Vale of White Horse | 15,700 | 2 | 3 | 4 | 1,720 | 100 |
| 58 | Waverley | 18,400 | 3 | 2 | 5 | 1,412 | 56 |
| 59 | Wealden | 12,800 | 3 | 4 | 2 | 2,154 | 91 |
| 60 | West Berkshire | 17,300 | 2 | 2 | 2 | 2,439 | 99 |
| 61 | West Oxfordshire | 19,700 | 1 | 1 | 2 | 1,497 | 72 |
| 62 | Winchester | 14,200 | 3 | 3 | 5 | 1,452 | 60 |
| 63 | Windsor and Maidenhead | 11,300 | 3 | 1 | 5 | 1,947 | 90 |
| 64 | Woking | 17,900 | 3 | 3 | 3 | 1,289 | 96 |
| 65 | Wokingham | 19,600 | 2 | 2 | 5 | 2,488 | 90 |
| 66 | Worthing | 14,200 | 5 | 4 | 4 | 1,539 | 123 |
| 67 | Wycombe | 15,500 | 5 | 5 | 5 | 2,683 | 316 |
South-west
| No. on map | Local authority name | Median age 28 earnings FSM son (£) | Quintile pay gap | Quintile pay gap condl on educn | Quintile education |
| gap | No. of sons in sample | No. of FSM sons in sample | ||||||
| 1 | Bath and North East Somerset | 12,000 | 2 | 2 | 3 | 2,416 | 128 | |
| 2 | Bournemouth | 13,900 | 3 | 3 | 5 | 2,293 | 219 | |
| 3 | Bristol, City of | 12,700 | 1 | 1 | 4 | 5,584 | 890 | |
| 4 | Cheltenham | 14,400 | 2 | 1 | 5 | 1,498 | 117 | |
| 5 | Christchurch | 13,800 | 2 | 3 | 5 | 683 | 56 | |
| 6 | Cornwall | 14,000 | 3 | 3 | 5 | 8,572 | 798 | |
| 7 | Cotswold | 17,800 | 1 | 2 | 1 | 1,165 | 51 | |
| 8 | East Devon | 15,800 | 1 | 1 | 4 | 1,893 | 91 | |
| 9 | East Dorset | 15,000 | 4 | 4 | 2 | 1,390 | 42 | |
| 10 | Exeter | 15,000 | 1 | 1 | 4 | 1,618 | 166 | |
| 11 | Forest of Dean | 12,100 | 2 | 2 | 4 | 1,306 | 77 | |
| 12 | Gloucester | 14,300 | 3 | 4 | 4 | 2,018 | 173 | |
| 13 | Isles of Scilly | |||||||
| 14 | Mendip | 12,900 | 1 | 1 | 2 | 1,748 | 106 | |
| 15 | Mid Devon | 15,800 | 1 | 3 | 4 | 1,177 | 72 | |
| 16 | North Devon | 16,400 | 2 | 3 | 2 | 1,516 | 126 | |
| 17 | North Dorset | 16,100 | 1 | 1 | 1 | 972 | 46 | |
| 18 | North Somerset | 15,400 | 4 | 4 | 5 | 3,055 | 202 | |
| 19 | Plymouth | 14,100 | 4 | 4 | 4 | 4,262 | 502 | |
| 20 | Poole | 14,400 | 3 | 2 | 5 | 2,296 | 145 | |
| 21 | Purbeck | 17,900 | 3 | 3 | 5 | 719 | 47 | |
| 22 | Sedgemoor | 15,000 | 1 | 1 | 5 | 1,909 | 157 | |
| 23 | South Gloucestershire | 17,900 | 1 | 2 | 2 | 4,201 | 218 | |
| 24 | South Hams | 14,100 | 3 | 4 | 2 | 1,457 | 107 | |
| 25 | South Somerset | 14,700 | 3 | 4 | 3 | 2,518 | 133 | |
| 26 | Stroud | 14,400 | 1 | 1 | 3 | 1,816 | 76 | |
| 27 | Swindon | 13,700 | 3 | 3 | 4 | 3,498 | 287 | |
| 28 | Taunton Deane | 15,500 | 3 | 3 | 4 | 1,579 | 123 | |
| 29 | Teignbridge | 16,800 | 2 | 3 | 5 | 2,089 | 157 | |
| 30 | Tewkesbury | 15,300 | 3 | 5 | 4 | 1,263 | 63 | |
| 31 | Torbay | 13,600 | 5 | 5 | 5 | 2,082 | 284 | |
| 32 | Torridge | 13,000 | 1 | 1 | 2 | 929 | 74 | |
| 33 | West Devon | 10,000 | 1 | 2 | 3 | 820 | 49 | |
| 34 | West Dorset | 13,500 | 1 | 1 | 3 | 1,492 | 70 | |
| 35 | West Somerset | 17,700 | 4 | 3 | 5 | 523 | 62 | |
| 36 | Weymouth and Portland | 16,200 | 1 | 2 | 2 | 1,081 | 99 | |
| 37 | Wiltshire | 16,300 | 2 | 2 | 5 | 6,964 | 345 |
-
It is not possible to provide reliable estimates for daughters since our adult earnings measures cannot be adjusted for part-time work (see the technical report for full details) ↩
-
The 2017 State of the Nation report was a first attempt to consider regional differences in social mobility by showing how local authorities differed in terms of the Social Mobility Index, an index based on a variety of indicators ranging from educational outcomes for disadvantaged children to median weekly salary of employees and occupational composition of jobs in different areas. ↩
-
It is not possible to provide reliable estimates for daughters since our adult earnings measures cannot be adjusted for part-time work (see the technical report for full details) ↩
-
We cannot observe destination region in our data (see the technical report for details) ↩
-
Figure 1.1 plots these differences for all LAs in England. The dark red areas are the 20% of local authorities where sons from that area who were disadvantaged at age 16 have the lowest median earnings at age 28, while the lightest areas are the 20% of local authorities where sons from that area who were disadvantaged at 16 have the highest median earnings at age 28. The bottom map zooms in on the small London boroughs. ↩
-
We are only able to observe annual earnings. These figures therefore include any part-time work, partial spells of employment and whole-year unemployment (in the form of zero earnings). ↩
-
Many of the areas with the smallest gaps and lowest median earnings for FSM children are Inner London boroughs (e.g. Kensington and Chelsea and Islington), implying that sons of rich families growing up there also have relatively low earnings. This finding needs to be caveated in 3 ways. First, the proportion of boys in private schools (hence not included in our analysis) is likely to be higher than nationally, so the earnings we calculate for these areas are likely to be lower than the true earnings. Second, the deprivation measure based on area census measures may map onto income less well in London than in the rest of the country, as small areas are more likely to be more mixed in terms of socio- economic status than they are outside of London. Finally, while the median earnings of sons in receipt of FSM in Inner London are among the lowest in the country, this is not true of mean (average) earnings, with many London boroughs actually having relatively high mean earnings for sons from poor families. ↩
-
As measured by the average Index of Multiple Deprivation Rank (IMD) rank of the Lower Super Output Areas (LSOAs) in the local authorities. More information on the IMD measure of deprivation can be found at: www.gov.uk/government/collections/english-indices-of-deprivation. ↩
-
See the technical report (section 2) for more detail on these measures for each type of area. ↩
-
Macmillan, L. (2014), Intergenerational worklessness in the UK and the role of local labour markets, Oxford Economic Papers, 66(3), 871–889; List, J. and Rasul, I. (2010), Field experiments in labour economics, in O. Ashenfelter and D. Card (eds), Handbook of Labor Economics, Vol. 3C (pp. 3143– 3259), Amsterdam: Elsevier North Holland. ↩
-
See the large but relatively flat contribution of the dark orange portion in Figure 2.3 in the previous section. ↩
-
Note that the total contribution of education to the pay gap within each area scales these educational gaps by the ‘returns’ to educational achievement in each area (i.e. the earnings gap between high and low educational achievement in each area). Differences in the total contribution of education across areas will therefore be explained by differences in educational gaps and differences in these returns across areas. See Sections 6 and 7 of the Technical Report for further details. ↩
-
Secondary schools that select based on an entry test at age 11. ↩
-
See, for example, Greaves, E., Macmillan, L. and Sibieta, L. (2014), Lessons from London schools for attainment gaps and social mobility, SMCP Research Report SMCP-RR363, London: Social Mobility and Child Poverty Commission. ↩
-
Wilson, W.J. (1997), When work disappears: the world of the new urban poor, Random House: New York. ↩
-
Blanden, J., Gregg, P. and Macmillan, L. (2007), Accounting for intergenerational income persistence: non-cognitive skills, ability and education, Economic Journal, 117, C43–C60. ↩
-
SMC (2020), Internal migration and social mobility – moving out to move on, report, July 2020. ↩
-
SMC (2019), An unequal playing field: extra-curricular activities, soft skills and social mobility, report, July 2019. ↩
-
Friedman, S. and Laurison, D. (2019), The class ceiling: why it pays to be privileged, Bristol: Policy Press. ↩
-
SMC (2016). Socio-economic diversity in life sciences and investment banking, report, September 2016. ↩
-
SMC (2019), State of the Nation 2018–19: social mobility in Great Britain, report, April 2019. ↩
-
SMC (2016), Socio-economic diversity in life sciences and investment banking, report, 2016. ↩
-
The Social Mobility Toolkit at www.socialmobilityworks.org cites other activities to improve this outcome. ↩
-
Areas which are both in the quintile with the smallest pay gap and have median earnings for disadvantaged sons of above £17,900. ↩
-
Ministry of Housing, Communities and Local Government (2019), Towns Fund prospectus. November 2019. ↩
-
The recent monitoring report from the SMC has highlighted areas of improvement for this scheme, including the need for more transparency in how places are selected into the scheme and how the programme will be evaluated. SMC (2020), Monitoring social mobility 2013–2020: is the government delivering on our recommendations, report, June 2020. ↩
-
SMC (2020). Monitoring social mobility 2013 to 2020. https://www.gov.uk/government/publications/monitoring-social-mobility-2013-to-2020 ↩
-
www.gov.uk/government/publications/social-mobility-and-opportunity-areas ↩
-
https://assets.publishing.service.gov.uk/government/uploads/system/uploads/attachment_data/file/ 496107/Social_Mobility_Index_-_Methodology.PDF ↩
-
www.socialmobilityworks.org ↩