The Impact of Benefit Sanctions on Employment Outcomes
Published 6 April 2023

© Crown copyright 2023
This publication is licensed under the terms of the Open Government Licence v3.0 except where otherwise stated. To view this licence, visit nationalarchives.gov.uk/doc/open-government-licence/version/3 or write to the Information Policy Team, The National Archives, Kew, London TW9 4DU, or email: psi@nationalarchives.gov.uk.
Where we have identified any third party copyright information you will need to obtain permission from the copyright holders concerned.
This publication is available at https://www.gov.uk/government/publications/the-impact-of-benefit-sanctions-on-employment-outcomes-draft-report/the-impact-of-benefit-sanctions-on-employment-outcomes
Executive Summary
The Work and Pensions Select Committee (WPSC) made a recommendation in its report published November 2018[footnote 1] that ‘the Department urgently evaluate the effectiveness of reforms to welfare conditionality and sanctions introduced since 2012 in achieving their stated policy aims’. In addition, the WPSC recommended that the evaluation include an assessment ‘of the impact sanctions have on claimants’ financial and personal well-being’. The government’s response[footnote 2] accepted the recommendation and made the commitment: ‘UC administrative data will be used to look at the impact a sanction has on an individual’s likelihood of entering work and on their earnings once they are in work’.
This report presents the government’s evaluation of the impact of benefit sanctions on employment outcomes. The specific outcomes examined are the impact of a claimant receiving a sanction on (i) the duration of their spell on Universal Credit (UC) (ii) the duration of their spell in ‘UC Intensive’ (iii) their earnings upon exiting from ‘UC Intensive’. Additional results segmenting by claimant sub-group and sanction type are also presented.
Key Findings
Impact on spell durations
- Sanctions reduce the duration of a claimant spell on Universal Credit. This is driven by increased exit rates into no PAYE earnings. [footnote 3] Exits rates into PAYE earnings decrease.
- Sanctions have a small negative impact on the rate at which claimants exit ‘UC Intensive’ into a state where they are earning, either on or off UC.
- Taken together, these results suggest that the impact of a sanction is to decrease the rate of exit into higher paid work, while the exit rate into some kind of work is not greatly affected.
- The results segmented by characteristic show that in contrast to the aggregate result, claimants with a health condition[footnote 4], with a partner and males all exit ‘UC Intensive’ into earnings more quickly as a result of a sanction. Sanctioned claimants with children exit ‘UC Intensive’ 7 percent more slowly.
Impact on earnings
- Upon exiting ‘UC Intensive’, sanctioned claimants earn on average £34 per month less than non-sanctioned claimants over a 6-month period. This is driven by lower earnings while employed, rather than fewer months spent in employment.
- The results segmented by characteristic show that, in contrast to the aggregate results, there is no evidence that sanctioned claimants with a health condition, with a partner, caring, or male face earn less than non-sanctioned claimants in the 6 months after exiting ‘UC Intensive’. [footnote 5] Conversely, sanctioned claimants under the age of 26 fare worse than average, earning £43 per month less than non-sanctioned claimants in the same age group.
In summary, a sanction leads the average claimant to exit less quickly into PAYE earnings and to earn less upon exiting. In a narrow sense, this constitutes a negative impact of a sanction on claimant finances. However, this excludes the wider role of a sanction, which acts to incentivise compliance with a conditionality regime that encourages work search and earnings increases.
The negative financial effect reported should therefore be balanced against the likely positive deterrent effect that the sanction regime has by incentivising claimant attendance, an effect which will be experienced by all claimants subject to conditionality, regardless of whether they are sanctioned. [footnote 6] This is particularly pertinent in light of the reduced sanction rate, which was over 6% in August 2017 but has been below 3% since August 2018, meaning that the proportion of claimants subject to the impacts described in this report is relatively low. Indeed, the policy intent of sanctions policy is not to sanction claimants but to encourage claimants to comply with their requirements by creating a consequence if they do not. Any question about the appropriate strictness of a sanction, to encourage work search whilst preserving as far as possible the insurance principles of benefit receipt, should take this into account.
1 Introduction
1.1 Background
The Work and Pensions Select Committee (WPSC) made a recommendation in its report published November 2018[footnote 7] that ‘the Department urgently evaluate the effectiveness of reforms to welfare conditionality and sanctions introduced since 2012 in achieving their stated policy aims’. In addition, the WPSC recommended that the evaluation include an assessment ‘of the impact sanctions have on claimants’ financial and personal well-being’. The government’s response[footnote 8] accepted the recommendation and made the commitment: ‘UC administrative data will be used to look at the impact a sanction has on an individual’s likelihood of entering work and on their earnings once they are in work’.
Sanctions from part of a system of conditionality whereby claimants engage in specific actions in order to be eligible for benefits payments. In the absence of the threat of a benefits sanction, these actions, which are intended to support a claimant to find work, would be purely voluntary. There is trial-based evidence in a GB context that conditionality supported by sanctions speeds up transitions into employment[footnote 9] and international evidence also supports this finding on claimant outcomes. [footnote 10] There is international evidence on the impact of imposing a sanction, but in the GB context, there has been little research on this. [footnote 11] This report contributes to the GB evidence base by assessing the impact of imposing a sanction on claimant employment outcomes.
1.2 Policy context
1.2.1 Universal Credit
Universal Credit (UC) is the primary working age benefit for UK citizens. It combines 6 legacy benefits[footnote 12] of in and out of work support. Roll out started in 2013. This report focuses on data from UC Full Service, which superseded the UC Live Service system and was rolled out between 2015 and end 2018. In April 2019[footnote 13], there were 1.94 million claimants in receipt of UC, of which around 1.26 million were subject to conditionality.
All claimants on Universal Credit are eligible to receive a standard allowance. They may receive additional entitlements depending on their characteristics. In order to receive this standard allowance, claimants must agree a claimant commitment. This claimant commitment may include work preparation, work search and work availability requirements, depending on the labour market regime the claimant is in. Mandatory requirements may only be applied to claimants who are subject to ‘all work-related requirements’, ‘work preparation’ or ‘work-focused interview requirements’. [footnote 14]
These requirements are developed and then agreed between the claimant and their work coach, and are intended to support claimants in their journey towards work. For those closer to the labour market, requirements could be activities related to work search aimed at increasing a claimant’s likelihood of moving into work. For those further from it, not immediately expected to take up work, requirements could be activities that help them to overcome their barriers to work to eventually become job-ready or preparing for work in the future if they are job-ready but unable to work now.
The claimant and their work coach develop these requirements in accordance with the claimant’s individual circumstances to ensure they are reasonable. For example, a claimant who has childcare responsibilities will have their work-search and work availability requirements reduced to no more than 16 hours a week to account for these responsibilities. The specific hours will be tailored to the claimant’s individual circumstances.
This report focuses on claimants starting their UC spells in the ‘Intensive’ regime. Claimants are in this group if their benefit unit has low[footnote 15] or zero earnings. Claimants on the health journey[footnote 16] and awaiting a Work Capability Assessment will be in this regime except in specific circumstances, for example, if they have earnings, or if the claimant meets specified conditions undergoing certain treatments specified in Schedule 8 and 9 of the UC Regulations.
1.2.2 Sanctions
A sanction is a reduction in UC payment calculated with reference to the standard allowance. This reduction will depend on the claimant’s circumstances, such as what labour market regime they are in, whether they are a single or a joint claim and whether they are under or over 18[footnote 17].
Sanctions are intended to encourage claimants to comply with their requirements by having a deterrent effect. Sanctions are also applied for leaving a job or loss of pay by choice or due to misconduct, pre- or in-claim. The Department for Work and Pensions has a legal duty to monitor compliance and to impose sanctions if the claimant has no good reason for failing to comply. Good reason is determined on a case by case basis and is not codified. Examples of good reason would include a medical emergency or temporary childcare responsibilities.
There are different levels of sanction that are applied depending on the requirement the claimant did not meet. Lowest and low level sanctions constitute 91.9% of sanctions. The majority of these are for failure to attend or participate in Jobcentre Plus appointments, although they also include failure to undertake work preparation requirements, such as creating a CV.
For lowest level sanctions, which are applicable in the ‘Work Focused Interview’ work group only, the duration of the reduction is calculated from the day of the failure until the day before the claimant meets their compliance condition (this usually constitutes fulfilling the same requirement), the requirement is no longer appropriate, or their UC claim is closed.
For low level sanctions, which are applicable in the ‘Work preparation’, and ‘Intensive’ work groups, there is an additional fixed period of 7, 14 or 28 days to the aforementioned open-ended period, depending on how many other low level sanctions the claimant receives within 365 days (but not within 14 days) of the current failure.
Medium and high level sanctions, reserved for the most severe failures, range between four weeks and six months in duration, depending on the number of previous sanctions for the same level failure. [footnote 18]
1.3 Scope
This report presents the government’s evaluation of the impact of benefit sanctions on employment outcomes. The specific outcomes examined are the impact of a claimant receiving a sanction on (i) the duration of their spell on Universal Credit (ii) the duration of their spell in Universal Credit ‘Intensive’ (iii) their earnings upon exiting from Universal Credit ‘Intensive’. Additional results segmenting by claimant sub-group and sanction type are also presented.
A sanction acts not only through its imposition but also through its effect as a deterrent. Even in the absence of any sanctions imposed, a conditionality regime would be expected to have a positive effect on job entry. However, since all claimants in ‘UC Intensive’ are subject to mandatory conditions, it is not straightforward to assess this relative to a non-mandatory system. This report therefore focuses on the imposition effect and does not assess the deterrent effect. [footnote 19]
Section 2 reviews the literature and theory of benefits sanctions. Section 3 documents the data sources used in this report. Section 4 describes the outcomes framework with reference to the sample descriptive statistics. Section 5 presents the results for the impact on claimant benefits spell durations. Section 6 presents the results for the impact on earnings and section 7 concludes.
2. Literature and theory of benefits sanctions
2.1 Literature review
This section presents relevant literature and economic theory to provide context and aid with interpretation of the report results. It draws substantially on a November 2016 report, ‘Benefit Sanctions’, by the National Audit Office[footnote 20], which reviews 13 publications that cover the unemployment insurance regimes in Denmark, Germany, Great Britain, the Netherlands, Sweden and Switzerland[footnote 21]. The National Audit Office produced some preliminary analysis themselves which is also included in the following review.
In terms of the impact of a sanction on the probability of leaving benefits for work, twelve of the studies under review find that a sanction increases the effect. The two studies that examine it find an increased probability of leaving benefits for unknown destinations (likely to be a non-work outcome). In terms of the impact on earnings, the four studies that examine this question all find a negative effect.
A system of Unemployment Insurance is not identical to the Unemployment Benefit system present in the UK (e.g. Jobseekers Allowance, and Universal Credit). Therefore, care should be taken in comparing Unemployment Benefit in the UK to analysis on Unemployment Insurance. In particular, the caseload of claimants in the UK is likely to compose of claimants on lower incomes who are further from the labour market, since these are claimants who do not have sufficient employment history to be entitled to unemployment insurance.
The evidence on sanctions in GB does not differ greatly from the international literature. Research by Loopstra et al. (2015) and the National Audit Office (2016) both find increased probabilities of exits from JSA into both employment and unknown destinations. The National Audit Office finds suggestive evidence of a negative impact of a sanction on earnings. Williams (2020) finds a negative impact of a JSA sanction on mental health outcomes. None of these studies uses hazard modelling, the standard approach used in academic articles to answer this question, and none examines the impact of a sanction in the context of Universal Credit.
Theoretical findings from the papers published by Boone and Van Ours (2006) and Boone et al. (2007), are supportive of a mandatory sanctions regime. These papers show that from a welfare point of view, it may be optimal to introduce sanctions into a system of unemployment insurance. However, Webster (2017), and Dwyer and Bright (2018), document qualitative evidence of adverse impacts of sanctions and conditionality for some groups. Qualitative research from an Ipsos Mori report commissioned by Department for Work and Pensions (2015) found that a large proportion of claimants agreed that the potential for sanctions meant they were more likely to conduct work search.
2.2 Economic theory
Economic theory provides a framework for understanding the impact of a sanction on earnings and unemployment duration. This is a rich and powerful framework, but there are of course many behavioural responses it does not capture. According to theory there are two main ways claimants respond to the imposition of a sanction. Firstly, claimants increase their search intensity and second they lower their reservation wage. [footnote 22]
A job-seeking benefit such as UC’s standard allowance increases the value of being in an unemployed state. The imposition of a sanction reduces this value, decreasing the value of the unemployed state to the claimant. As a result, the claimant’s search intensity increases and their reservation wage decreases, as employment becomes a relatively more attractive option. Increased search intensity and a lower reservation wage translate to a higher exit rate into work and lower earnings once in work. These theoretical predictions are consistent with the findings in the international literature detailed in the previous section.
A lower reservation wage not only makes employment relatively more attractive to a claimant, but also makes economic inactivity[footnote 23] more attractive. This is particularly the case for claimants with poor labour market prospects, for whom the expected value of job search is relatively low. Therefore, theory predicts not only increased exit rates into work but also increased exit rates into economic inactivity.
In the context of Universal Credit, the impact on the reservation wage may be mitigated by the presence of hardship payments, which a claimant can apply for if they have a sanction deduction and have recomplied with their conditionality requirements. To the extent that they expect to repay these once their finances have improved, and the marginal value of the standard allowance to the claimant is less, hardship payments will act to raise a claimant’s reservation wage and decrease their search intensity. [footnote 24]
This effect is strengthened by the fact that a hardship payment will not always need to be repaid in full and as such may represent a financial gain to the claimant. This results from the fact that when a claimant is earning over the Conditionality Earnings Threshold (CET), the recovery of hardship payments is paused, and if the claimant maintains earnings above the CET for six months, the remaining debt is cancelled. [footnote 25]
3. Data Sources
This section outlines the data that is used for the analysis which consists of DWP administrative data and HMRC P14 data. These are taken from two sources: (i) Universal Credit (UC) datasets, which comprise all of the different administrative records relating to UC and (ii) the Registration and Population Income Dataset (RAPID), which combines DWP benefit information with HMRC earnings information. The full set of variables used from these datasets is listed in Appendix 2.
3.1 Universal Credit (UC) data
UC data is used to provide information on the dynamics of a UC claim, for example when a claimant started and ended their claim, when they moved between conditionality groups and information on any sanctions (the date at which the sanction was administered, its type and length) during their claim. UC administrative data includes reports of PAYE earnings for claimants before, during and after their UC claim.
The analysis uses UC full service data, the system currently used to administer claims, but, due to limitations on data availability, omits data from individuals earlier in the UC roll-out process, when another system was used. Using full service data provides access to extensive demographic information which allow a rich set of controls to be used in the analysis. This comes at the expense of potentially gaining insight into whether claimant dynamics were different in the earlier stages of UC. [footnote 26] Demographic data includes whether a claimant has a child, a partner (and therefore whether someone is a lone parent[footnote 27]), whether they care for someone and whether or not they have a health condition.
It is important to note that individuals are characterised by their status at the start of their claim. This avoids any potential endogeneity where changes to these statuses might be outcomes in their own right, which could bias the results. [footnote 28] All mentions of claimant characteristics in this report refer at the point the claimant starts on UC, rather than when the event happened (for example, a claimant might be a lone parent at the beginning of their claim but not at the point they are sanctioned).
3.2 Registration and Population Income Dataset (RAPID) data
These data are annualised records of DWP and HMRC benefit and tax information, such that each person has one record per tax year. They detail the amount that each individual received from employment, self-employment, any benefits that they received and also indicate the number of weeks of receipt of that benefit or employment.
All records from the tax years 2010 to 2017 are taken and amalgamated so that there is just one record per individual which takes the sum across the relevant years. These data are employed as the primary control variables, to allow the removal, as far as possible, of any underlying heterogeneity in individuals affecting the treatment estimates. Care is taken to only sum over years prior to a claimant starting their spell in ‘UC intensive’. This avoids potential endogeneity that results if control variables are influenced by the treatment variable which could bias the results.
4. Outcomes framework
The framework used to break down claimant employment outcomes, seeks to address two challenges of evaluating the impact of a sanction. First, the type of claimants who are sanctioned are likely to have worse outcomes on average even were they not sanctioned. This is illustrated in Table 1, which shows that the average earnings of sanctioned claimants in the 6 months prior to their first spell in ‘UC Intensive’ is on average £187 lower than non-sanctioned claimants. Sanctioned claimants are also more likely to be young, single, not have children, not be a carer and not be a health claimant. These differences reinforce the fact that non-sanctioned claimants are systematically different from claimants that are sanctioned. [footnote 29] As will be explained in sections 5.1 and 6.1, the techniques used, dynamic treatment effects (section 5) and difference-in-difference (section 6) are selected specifically to address this issue.
Table 1: Characteristics of sanctioned and non-sanctioned claimants
| Variable | Non-sanctioned | Sanctioned |
|---|---|---|
| % parents | 34% | 19% |
| % carers | 4% | 1% |
| % females | 50% | 34% |
| mean age | 39 | 33 |
| % couple | 23% | 9% |
| % health | 20% | 7% |
| % single parent | 18% | 14% |
| % months employed pre | 35% | 20% |
| % months employed post | 45% | 41% |
| mean earnings pre | £349 | £162 |
| mean earnings post | £494 | £396 |
Note: Statistics averaged over the period January 2016 to April 2019 for claimants who are sanctioned in their first spell in UC ‘intensive’ compared to claimants who are not. Claimant characteristics are measured at the start of the spell for the reasons explained in section 3.1. Earnings and employment variables are averaged over the 6 months before or 6 months after this first spell. Age is measured in years.
The second challenge is selecting what outcome measure to use. A claimant may exit more quickly from UC, or ‘UC Intensive’ but not be earning much once they have exited. Equally, a claimant may have high earnings once they have exited but take a long time to do so. To address this, two distinct outcomes are used. First, the rate at which claimants exit UC, or ‘UC Intensive’. This analysis of spell durations is presented in section 5. The second outcome is a claimant’s earnings once they have exited ‘UC Intensive’. This analysis is presented in section 6.
The difference between the two approaches is shown schematically in Figure 1, which divides the claimant journey into the period pre-spell, in-spell and post-spell. The earnings analysis measures how a claimants’ earnings in the post-spell period are affected if they are sanctioned in-spell. The durations analysis measures how the length of a claimant’s spell is affected by a sanction. This allows both the in-spell and the post-spell effects of a sanction to be captured.
Figure 1: Outcomes framework
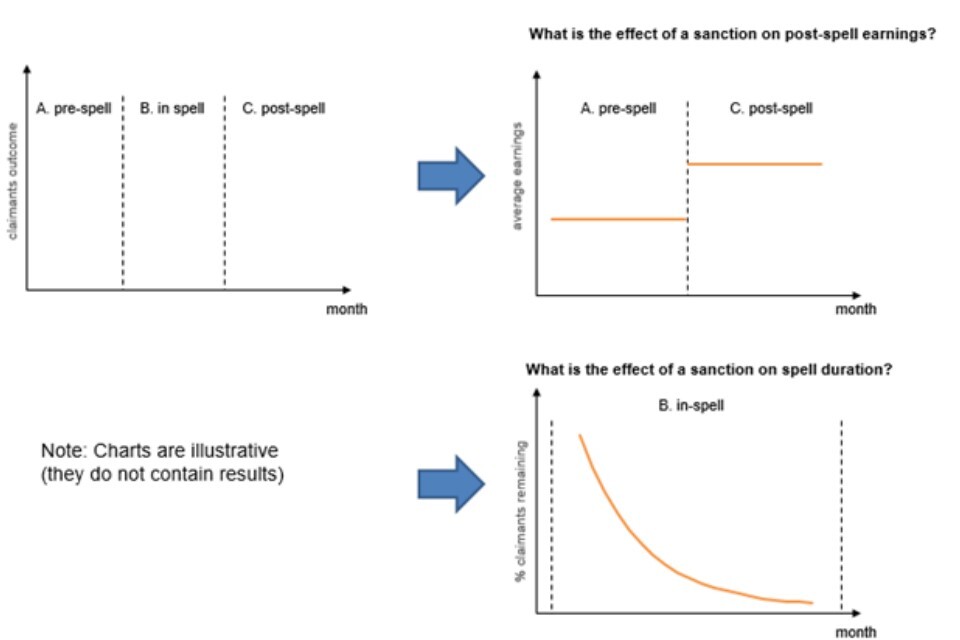
Note: The left graph shows how the framework used splits the claimant’s journey into three parts, A. pre-spell, B. in-spell and C. post-spell. Section 5 examines the in-spell outcome, answering the question, ‘What is the effect of a sanction on spell duration’ (graph at bottom right). Section 6 examines post-spell outcomes, answering the question, ‘What is the effect of a sanction on post-spell earnings (graph at top right).
5. Outcome 1: Duration on Universal Credit
Section 5 covers the methodology and results of the analysis of the impact of a sanction on spell duration. Section 5.1 discusses the methodology — explaining the construction of the model. Section 5.2 presents the results, covering the impact of a sanction on exit rates from Universal Credit (UC) altogether (Specification 1), and exit rates from ‘UC Intensive’ into any earnings state (Specification 2).
5.1 Methodology
The model used is a hazard regression model. Hazard regression models are commonly used models in the literature on assessing the impact of imposing benefit sanctions on unemployment duration. [footnote 30]
A hazard regression is similar to a standard regression, except it is continuous in time and allows for the inclusion of spells which may not have ended[footnote 31] but can still hold information that can be made use of. Covariates and results are calculated and interpreted in terms of their impact on the spell exit rate. [footnote 32]. In this context, an exit rate is the instantaneous rate of exiting UC[footnote 33] at a particular point in time, given that the claimant has been on UC until that point in time.
The history of events[footnote 34] are modelled using a proportional hazard (PH) framework, with dynamic treatment effects. [footnote 35] Identification of such models is given under a PH structure. In particular, there are two assumptions that must hold for the PH framework to be valid. [footnote 36] First, claimants must not anticipate the date of a sanction and respond behaviourally prior to that date. [footnote 37] Second, the exit rates must have a PH structure. Assuming a PH structure means that independent variables such as age and gender shift the exit rate by the same proportion at all durations.
The proportional hazard assumption is moderated through the use of a flexible, piecewise-constant duration dependence function. This means that spells are split into discrete durations, avoiding a reliance on the proportional hazard assumption over the entire spell. [footnote 38] This gives flexibility to the shape of the hazard curve, without imposing any functional form beyond the proportional hazard. This again follows the approach of Arni et al (2013).
The imposition of a sanction is modelled as a dynamic treatment effect, such that sanctioned claimants are allocated to the control group until the date they are sanctioned. This is in contrast to a static model which would allocate sanctioned claimants to the treatment group even before a sanction is imposed. Dynamic treatment allows for a more accurate estimation of the treatment effect (ie the impact of a sanction) and is possible because the dataset contains the exact date a sanction is imposed.
The precise method followed in the report does differ in one important way from Arni et al (2013). In that paper the authors jointly estimate the sanction hazard and the benefits exit hazard. This allows the unobserved heterogeneity to be modelled, thereby reducing any bias in the estimates of the impact of a sanction. To the extent that the method in this report does not fully account for systematic differences between sanctioned and non-sanctioned claimants, some bias in the estimate of the impact of the sanction may exist. [footnote 39]
Below is a simplified version of the model specification: [footnote 40]
UC Exit Rate = α + βSanction Flag +γ 1Controls + γ 2Local Area + residual
The coefficient, β on the sanction flag variable is the coefficient of interest, which reflects the percentage shift in a spell exit rate, as a result of the imposition of a sanction. The controls are variables such as age, gender and benefit history which account for systematic differences between claimants that may drive differences in exit rates. The ‘Local Area’ term accounts for geographic variation in exit rates and finally the residual term mechanically picks up any remaining variation in exit rates not explained by the independent variables. [footnote 41] The analysis is carried out for 0.6m individuals in the period January 2016 – August 2018. [footnote 42]
5.2 Results
This section presents the results from the hazard regressions for two different model specifications. The first specification treats a claimant’s entire time on UC as a spell and defines spell duration as the length of this period. The second specification treats a spell as a claimant’s time in ‘UC Intensive’ until moving into one of three states, UC ‘Working – with Requirements’, UC ‘Working – No Requirements’, and off UC with PAYE earnings. [footnote 43] Spell duration is then defined as the length of time until a claimant leaves ‘UC Intensive’ for that state. [footnote 44]
The first specification, reported in section 5.2.1, answers the question ‘Does a sanction lead a claimant to exit UC more quickly?’ This exit from UC could be because a claimant enters a job which pays sufficiently well to exhaust their UC entitlement, [footnote 45] or because they decide to close their claim.
The second specification, reported in section 5.2.2, answers the question ‘Does a sanction lead a claimant to increase their earnings more quickly?’. The second specification picks up impacts of a sanction increasing claimant earnings while staying on UC which would be missed in specification one.
5.2.1 Impact on Universal Credit spell duration[footnote 46]
Table 2: Specification 1 – Impact of a sanction on UC exit rate
| Exiting UC | Exiting UC with PAYE earnings | Exiting UC without PAYE earnings | |
|---|---|---|---|
| Overall | 1.08*** | 0.76*** | 1.86*** |
| Lone Parent | 0.78*** | 2.11*** | |
| Carer | 1.16* | 0.95* | 1.41*** |
| Health | 1.67*** | 0.99 | 2.27*** |
| Child | 1.14*** | 0.79*** | 1.71*** |
| Partner | 1.57*** | ||
| Under 26 | 1.05*** | 0.83*** |
Note: The table reports coefficients from Proportional Hazard regressions at the individual level with dynamic treatment. The results are presented, such that a coefficient of 1 indicates that a sanction does not affect the exit rate, whereas a coefficient of 2 means that the effect of a sanction on the exit rate is to double it. The outcome variable is exiting from Universal Credit into a state defined by the column header. Each row represents a different subsample of the data. The exact model specification is described in Appendix 3. Results significant to 1%***, 5%**, 10%*. An ellipsis indicates a sub-group for which the model algorithm did not converge.
Table 2 presents results from the first specification. The impact of a sanction on the rate of exit from UC is disaggregated into two, depending on whether the claimant exits with a record of PAYE earnings. [footnote 47] This is treated as a proxy for a claimant having a job.
The results in the first row of column 1 indicate that a sanction causes individuals to have 8% shorter UC claims than they would had they not been sanctioned. Columns 2 and 3 show that this aggregate result is driven by claimants exiting UC without PAYE earnings (86% shorter durations for exits into this state), which is likely to be a less desirable outcome.
Theoretically, the increased rate of UC exit without PAYE earnings is likely due to a lower UC payment decreasing the attractiveness of UC ‘Intensive’. [footnote 48] The fact that this drives exits into non-earning rather than earning states suggests that the affected claimants have low attachment to the labour market and a high estimation of the cost of meeting conditionality requirements. [footnote 49]
Low labour market attachment of claimants in the study sample could help explain why the results reported here differ from comparable findings in a non-GB context which find increased rates of exit into work as a result of a sanction. [footnote 50] The international literature studies sanctions in the context of unemployment insurance systems rather than a means-tested benefits system as here. As such, the study samples would typically consist of individuals with better employment histories and stronger labour market attachment. Such a group would face fewer barriers to returning to employment and therefore might be more likely to respond to a sanction by moving into a job. [footnote 51]
Table 2 also reports the results for claimant sub-groups. [footnote 52] The results are mostly similar to results for the full sample, the one notable exception being health claimants. In contrast to the overall results, for this subgroup the exit rate from UC into PAYE earnings is not significantly affected by a sanction, but they do experience the largest increase in the rate of exit into no PAYE earnings.
5.2.2 Impact on ‘UC Intensive’ spell duration
Table 3: Specification 2 – Impact of a sanction on ‘UC Intensive’ exit rate
| Group | Exiting Intensive |
|---|---|
| Overall | 0.97*** |
| Lone Parent | |
| Carer | 1.09 |
| Health | 1.23*** |
| Child | 0.93*** |
| Partner | 1.06** |
| Under 26 | 0.99 |
| Male | 1.05*** |
Note: The table reports coefficients from Proportional Hazard regressions at the individual level with dynamic treatment. The results are presented, such that a coefficient of 1 indicates that a sanction does not affect the exit rate, whereas a coefficient of 2 means that the effect of a sanction on the exit rate is to double it. The outcome variable is exiting from Universal Credit ‘Intensive’ into a state in which the claimant has PAYE earnings. Each row represents a different subsample of the data. The exact model specification is described in Appendix 3. Results significant to 1%***, 5%**, 10%*. An ellipsis indicates a subsample for which the model algorithm did not converge.
Table 3 presents the results from the second specification, looking at the impact on exits from ‘UC Intensive’ into a state where the claimant is expected to be working (regardless of whether on or off UC). Since the claimant is expected to be working upon exit from the spell, unlike in Table 2, the results are not disaggregated by whether a claimant has PAYE earnings.
The negative impact of a sanction on exits into earnings seen in specification 1 are much less substantial here, with only a small reduction in exit rates from UC ‘Intensive’. [footnote 53] Again, claimants with a health condition appear to be a relative outlier, with this group responding more positively than the others.
5.3 Discussion
Taken together, specifications 1 and 2 suggest that sanctions do not lead to large shifts in job finding rates but may affect the type of job that people take-up, shifting people towards lower paying work that changes their UC work group without ending their UC spell. [footnote 54]
The finding that claimants are exiting less quickly into work differs from the findings in the international literature using the same hazard regression method. [footnote 55] This could be due to the differences between the UK benefits system and that of other countries, where unemployment insurance plays a bigger role. As discussed in section 2.1, this could mean that the claimants that are the subject of this study have worse income histories and lower labour market attachment, which could make them respond worse to the imposition of a sanction.
The other explanation for the difference compared to the international literature is that the method used in this report has not fully accounted for systematic differences between sanctioned and non-sanctioned claimants. As explained in section 5.1, though the method does control for a rich set of claimant characteristics, and uses dynamic treatment effects, it does fall short of the latest academic standard in terms of accounting for bias in the estimate by modelling the unobserved heterogeneity.
6. Outcome 2: Post-spell earnings
6.1 Methodology
6.1.1 Approach
The impact on earnings is evaluated using a difference-in-difference approach. This method compares the earnings of claimants before and after their first spell in ‘UC Intensive’. Figure 2 illustrates the approach. The counterfactual post-spell earnings trajectory of sanctioned claimants is assumed to follow the path of non-sanctioned claimants but shifted down by the average pre-spell difference in earnings.
Figure 2: The difference-in-difference method applied to spells
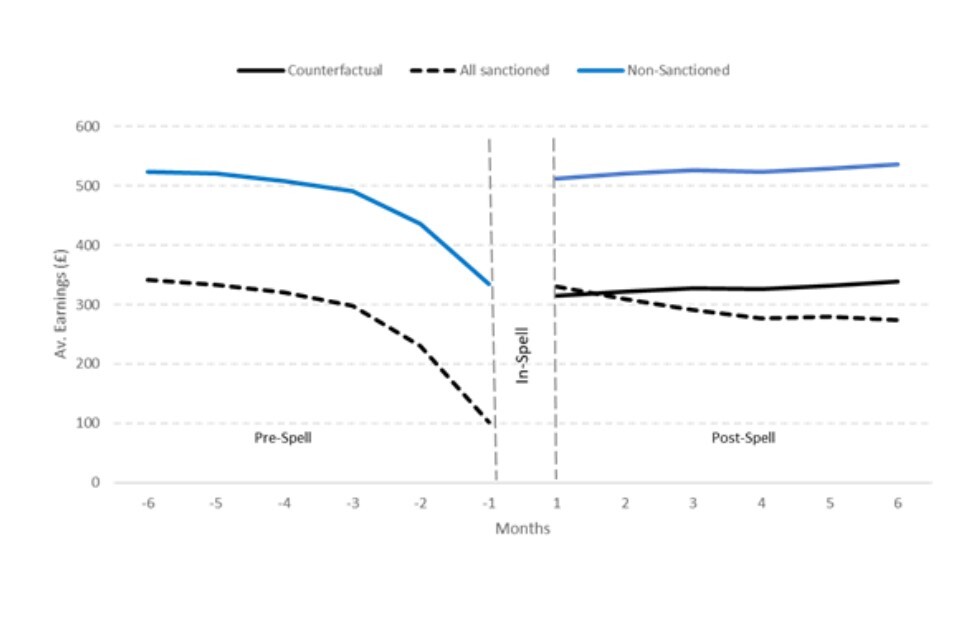
Note: The figure illustrates the difference-in-difference method using the period 6 months prior to flowing into ‘UC Intensive’ and the period 6 months prior to inflow. In-spell earnings data is not included in the analysis. Lines are for illustrative purposes only.
As discussed in section 4, a key challenge to evaluating the impact of a sanction is that those who are sanctioned are likely to have systematically different characteristics from those who are not sanctioned, which could drive differences in earnings.
The difference-in-difference approach means that differences in characteristics that affect the levels of earnings of individuals will not impact the validity of the results. Instead, the validity relies on the parallel trends assumption, that the post-spell earnings trajectory for sanctioned claimants would have been parallel to the earnings trajectory of non-sanctioned claimants had the sanction not happened, a more plausible assumption. This technique is supplemented by the use of an extensive set of controls. This includes jobcentre fixed effects and full benefits histories, which would be expected to account for a lot of the unobserved differences between sanctioned and non-sanctioned groups, even in the absence of the difference-in-differences method.
6.1.2 Sample Selection
The analysis looks at UC full service data in the period from January 2016 to April 2019. Two additional sample restrictions are made to better align the analysis with the question of interest. First, the analysis is restricted to first spells in ‘UC Intensive’ rather than spells on UC as a whole, because claimants can move into work while still on UC, and the earnings impact in this state should not be excluded. Only first spells are used to avoid any possible interaction between a claimant receiving a sanction in the first spell and their behaviour in subsequent spells of ‘UC Intensive’.
Second, in-spell earnings changes are excluded from the analysis. These exist because claimants can move in and out of work while in ‘Intensive’. These changes are small, as if a single claimant monthly earnings exceed £343[footnote 56], the Administrative Earnings Threshold (AET), they will enter the ‘Light Touch’ UC work group. This corresponds to around 10 hours per week at the minimum wage. [footnote 57]
Only claimants with at least 6 months of earnings data before their spell in ‘UC Intensive’ and 6 months of earnings data after their spell are included in the sample, which excludes some claimants at the very start and at the very end of the sample period. This is to ensure the number of claimants in the sample is the same in each month averaged over. Sensitivity to this sample selection is examined at the end of section 6.2. Finally, to keep the sample reasonably homogenous and avoid anomalous data points, claimants younger than 16 and older than 65, are excluded, as are claimants with any negative earnings values or monthly earnings in excess of £6,000 in any given month. After restricting the sample in these ways the remaining sample consists of 1.27m UC full service claimants.
6.1.3 Specification
Below is a simplified version of the model specification[footnote 58]:
ΔEarnings = α + βSanction Flag+γ1 Controls + γ2 Local Area+ residual
In the above, on the left hand side of the equation, the outcome variable, ΔEarnings is the average earnings in the six months before a claimant enters ‘UC Intensive’, subtracted from the average earnings in the six months after they flow off.
The coefficient, β on the sanction flag variable is the coefficient of interest, which indicates the impact on earnings, as a result of the imposition of a sanction. The controls are variables such as age, gender, date of exit and benefit history which account for differences between claimants which may be driving differences in exit rates. The ‘Local Area’ term accounts for geographic variation in earnings and finally the residual term mechanically picks up any remaining variation in earnings not explained by the independent variables. [footnote 59]
6.2 Results
6.2.1 Main results
The main set of results examine the effect of the average sanction on the average claimant. These are reported in Table 4.
Table 4: Impact of a sanction on earnings and employment
| Earnings (£) | Employment (p.p.) | Earnings when employed (£) | |
|---|---|---|---|
| Impact | -34*** (4.47) | -0.01** (0.00) | -32*** (7.42) |
Note: The table reports OLS regressions at the individual level. Column 1 dependent variable is the change in average monthly earnings between the six months after exiting ‘UC Intensive’ and the six months prior to flowing on. Column 2 dependent variable is the change in percentage of months spent in employment between the six months after exiting ‘UC Intensive’ and the six months prior to flowing on. Column 3 is the change in average monthly earnings for the months in which a claimant was in employment, between the six months after exiting ‘UC Intensive’ and the six months prior to flowing on. Standard errors in parentheses. *** p<0.01, ** p<0.05, * p<0.1.
The impact of a sanction is to reduce earnings by £34 per month over the 6-month period after exiting UC ‘Intensive’. This is the average over months where the claimant is employed and earning a positive amount, and where the claimant is not employed and therefore earning £0.
To determine whether this result is driven by the claimant spending fewer months in employment, or by the claimant earning less when employed, results are produced for two alternative dependent variables, percentage of months spent in employment (column 2), and earnings while employed (column 3). These show that a sanctioned claimant spends 0.01 percentage points fewer months in employment and earns £32 per month less when employed, indicating that lower average earnings is driven by a sanctioned claimant earning less when employed, rather than spending fewer months in employment. [footnote 60]
Evidence of lower earnings and months in employment is consistent with the international literature discussed in section 2.1. Economic theory suggests this is driven by sanctioned claimants lowering their wage expectations[footnote 61] as being unemployed becomes less attractive when they are no longer in receipt of their UC standard allowance. In other words, they are under greater financial pressure to find a job, and therefore may be more likely to accept a job which pays less.
The results are robust to changes in the specification. Restricting the sample to spells starting in May 2018 or earlier substantially reduces the number of unfinished spells in the sample. This acts as a test for whether differences in the number of finished spells is driving the differences in outcomes between sanctioned and non-sanctioned. A second test, controlling for spell duration[footnote 62] addresses the possibility that the negative financial outcomes observed for sanctioned claimants may be driven by their having systematically longer spells. [footnote 63] In both cases the impact does not change materially as a result of the change in specification. [footnote 64]
The longer term effect is examined by altering the period of the outcome variables to 12 months. [footnote 65] The impact does not change materially, with a small but not statistically significant more negative impact on post-spell earnings for 12 months compared to 6. [footnote 66]
6.2.2 Subgroup analysis
Table 5 reports the results broken down by claimant subgroup, as defined in the month they enter UC ‘Intensive’. The results show that in contrast to the overall result, female claimants and claimants with a partner do not experience a statistically significant negative earnings effect of being sanctioned. Similarly, claimants with a health condition experience a small positive but statistically insignificant effect. The impact on claimants who are carers is also not statistically significant, but this is likely driven by the low sample size for this group. [footnote 67] Claimants who are parents and do not have a partner (lone parents), parents, and claimants aged less than 26, all see similar impacts to the overall effect of -£34 per month.
Table 5: Impact on earnings by characteristic
| Group | Earnings (£) |
|---|---|
| Overall | -34*** (4.47) |
| Lone parent | -33*** (11.37) |
| Female | -12* (6.56) |
| Parent | -38*** (9.42) |
| Health | 19* (11.29) |
| Age < 26 | -43*** (6.82) |
| Partner | -11 (12.31) |
| Carer | -34 (29.52) |
Note: The table reports OLS regressions at the individual level. The dependent variable is the change in average monthly earnings between the six months after exiting ‘UC Intensive’ and the six months prior to flowing on. Standard errors in parentheses. *** p<0.01, ** p<0.05, * p<0.1.
6.2.3 Segmentation by sanction type and escalation
This section reports the results broken down according to sanction level and escalation. Sanctions increase in duration according to how serious the reason for the sanction is (the level) and the number of failures a claimant has had for sanctions of a particular level (the escalation). [footnote 68] The four sanction levels are lowest, low, medium and high and there are up to three escalations in severity, depending on the sanction level. The severity of a sanction ranges from 7 days for the least severe to 1095 days for the most severe. [footnote 69]
To break down the results according to sanction level sanctioned claimants are grouped according to the highest sanction level imposed in the spell. [footnote 70] This uniquely assigns a sanctioned claimant to a particular level which avoids double-counting, and is based on the assumption that it is the highest sanction level a claimant has imposed in a spell that will have the most material effect on their behaviour. Similarly, sanctioned claimants are grouped according to the highest sanction escalation imposed in a spell.
Table 6: Impact of a sanction on earnings by sanction escalation
| Escalation | Earnings (£) |
|---|---|
| First | -15** (5.07) |
| Second | -79*** (12.81) |
| Third | -94*** (22.83) |
Note: The table reports OLS regressions at the individual level. The dependent variable is the change in average monthly earnings between the six months after exiting ‘UC Intensive’ and the six months prior to flowing on. Each row corresponds to the subsample that had at most that number of failures in their spell. Standard errors in parentheses. *** p<0.01, ** p<0.05, * p<0.1.
The results for sanction escalation are shown in Table 6. Sanctions of all escalations have a statistically significant negative impact on claimant earnings. Outcomes for sanctioned claimants who experience a second or third escalation are the most negative at -£79 and -£94. 76% of claimants in the sample period only have a first escalation sanction imposed, so a relatively small fraction of sanctioned claimants are experiencing the most negative earnings impact.
It should be noted that the impacts are not additive. Because of the way it’s defined, the 3rd failure category already includes the impact of the first and second failures. The difference between receiving two failures and three failures (£94-£79=£15) is not statistically significant.
Table 7: Impact on earnings by sanction level
| Level | Earnings (£) |
|---|---|
| High | 17 (16.51) |
| Medium | -16 (15.95) |
| Low | -39*** (4.77) |
Note: The table reports OLS regressions at the individual level. The dependent variable is the change in average monthly earnings between the six months after exiting ‘UC Intensive’ and the six months prior to flowing on. Standard errors in parentheses. *** p<0.01, ** p<0.05, * p<0.1.
The results for sanction level are shown in Table 7. Claimants only see a statistically significant negative impact when the highest sanction level imposed is a low level sanction (-£39 per month). When the highest sanction imposed is a high or medium sanction the impact is not statistically significant, even at the 10% level. 91% of sanctioned claimants in the sample period only have a low level sanction imposed. Lowest level sanctions are not included in the analysis as these are due to failures in the UC ‘Work Focused Interview’ work group rather than ‘UC Intensive’ which is the focus of this report.
Despite only one level grouping being statistically significant, this is still sufficient to drive the overall impact of -£34 per month presented in section 5.2.1. This is because the vast majority of sanctions are for low level sanctions[footnote 71] so this figure makes the biggest contribution to the overall effect. Unlike sanction escalations, a claimant can have a medium sanction imposed without having had a low and lowest sanction as well, so an accumulation of impacts for higher levels is not expected.
7. Limitations
There are three main limitations to the analysis which should be noted. First, the method used to determine the causal impact of a sanction is not a randomised control trial, which makes it difficult to reliably isolate the true effect. There is a prior association between someone who is sanctioned and worse labour market outcomes. The results in this report are based on sophisticated methods and control for a rich set of individual characteristics including earnings and benefit histories for the previous 5 years, but to the extent that this approach does not fully account for claimant differences there will be a bias in the estimates of the sanction impacts.
Second, the analysis is limited to UC claims from January 2016 to April 2019.The sanctions regime and rate was not stable prior to January 2019, as the roll out of UC full service was only completed at the end of 2018. [footnote 72] This limits the extent to which the results are generalisable to the more stable regime observed in FY19/20. [footnote 73] In addition, this was a period of low unemployment. The caseload might therefore have consisted of claimants with lower labour market attachment who are less likely to be pushed into good employment by the imposition of a sanction.
Third, due to limits on data availability, the analysis omits non-PAYE earnings from the outcome measures. This means that some positive financial outcomes involving, for example, claimant exits into self-employment, will be missed from the analysis. [footnote 74]
These limitations are typical of a study of this type and do not invalidate the conclusions. It does mean that the results presented here are not definitive and should be considered alongside evidence from other studies of the impact of a sanction, as well as qualitative evidence of claimant and work coach experience.
8. Conclusion
In summary, a sanction leads the average claimant to exit less quickly into PAYE earnings and to earn less upon exiting. In a narrow sense, this constitutes a negative impact of a sanction on claimant finances. However, this excludes the wider role of a sanction, which acts as a deterrent to incentivise compliance with a conditionality regime that encourages work search and earnings increases. This report assesses the impact of implementing a sanction but does not address the deterrent effect.
The negative financial effect reported should therefore be balanced against the likely positive deterrent effect that the sanction regime has by incentivising claimant attendance, an effect which will be experienced by all claimants subject to conditionality, regardless of whether they are sanctioned. [footnote 75] This is particularly pertinent in light of the reduced sanction rate, which was over 6% in August 2017 but has been below 3% since August 2018, meaning that the proportion of claimants subject to the impacts described in this report is relatively low. Indeed, the policy intent of sanctions policy is not to sanction claimants but to encourage claimants to comply with their requirements by creating a consequence if they do not. Any question about the appropriate strictness of a sanction, to encourage work search whilst preserving as far as possible the insurance principles of benefit receipt, should take this into account.
References
Abbring, J.H. and Van den Berg, G.J., 2003. The nonparametric identification of treatment effects in duration models. Econometrica, 71(5), pp.1491-1517.
JH Abbring, GJ Van den Berg and JC Van Ours, The effect of unemployment insurance sanctions on the transition rate from unemployment to employment, Economic Journal, vol. 115, pp. 602–630, 2005.
P Arni, R Lalive, and JC Van Ours, How effective are unemployment benefit sanctions? Looking beyond unemployment exit, Journal of Applied Econometrics, vol. 28, pp. 1153–78, 2013.
B Boockmann, SL Thomsen and T Walter, Intensifying the use of benefit sanctions –an effective tool to shorten welfare receipt and speed up transitions to employment? IZA Journal of Labor Policy 3:21, 2014.
Boone, J. and Van Ours, J.C., 2006. Modeling financial incentives to get the unemployed back to work. Journal of Institutional and Theoretical Economics (JITE)/Zeitschrift für die gesamte Staatswissenschaft, pp.227-252.
Boone, J., Fredriksson, P., Holmlund, B. and Van Ours, J.C., 2007. Optimal unemployment insurance with monitoring and sanctions. The Economic Journal, 117(518), pp.399-421.
Department for Work and Pensions (Research Report No 382), Middlemas, J., 2006, Jobseekers Allowance intervention pilots quantitative evaluation. https://webarchive.nationalarchives.gov.uk/20130314010347/http://research.dwp.gov.uk/asd/asd5/rrs-index.asp (Takes you to the Index – RR382)
Department for Work and Pensions (ad hoc Research Report no. 15), 2015, Jobseekers Allowance Signing Trials. https://assets.publishing.service.gov.uk/government/uploads/system/uploads/attachment_data/file/398803/jsa-signing-trials.pdf
Department for Work and Pensions (commissioned by), Ipsos Mori (carried out by), 2015, Universal Credit Extended Gateway Evaluation, p.38. https://assets.publishing.service.gov.uk/government/uploads/system/uploads/attachment_data/file/481865/universal-credit-extended-gateway-evaluation.pdf
Department for Work and Pensions (ad hoc Research Report no. 59), 2018, Weekly Work Search Review Trial. https://assets.publishing.service.gov.uk/government/uploads/system/uploads/attachment_data/file/721910/weekly-work-search-review-trial.pdf
Dwyer, P. and Bright, J., 2018. Welfare conditionality: Sanctions support and behaviour change. Final Findings Report.
RC Fording, SF Schram and J Soss, Do welfare sanctions help or hurt the poor? Estimating the causal effect of sanctioning on client earnings, Social Service Review,vol. 87, No. 4, pp. 641–676, 2013.
J Griggs, M Evans, Sanctions with conditional benefit systems, a review of evidence. (2010) https://www.jrf.org.uk/sites/default/files/jrf/migrated/files/conditional-benefit-systems-full.pdf
B Hofmann, Short and long-term ex-post effects of unemployment insurance sanctions. Jahrbücher für Nationalökonomie und Statistik, 232(1), 31–60, 2012.
B Van der Klaauw and JC Van Ours, Carrot and stick: How re-employment bonuses and benefit sanctions affect exit rates from welfare, Journal of Applied Econometrics, Vol. 28, pp. 275–96, 2013.
R Lalive and J Zweimüller, The effect of benefit sanctions on the duration of unemployment, Journal of the European Economic Association, vol. 3, No. 6, pp. 1386–1417, 2005.
R Loopstra, A Reeves, M McKee and D Stuckler, Do punitive approaches to unemployment benefit recipients increase welfare exit and employment? A cross-area analysis of UK sanctioning reforms, Sociology working paper 2015-01, Department of Sociology, University of Oxford, 2015.
K-U Müller and V Steiner, Imposed benefit sanctions and the unemployment to employment transition: the German experience, Discussion papers, German Institute for Economic Research, No. 792, 2008.
National Audit Office, Benefit Sanctions, 2016. Paragraph 3.10 and the Technical Appendix.
M Svarer, The effect of sanctions on exit from unemployment: evidence from Denmark, Economica, vol. 78, pp. 751–78, 2011.
GJ Van den Berg, B Hofmann, and A Uhlendorff, The role of sickness in the evaluation of job search assistance and sanctions, DIW Berlin Discussion paper 1542, German Institute for Economic Research (DIW), Berlin, 2016.
GJ Van den Berg, B Van der Klaauw and JC Van Ours, Punitive sanctions and the transition rate from welfare to work, Journal of Labor Economics, vol 22, pp. 211–41, 2004.
Van den Berg, G.J., 2001. Duration models: specification, identification and multiple durations. In Handbook of econometrics (Vol. 5, pp. 3381-3460). Elsevier.
Van den Berg, G.J. and Vikström, J., 2014. Monitoring job offer decisions, punishments, exit to work, and job quality. The Scandinavian journal of economics, 116(2), pp.284-334.
GJ Van den Berg, A Uhlendorff and J Wolff, Sanctions for young welfare recipients,
Working Paper, IFAU – Institute for Evaluation of Labour Market and Education Policy, No. 2013:26, 2013.
Webster, D., 2017. Benefit sanctions statistics: JSA, ESA, Universal Credit and income support for lone parents. Child Poverty Action Group [http://www. cpag.org. uk/david-webster], accessed, 6.
Williams, E., 2020. Punitive welfare reform and claimant mental health: The impact of benefit sanctions on anxiety and depression. Social Policy & Administration.
Appendix A.1a Durations Table
| Sanction equivalent to 100% of standard allowance | Old JSA/ESA/IS sanctions | Revised 2012 onwards JSA/ESA/IS sanctions: 1st failure | Revised 2012 onwards JSA/ESA/IS sanctions: 2nd failure | Revised 2012 onwards JSA/ESA/IS sanctions: 3rd failure | Universal Credit: 1st failure | Universal Credit: 2nd failure | Universal Credit: 3rd failure |
|---|---|---|---|---|---|---|---|
| JSA High Level eg refusing employment | Variable 1- 26 weeks | 13 weeks | 26 weeks | 156 weeks | 91 days | 182 days | 1095 days Nov 2019, reduced to 6 months |
| JSA Intermediate Level (Medium Level in UC) eg failure to be available for work | Disentitlement | Disentitlement and 4 weeks loss of benefit (including disentitlement period) | 13 weeks loss of benefit (including disentitlement period) | 13 weeks loss of benefit (including disentitlement period) | 28 days | 91 days | 91 days |
| JSA Low level eg failure to attend, failure to undertake specific work search action | JSA: 1,2,4 or 26 weeks | 4 weeks | 13 weeks | 13 weeks | 7 days | 14 days | 28 days |
| ESA Low level eg failure to undertake work preparation action | ESA: Open ended until engagement | 1 week | 2 weeks | 4 weeks | 7 days | 14 days | 28 days |
| Income Support Lowest level eg failure to attend WFI | IS: 20%. Open ended until engagement | IS: – no change | IS: – no change | IS: – no change | Open ended until engagement - Equivalent to 40%of standard allowance | Open ended until engagement - Equivalent to 40%of standard allowance | Open ended until engagement - Equivalent to 40%of standard allowance |
Appendix A.1b Rates Table
| Conditionality group | Regime | Sanctioned claimant’s age | Single or joint claim | % of standard allowance sanctionable1 |
|---|---|---|---|---|
| All Work Related Requirements | Intensive Work Search Light Touch (see footnotes) |
Under 18 | Single | 40% |
| All Work Related Requirements | Intensive Work Search Light Touch (see footnotes) |
Under 18 | Joint (per sanctioned claimant) | 20% |
| All Work Related Requirements | Intensive Work Search Light Touch (see footnotes) |
18 or over | Single | 100% |
| All Work Related Requirements | Intensive Work Search Light Touch (see footnotes) |
18 or over | Joint (per sanctioned claimant) | 50% |
| Work Preparation Requirements | Work Preparation | Under 18 | Single | 40% |
| Work Preparation Requirements | Work Preparation | Under 18 | Joint (per sanctioned claimant) | 20% |
| Work Preparation Requirements | Work Preparation | 18 or over | Single | 100% |
| Work Preparation Requirements | Work Preparation | 18 or over | Joint (per sanctioned claimant) | 50% |
| Work Focussed Interview Requirements only | Work-Focussed interview only | All | Single | 40% |
| Work Focussed Interview Requirements only | Work-Focussed interview only | 18 or over | Joint (per sanctioned claimant) | 20% |
| No Work Related Requirements (NWRR) | Working Enough | Under 18 | Single | 40% |
| No Work Related Requirements (NWRR) | Working Enough | Under 18 | Joint (per sanctioned claimant) | 20% |
| No Work Related Requirements (NWRR) | Working Enough | 18 or over | Single | 100% |
| No Work Related Requirements (NWRR) | Working Enough | 18 or over | Joint (per sanctioned claimant) | 50% |
| No Work Related Requirements (NWRR) | NWRR (FT Carers) | Under 18 | Single | 40% |
| No Work Related Requirements (NWRR) | NWRR (FT Carers) | Under 18 | Joint (per sanctioned claimant) | 20% |
| No Work Related Requirements (NWRR) | NWRR (FT Carers) | 18 or over | Single | 100% |
| No Work Related Requirements (NWRR) | NWRR (FT Carers) | 18 or over | Joint (per sanctioned claimant) | 50% |
| No Work Related Requirements (NWRR) | NWRR (Limited Capability for Work and Work-Related Activities) | All | All | 0% |
Appendix A.2 Variable list
| Variable | Data source | Explanation |
|---|---|---|
| Sanction | UC admin data | Dummy equal to 1 if claimant has a reduction in payment due to a sanction |
| Parent | UC admin data | Dummy equal to 1 if claimant has children relevant to their UC claim |
| Carer | UC admin data | Dummy equal to 1 if claimant has a carer element |
| Gender | UC admin data | Dummy equal to 1 if claimant is female |
| Age (5 year bands) | UC admin data | Categorical variable in 5 year age bands ranging from 0-20 to 60+ |
| Partner | UC admin data | Dummy equal to 1 if UC claim is a joint claim |
| Lone-parent | UC admin data | Dummy equal to 1 if claimant is a parent and does not have a partner |
| Health | UC admin data | Dummy equal to 1 if claimant receives the health element of the UC claim and/or they are on the health journey[footnote 76] |
| Earnings history | UC admin data | Average earnings in the 6 months prior to entering UC Intensive |
| Employment history | UC admin data | Average number of months in employment in the 6 months prior to entering UC Intensive |
| Date of inflow | UC admin data | Fixed effect for the calendar month a claimant entered UC intensive |
| Date of exit | UC admin data | Fixed effect for the calendar month a claimant exited from UC intensive |
| Employed at inflow | UC admin data | Dummy equal to 1 if claimant is employed in their first assessment period on UC intensive |
| Employed prior to inflow | UC admin data | Dummy equal to 1 if claimant is employed in the month prior to entering UC Intensive |
| Regime prior to inflow | UC admin data | Fixed effect for the claimant UC work group in the month prior to entering UC intensive |
| Jobcentre | UC admin data | Fixed effect for the claimant job centre |
| Duration category | UC admin data | Fixed effect for length of spell on UC or in UC Intensive |
| JSA | RAPID data | Total weeks/amount of Job Seekers Allowance |
| ESA | RAPID data | Total weeks/amounts of Employment Support Allowance |
| WTC | RAPID data | Total weeks/amount of Working Tax Credit |
| CTC | RAPID data | Total weeks/amount of Child Tax Credit |
| Income Support | RAPID data | Total weeks/amount of Income Support |
| Housing benefit | RAPID data | Total weeks/amount of Housing Benefit |
| PIP | RAPID data | Total weeks/amount of Personal Independence Payments |
| Universal Credit | RAPID data | Total weeks/amount of Universal Credit |
| ICA | RAPID data | Total weeks/amount of Invalid Carers Allowance |
| Self-Employment | RAPID data | Total weeks/amount of self-employment |
| Total Income | RAPID data | Total income from all RAPID activities |
| Employment | RAPID data | Total weeks/amount of employment |
| Household type | RAPID data | Tax Credit type (CTC only, WTC only, or both) |
| Number of children | RAPID data | Number of children included |
| Number of employments | RAPID data | Number of employment records in the year |
| Number of households | RAPID data | Number of Tax Credit households the person has been a part of |
| Number of SA returns | RAPID data | Number of returns from self-employment schedules |
Appendix A.3 Durations regression specification
The full version of the specification referred to in section 5.2 is the following:
λ(t|Xi) = λ0 (t)exp (βsanctionedi + JCPJ’ γ + Xi‘δ + Ri’ ζ + νi)
In the above, on the left hand side of the equation, the outcome variable, λ(t|Xi) is the hazard function at time t for subject i with covariate vector Xi. For the results presented in section 5.2.1, this is the hazard of exiting Universal Credit. For the results presented in section 5.2.2, this is the hazard of exiting ‘UC Intensive’ into an in-work state. In the two cases, the right hand side of the specification is the same.
On the right hand side, λ0 (t), is the baseline hazard function at time t, which describes how the hazard changes over time at baseline levels of the covariates. The covariate is a dummy variable equal to one for a claimant with a sanction applied at time t and equal to 0 otherwise. This is the treatment variable in the analysis.
The rest of the variables in the specification are controls. The fixed effect, JCPJ’ is a vector of job centre dummy variables for each job centre, J. This controls for any job centre characteristics that affect λ(t|Xi). The symbol Xi’ is a vector of claimant characteristics, Ri’ is a vector of benefits and earnings history controls derived from the RAPID dataset. This includes polynomials of histories up to the second order, to better account for potentially non-linear relationships between a claimant’s history and their exit hazard. Finally νi is the individual specific residual variation not accounted for by the other variables in the regression specification[footnote 77]. This specification is estimated using a piecewise-constant duration dependence function with splits at days 15, then every 15 days until day 135, day 150 then splits every 30.
Appendix A.4 Earnings regression specification
The full version of the specification referred to in section 6.2 is the following:
ΔEarningsi = α + βsanctionedi + JCPJ’ γ + Xi’ δ + Si’ ϵ + Ri’ ζ + Di’ η+Fi’ θ + νi
In the above, on the left hand side of the equation, the outcome variable, ΔEarningsi, is the average earnings in the six months before a claimant flows into ‘Intensive’, subtracted from the average earnings in the six months after they flow off.
On the right hand side, is a dummy variable equal to one when an adverse sanction decision is made for claimant in their spell in ‘UC Intensive’ and equal to 0 otherwise. This is the treatment variable in the analysis.
The rest of the variables in the specification are controls. The fixed effect, JCPJ’ is a vector of job centre dummy variables for each job centre, J. This controls for any job centre characteristics that affect ΔEarningsi. The symbol Xi’ is a vector of claimant characteristics, Si’ is a vector of benefits and employment state dummies, controlling for employment and benefits state in the month before entering full-conditionality. Ri’ is a vector of benefits and earnings history controls. This includes polynomials of histories up to the fifth order, to better account for potentially non-linear relationships between a claimant’s history and their earnings outcomes. Finally, Di’ is a vector of date dummies for date of inflow into ‘UC Intensive’ and date of off-flow from ‘UC Intensive’, Fi’ is a vector of additional state specific fixed effects and νi is the individual specific residual variation not accounted for by the other variables in the regression specification. [footnote 78]
-
WPSC report available at this link: https://publications.parliament.uk/pa/cm201719/cmselect/cmworpen/955/955.pdf ↩
-
Government response available at this link: https://publications.parliament.uk/pa/cm201719/cmselect/cmworpen/1949/1949.pdf ↩
-
This could be non-PAYE employment (including self-employment), or economic inactivity (including full-time education). ↩
-
See appendix 2 for a precise definition. ↩
-
The regime for claimants who are able to work, but are either not working at the moment or are in work but earning low amounts below the Administrative Earnings Threshold. Loosely, this is equivalent to income-based JSA in the Universal Credit world. ↩
-
There is a broad evidence base supporting the effectiveness of regimes of weekly and fortnightly signing, see discussion in section 1.1 ↩
-
WPSC report available at this link: https://publications.parliament.uk/pa/cm201719/cmselect/cmworpen/955/955.pdf ↩
-
Government response available at this link: https://publications.parliament.uk/pa/cm201719/cmselect/cmworpen/1949/1949.pdf ↩
-
1) Fortnightly signing: Department for Work and Pensions, Middlemas, J. (2006). 2) Weekly signing post 13 weeks: Department for Work and Pensions (2015). 3) Weekly signing first 13 weeks: Department for Work and Pensions (2018). ↩
-
Griggs and Evans (2010) have a summary. ↩
-
See section 2.1 for a discussion of the evidence that does exist. ↩
-
Income based Job Seekers Allowance, income based Employment Support Allowance, Income Support, Housing Benefit, Working Tax Credits and Child Tax Credits ↩
-
This is the latest month included in the data sample used for the analysis presented in this report ↩
-
These are the legal terms. These labour market regimes map on to the UC work groups used on the UC system as follows: ‘all work-related requirements’ (‘Intensive’ and ‘Light Touch’), ‘work preparation requirements’ (‘Work Preparation’) ‘work-focused interview requirements’ (‘Work Focused Interview’). ↩
-
Strictly, weekly earnings less than the Administrative Earnings Threshold which corresponds to roughly 10 hours at the minimum wage. ↩
-
A claimant on the health journey either has a fit note and is awaiting their Work Capability Assessment or has passed it, putting them in the ‘No Work Requirements’ or ‘Work preparation’ UC work groups. ↩
-
See Reductions table in Appendix 1b ↩
-
See Durations table in Appendix 1a. ↩
-
Arni et al (2013), use imputed variation in strictness between job centres to assess the impact of conditionality. Reproducing the same method with the dataset which is the subject of this report were highly sensitive to model specification and are therefore not sufficiently robust to warrant inclusion in this report. ↩
-
Report available at this link: https://www.nao.org.uk/wp-content/uploads/2016/11/Benefit-sanctions.pdf ↩
-
Abbring et al. (2005), Arni et al. (2013), Boockmann et al. (2014), Fording et al. (2013), Hofmann (2012), Van der Klaauw and JC Van Ours (2013), Lalive and J Zweimüller (2005), Loopstra et al. (2015), Müller and V Steiner (2008), Svarer (2011), Van den Berg et al. (2004), Van den Berg and J Vikstrom (2009), Van den Berg et al. (2013), Van den Berg et al. (2016). ↩
-
The reservation wage is the lowest wage offer from an employer for which an unemployed individual would accept a job. The extent to which the wage can adjust is limited in the UK by the National Minimum Wage, so in practice a lower reservation wage may be seen in a reduction in the minimum number of hours a claimant is willing to accept. ↩
-
An individual is economically inactive if they are not in a job and not searching for work. ↩
-
Note that repayment of a recoverable hardship payment starts when the sanction finishes, as long as the deductions cap hasn’t been reached. ↩
-
In addition, those who move into ‘UC Working Enough’ for six months (this is the same as over CET for six months) have their remaining sanctions cancelled, though this would only be relevant to claimants with multiple sanctions or a 3-year high-level sanction. ↩
-
This is however less relevant to answering the question of how UC is functioning now. ↩
-
In the narrow sense, defining a lone parent as someone who does not live with the other parent of the child. ↩
-
This is sometimes referred to as the ‘bad control’ problem. ↩
-
Note, all variables are measured prior to a claimant being sanctioned, so it is not likely that the sanction itself is causing this difference. ↩
-
See for example, Lalive et al. (2005), Van den Berg and Vikström (2014), and Arni et al (2013), the latter of which in particular this report follows closely. ↩
-
These are known as censored spells. ↩
-
It is standard to use the term ‘hazard rate’, but for readability, the term ‘exit rate’ will be used to refer to the hazard rate. ↩
-
The terms ‘UC spells’ and ‘UC exit rates’ are used loosely here to describe the method. The specific definition of a claimant spell used to generate the results is described in section 5.2. ↩
-
For example, the date of a UC spell closing, or, the date of a sanction being imposed for a specific UC spell. ↩
-
This is explained in the next paragraph. ↩
-
This is outlined in Abbring and Van den Berg (2003). ↩
-
This is the ‘no anticipation’ assumption. ↩
-
Effectively the PH assumption is only made within each discrete period. ↩
-
This approach was not followed as convergence for such models can take months to achieve. ↩
-
See Appendix 3 for the complete model specification. ↩
-
Not mentioned is α, the intercept, which is the average earnings change conditional on all independent variables being equal to 0. ↩
-
This is a shorter period than the earnings work. as a different data source is used, which only registers a sanction when it is finished. To avoid falsely labelling sanctioned claimants as sanctioned, the sample is restricted to a period over which this information is to a large extent known. This dataset is more convenient for the hazard modelling technique that is employed. ↩
-
These are the states where a claimant would be expected to be earning. In the other UC work groups, ‘Work Focused Interview’, ‘Work Preparation’ and ‘No Conditionality’, claimants will typically not be earning. ↩
-
For example, an individual comes onto UC into ‘UC Intensive’ and then finds a job, moving into the ‘Light Touch’ conditionality regime on day 30. They later increase their hours and move completely off of UC on day 90. Under the first specification the spell duration is 90 days, the length of time they have spent on UC. Under the second specification it is 30 days as this is the time at which they enter into a state in which they are earning. ↩
-
UC entitlement reduces with earnings according to the UC taper rate. ↩
-
Note a higher spell exit rate is equivalent to a shorter spell duration. The two terms are used interchangeably in this report. ↩
-
This is based on the 3 months immediately after the UC claim end date. If any record of earnings is observed, the spell is classified as an exit with PAYE earnings. Claimants without PAYE earnings in all 3 months are classified as having left without PAYE earnings. This could be non-PAYE employment (including self-employment), or economic inactivity (including full-time education). Strictly, non-PAYE employment also includes earnings at a company where none of the employees are paid £120 or more a week, get expenses and benefits, have another job or get a pension. ↩
-
Financially it could be a net cost to claimants with only the standard allowance in payment who would get no financial reward but still incur travel, time and monitoring costs to comply with conditionality requirements. ↩
-
The importance of low labour market attachment is supported by the fact that sanctions are often quite short (and therefore of low cost to the claimant) and by the fact that the definition used for claimants who exit without PAYE earnings is that they do not have earnings for all three months after they exit UC, a state which is therefore of continued low financial benefit to the claimant. ↩
-
See also the discussion in section 2.2. ↩
-
Theoretically, this can be framed as the UC caseload consisting of some claimants who have marginal products lower than the minimum wage, who would therefore struggle to be employable regardless of their individual incentives. Another factor is the existence of hardship payments on Universal Credit, which as discussed in section 2.2, may act to mitigate the effect of a sanction on incentives for work search. ↩
-
As discussed in section 4, this is based on the characteristics of claimants as observed in the first period of their claim. Results are produced by running separate hazard regressions for each sub-group. These groups are not mutually exclusive so a claimant may ‘appear’ in more than one row (the effect sizes in the table are not additive). ↩
-
All the parameter estimates are statistically significant but this is due in part to the large sample size. The magnitudes themselves may not be material given the contribution of unobserved heterogeneity that may still not have been fully accounted for by the control variables ↩
-
At least not immediately — the information in the model ends with the first job of a claimant who ends their UC spell— it is conceivable that those earnings might be recovered at a later date. Note also that states where claimants have exited ‘UC Intensive’ with earnings but are still on UC will correspond to UC work groups where claimants are not subject to mandatory requirements and sanctions. ↩
-
See section 2.1 ↩
-
This is the figure as of April 2020. For a couple, the threshold is £549. ↩
-
In addition, the parallel trends assumption is less likely to be valid if the period before and after a sanction was used instead of the period before and after a spell. This is because sanctioned claimants have longer spell durations, so will mechanically have higher earnings as a result of spending less time with their earnings below the AET. ↩
-
See Appendix 4 for the complete model specification. ↩
-
Not mentioned is α, the intercept, which is the average earnings change conditional on all independent variables being equal to 0. ↩
-
Note the employment result is economically small but nevertheless statistically significant due to the large sample size used. ↩
-
Strictly, their reservation wage, the minimum wage offer for which they would accept a job. ↩
-
And polynomials of spell duration to pick up any non-linearities ↩
-
This would only invalidate the results if the spell length were not caused by the sanction but is just associated with the type of claimants that are sanctioned. Controlling for spell length removes both causal and non-causal variation. For this reason spell length is not included as a control in the main specification. ↩
-
Results not reported ↩
-
Note this changes the sample as not all claimants who have 6 months of post-spell data will also have 12 months. ↩
-
The average claimant will earn £38 per month less as a result of a sanction over the 12 months post exit from UC ‘Intensive’. ↩
-
4% of the sample are carers, corresponding to c 22,000 claimants of which c. 500 are sanctioned in their first spell. ↩
-
See table in Appendix 1a for full details. ↩
-
1095 days was the length of a high level sanction (>=3rd escalation) in the sample period for this study. This was reduced to 182 days in November 2019. See table in Appendix 1. ↩
-
For example, if a claimant has a high level and a low level sanction imposed in a spell, the claimant will be grouped as a ‘high level sanction’ claimant. ↩
-
91% of sanctioned claimants in the period January 2016 to April 2019. ↩
-
The higher volatility prior to January 2019 could be driven by different composition of claimants in this period as UC live service claimants made a bigger contribution to the statistics. ↩
-
Prior to the start of lockdown on March 16th, that is. ↩
-
This could push the results in either a positive or negative direction, depending on whether the more positive earnings outcomes are unobserved in the sanctioned or non-sanctioned group. ↩
-
There is a broad evidence base supporting the effectiveness of regimes of weekly and fortnightly signing, see discussion in section 1.1 ↩
-
A claimant on the health journey either has a fit note and is awaiting their Work Capability Assessment or has passed it, putting them in the ‘No Work Requirements’ or ‘Work preparation’ UC work groups. ↩
-
The full variable list is described in appendix 2. ↩
-
The full variable list is described in appendix 2. ↩