Libraries - Taking Part Survey 2019/20
Published 16 September 2020
Applies to England

© Crown copyright 2020
This publication is licensed under the terms of the Open Government Licence v3.0 except where otherwise stated. To view this licence, visit nationalarchives.gov.uk/doc/open-government-licence/version/3 or write to the Information Policy Team, The National Archives, Kew, London TW9 4DU, or email: psi@nationalarchives.gov.uk.
Where we have identified any third party copyright information you will need to obtain permission from the copyright holders concerned.
This publication is available at https://www.gov.uk/government/statistics/taking-part-201920-libraries/libraries-taking-part-survey-201920
The Taking Part survey is a continuous face to face household survey of adults aged 16 and over and children aged 5 to 15 years old in England. This chapter summarise results from adults (16+) and their engagement with libraries from the 2019/20 survey, which ran from April 2019 to March 2020.
Differences between groups are only reported on in this publication where they are statistically significant i.e. where we can be confident that the differences seen in our sampled respondents reflect the population [footnote 1].
1. Definitions
Public library use covers any use of a public library service and is not restricted to visiting in person to borrow books. This includes going to the library to do printing, taking part in a reading group and using on-line library resources. A full list can be found in Annex C
This definition was changed in 2016/17. Results from earlier years are therefore not directly comparable. Two measures of library participation are included in the survey: (i) use of a public library service for any purpose and (ii) use of a public library service in the respondent’s own time or voluntarily. The first measure, asked since 2016/17 includes use for employment or studying whilst the second, asked since 2005/06, does not.
2. Using libraries
In 2019/20, 34% of respondents reported having used a public library service in the last 12 months for any purpose. This is similar to the years from 2016/17. In 2019/20, 31% of respondents reported having used a public library service in the last 12 months voluntarily or in their own time. This is similar to recent years but does demonstrate a long-term fall from 48% of respondents in 2005/06.
Figure 4.1: Proportion of respondents who have used public library services in the past 12 months, 2005/06 to 2019/20
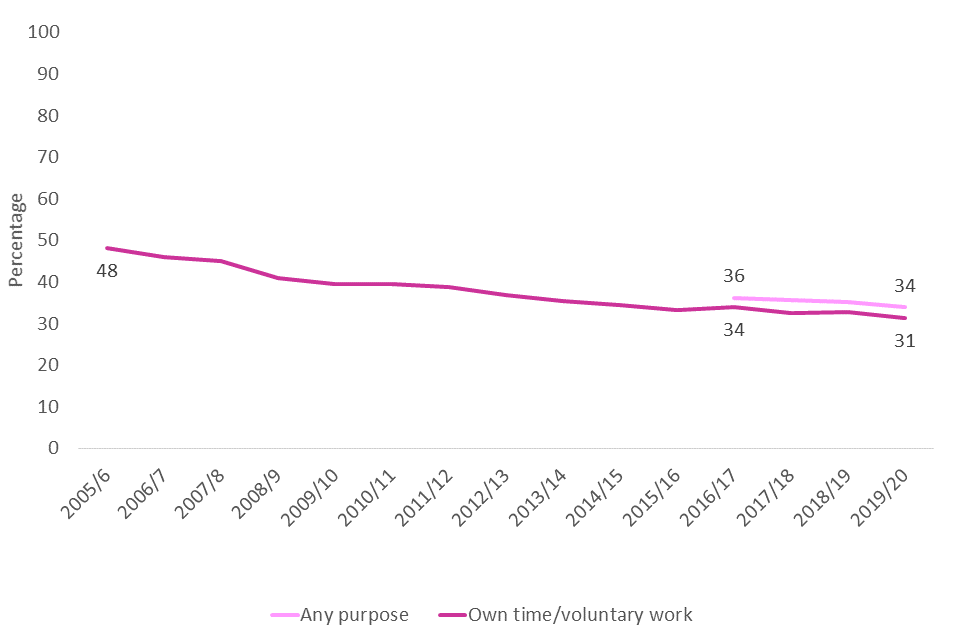
Percentage of respondents who have visited a library for any purpose, or for own time/voluntary work from 2005/6 to 2019/20
In 2019/20, 93% of those who had visited a public library for any purpose reported doing so in their own time, 10% for academic study, 4% for paid work and 1% as part of voluntary work, similar to 2018/19.
Figure 4.2 shows how frequently respondents use library services (including online) for any purpose. Similar to the previous year, 5% of respondents said they had used library services at least once a week in the past 12 months, 10% less often than once a week but at least once a month, and 10% less often than once a month but at least 3 or 4 times a year. 66% of respondents had not visited at all.
Figure 4.2: Frequency of library service use for any purpose (including online), 2018/19 and 2019/20
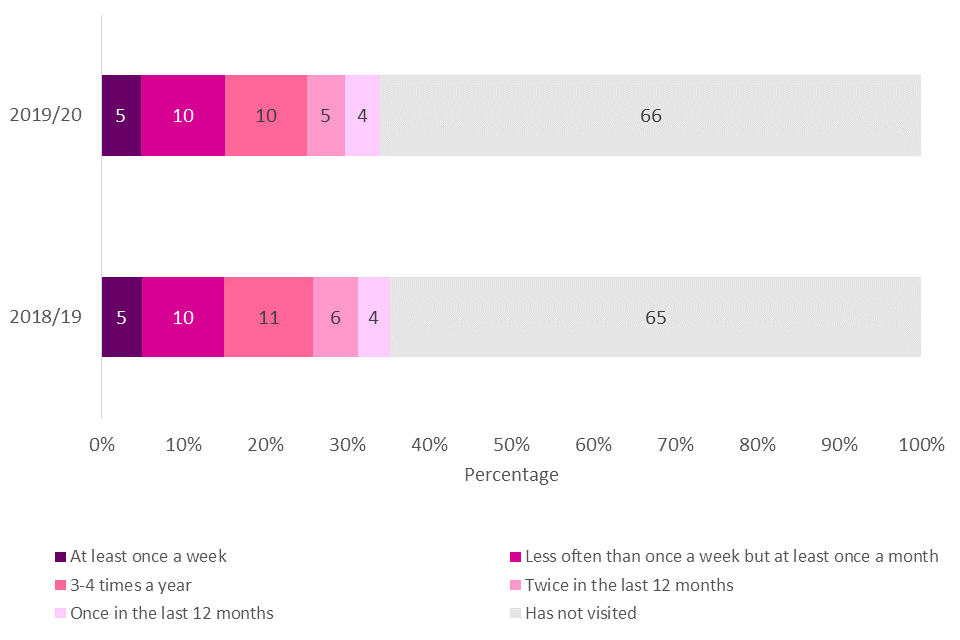
Frequency of visiting libraries, 2018/19 and 2019/20
The following findings refer to public library use in own time or voluntarily only unless otherwise specified.
In 2019/20, 96% of respondents who had used a public library service (in own time or voluntarily) in the past 12 months reported having visited a library building or mobile library in that time. Of these, 73% reported having borrowed items such as books, newspapers, music, CDs, DVDs or audiobooks. The next most popular reason was to use a computer and printing facilities (26%) followed by taking their child or someone else’s child to an event (20%). No activities significantly changed in popularity from 2018/19.
Figure 4.3: Five most commonly reported reasons for visiting a public library building or mobile library (any purpose), 2019/20
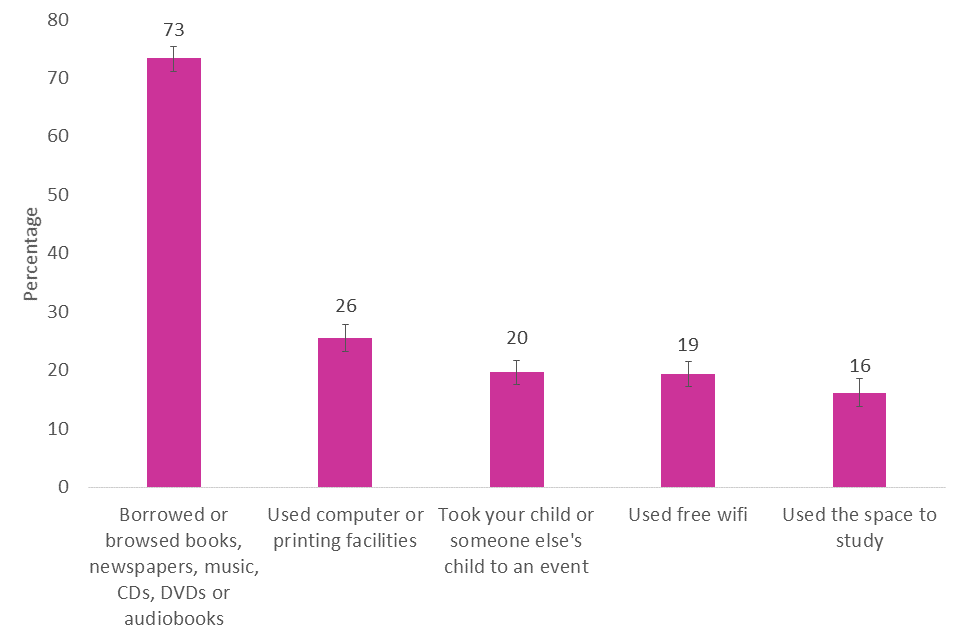
Most common reasons for visiting a library in person, 2019/20
An estimated 17% of respondents report accessing library services online in the last 12 months and most of these (69%) had done so for services such as reserving/renewing books or paying a fine. 59% of those accessing online library services had searched and viewed information or made an enquiry, 40% viewed the library website for information relating to library access (e.g. location or opening hours) and 33% borrowed an electronic resource without visiting the library (e.g. downloaded an e-book).
Figure 4.4: Most commonly reported reasons for accessing library services (any purpose), 2019/20
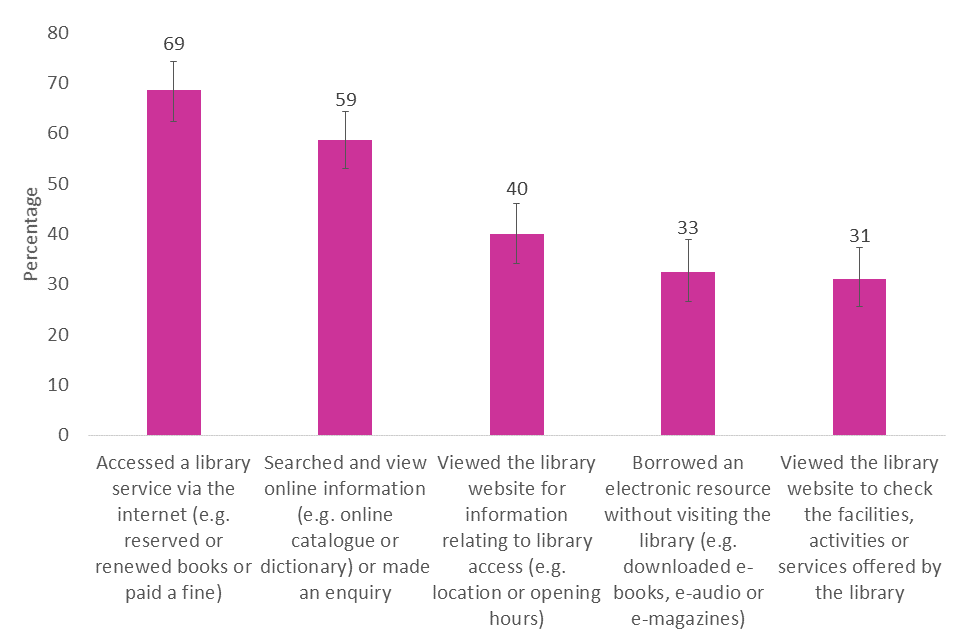
Most common reasons for using online library services, 2019/20
Those who had not used a library service in the last 12 months were asked for reasons for not doing so. In 2019/20, 60% reported that they did not need these services and 20% said that they did not have time.
Figure 4.5: Most commonly reported reasons for not having used library services in the past 12 months (any purpose), 2019/20
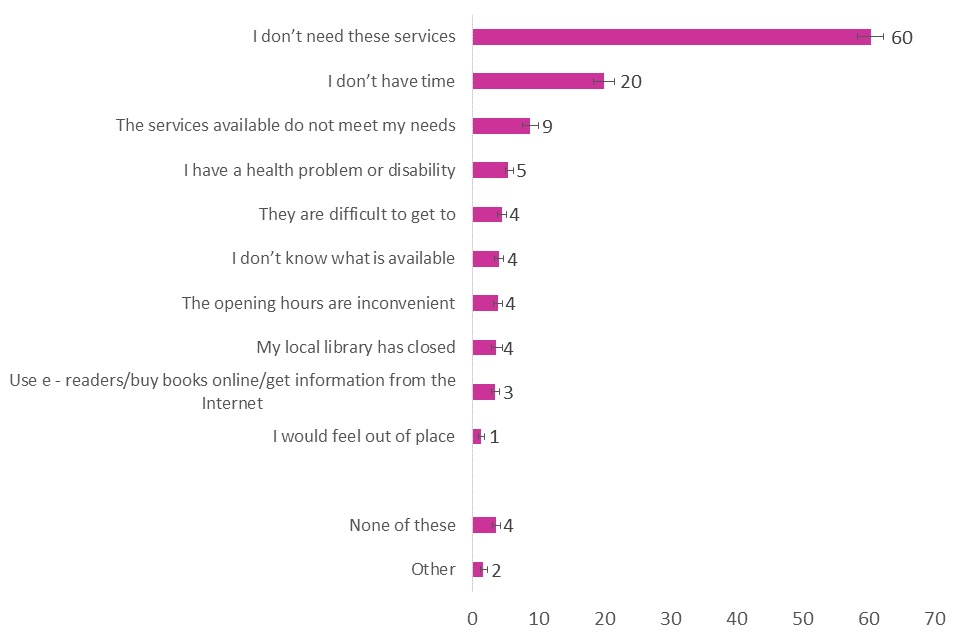
Most commonly reported barriers for visiting a library, 2019/20
3. Volunteering in a public library
An estimated 2% of respondents reported having volunteered in a sector connected with libraries in the past 12 months. For headline statistics on volunteering please see results from DCMS’ Community Life Survey.
4. Who uses library services?
The age group 16-24 years old were the least likely to have visited a library (21%) compared to all other age groups (29-37%). Though the proportion of respondents reporting public library use has fallen for all ages between 2005/06 and 2019/20, this has been particularly so for those aged 16-24. Between 2005/06 and 2018/19, there was fall from 51% to 21% for 16-24 year olds, respectively.
Figure 4.6 Percentage of respondents who have visited a library in the last 12 months by age, 2019/20
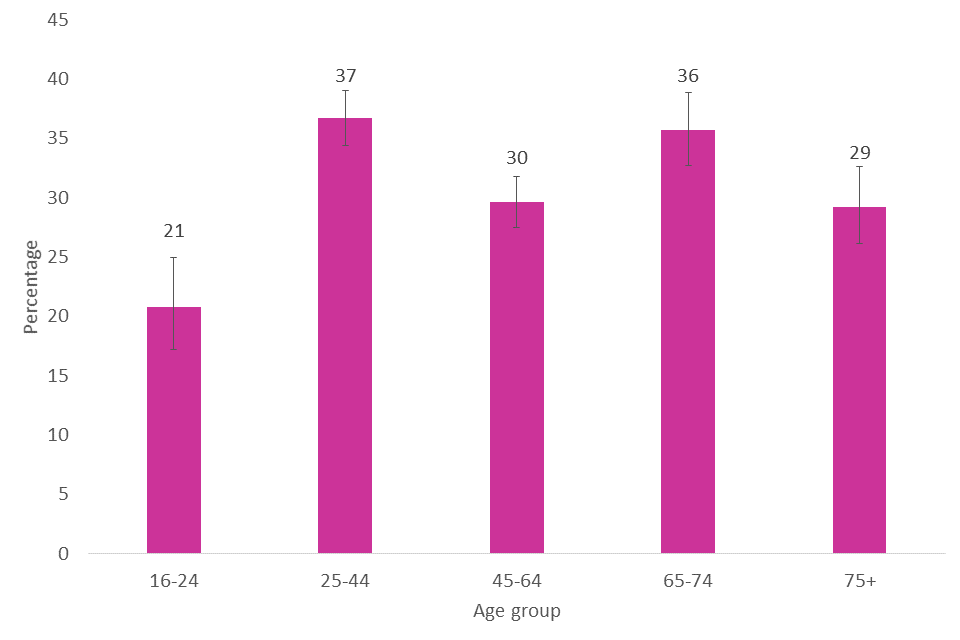
Percentage of respondents who have visited a library in the last 12 months by age, 2019/20
In 2019/20, Asian respondents were more likely to have visited a library (42%) than White respondents (30%), similar to the trend observed in 2018/19.
Figure 4.7 Percentage of respondents who have visited a library in the last 12 months by ethnicity, 2019/20
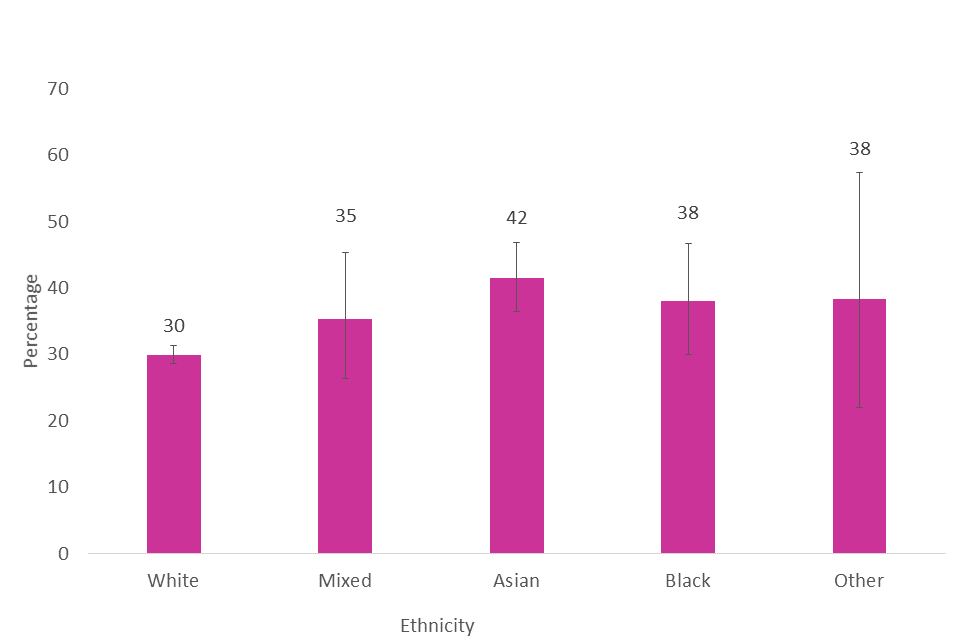
Percentage of respondents who have visited a library in the last 12 months by ethnicity, 2019/20
Library usage in London (38% of respondents) was higher than in many other regions (26-29%), including the North East, Yorkshire and the Humber, the East Midlands, the West Midlands, and the South West.
Figure 4.8 Percentage of respondents who have visited a library in the last 12 months by region, 2019/20
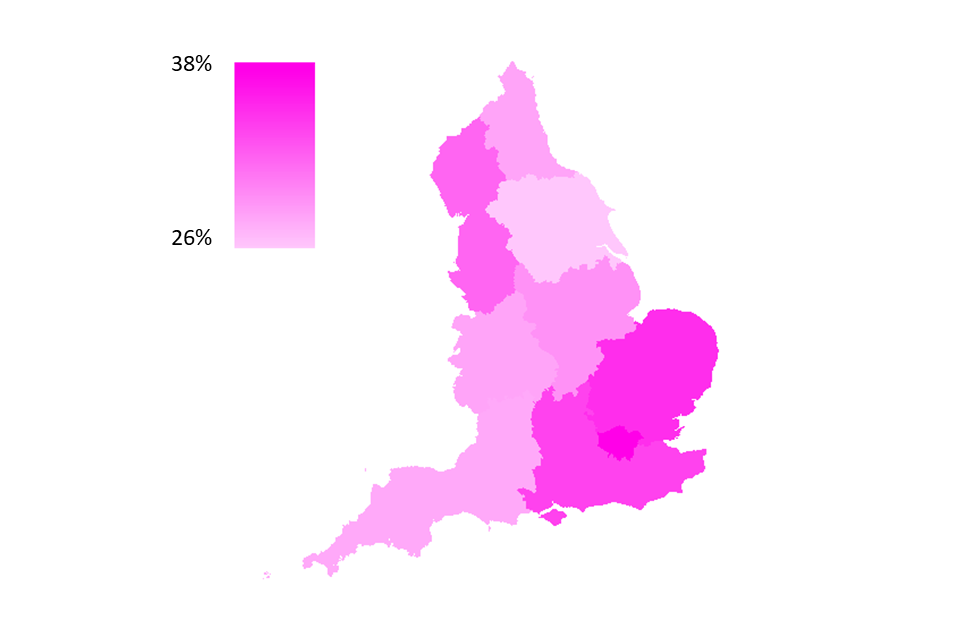
Percentage of respondents who have visited a library in the last 12 months by region, 2019/20
Women were more likely to have visited a library (37%) in 2019/20 compared to men (26%).
Looking at socio-economic status [footnote 2], those with higher managerial, administrative and professional occupations were more likely (37%) to have visited than those with intermediate, or routine and manual occupations (28-29%).
4.1 Further demographic data
- No significant variability seen with Index of Multiple deprivation [footnote 3], disability, work status, or tenure
-
The 95% confidence intervals are indicated by error bars on the charts. They show the range that we are 95% confident the true value for the population falls between. When there is no overlap between the error bars for two or more groups, we can be more confident that the differences between groups represent true differences between these groups in the population ↩
-
Using National Statistics Socio-economic classification (NS-SEC), respondents were categorised as being in one of three groups – Higher managerial, adminisitative and professional occuptions; Intermediate occuptions; Routine occupations. The NS-SEC classifies people depending on their employment. For more information see Annex B. ↩
-
The Index of Multiple Deprivation, commonly known as the IMD, is the official measure of relative deprivation for small areas in England. It is calculated using several measures such as income deprivation, crime and living environment deprivation. The Index of Multiple Deprivation ranks every small area in England from 1 (most deprived area) to 32,844 (least deprived area), which we have sorted into deciles for this publication. ↩